Flow Meters Market Size and Share
Market Overview
| Study Period | 2020 - 2031 |
|---|---|
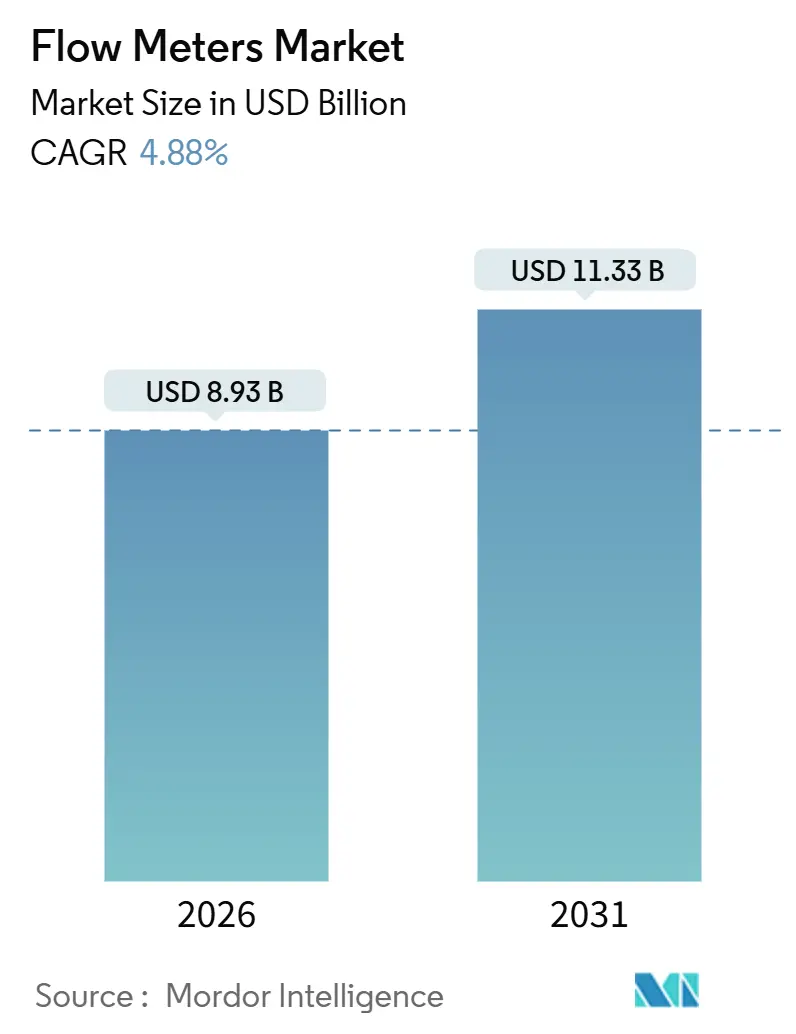
| Market Size (2026) | USD 8.93 Billion |
| Market Size (2031) | USD 11.33 Billion |
| Growth Rate (2026 - 2031) | 4.88% CAGR |
| Fastest Growing Market | Europe |
| Largest Market | Asia Pacific |
| Market Concentration | Medium |
Major Players *Disclaimer: Major Players sorted in no particular order Image © Mordor Intelligence. Reuse requires attribution under CC BY 4.0. | |
Flow Meters Market Analysis by Mordor Intelligence
The flow meters market size is valued at USD 8.93 billion in 2026 and is projected to reach USD 11.33 billion by 2031, reflecting a 4.88% CAGR over the forecast period. Gains are paced by rapid investment in hydrogen blending, carbon-capture and single-use bioprocessing, which demand accuracy beyond the reach of legacy volumetric meters. Mass-based Coriolis and thermal instruments are therefore expanding twice as fast as differential-pressure and turbine designs, while ultrasonic technology is gaining ground in custody-transfer gas pipelines. Parallel shifts in buyer criteria - from hardware cost to total cost of ownership - are nudging utilities and chemical producers toward meters with integrated analytics and predictive diagnostics. Competitive strategies now revolve around digital-twin compatibility, battery-powered field deployment and cybersecurity certifications, all of which unlock incremental revenue from software subscriptions and calibration services.
Key Report Takeaways
- By technology, mass flow meters captured 29.1% revenue share in 2025, while Coriolis and thermal designs are advancing at a 7.4% CAGR to 2031
- By mounting, in-line meters held 48.2% of the flow meters market share in 2025, whereas clamp-on installations are forecast to escalate at a 5.9% CAGR through 2031
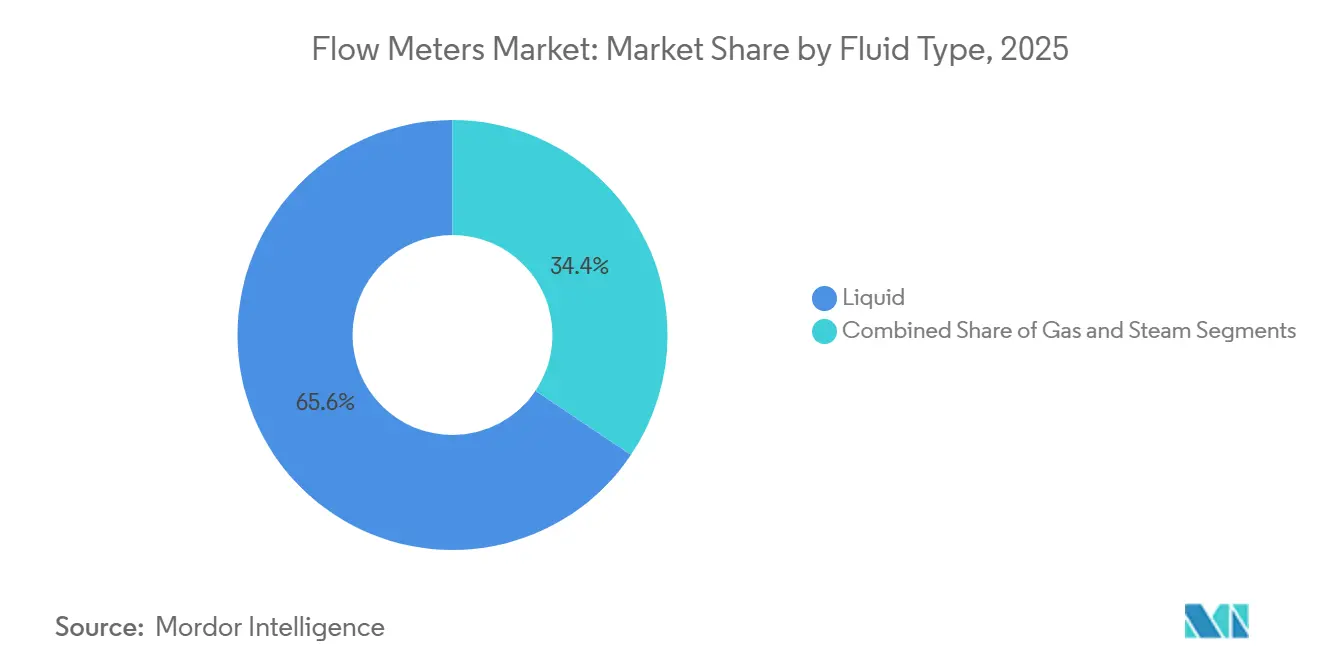
- By fluid type, liquid applications accounted for 65.6% of the flow meters market size in 2025; gas metering is projected to climb at a 6.2% CAGR over 2026-2031
- By end-user, water and wastewater utilities led with 29.4% revenue in 2025 and are expanding at a 6.7% CAGR, outstripping oil and gas growth of 4.1%
- By geography, Asia-Pacific generated 38.9% of 2025 revenue; Europe is the fastest-growing geography with a 5.3% CAGR anticipated to 2031
Note: Market size and forecast figures in this report are generated using Mordor Intelligence’s proprietary estimation framework, updated with the latest available data and insights as of January 2026.
Global Flow Meters Market Trends and Insights
Drivers Impact Analysis*
| Driver | (~) % Impact on CAGR Forecast | Geographic Relevance | Impact Timeline |
|---|---|---|---|
| IoT-enabled Process Automation for Real-Time Flow Analytics | +1.2% | Global, with Asia-Pacific and Europe leading adoption | Medium term (2-4 years) |
| Global Water and Wastewater Infrastructure Investments | +1.0% | North America, Europe, Asia-Pacific (China, India) | Long term (≥ 4 years) |
| Energy-Sector Safety and Accuracy Compliance Mandates | +0.8% | Europe, North America, Middle East | Short term (≤ 2 years) |
| Brownfield Demand for Battery-Powered Clamp-On Retrofits | +0.6% | North America, Europe (oil & gas, chemicals) | Medium term (2-4 years) |
| Multiphase-Flow Metering Needs in CCUS Projects | +0.5% | Europe, North America, Middle East | Long term (≥ 4 years) |
| District Heating/Cooling Smart-Meter Roll-Outs | +0.4% | Europe (Germany, Denmark, Poland), China | Medium term (2-4 years) |
| Source: Mordor Intelligence | |||
IoT-Enabled Process Automation For Real-Time Flow Analytics
Industrial sites are upgrading meters so that each device becomes an edge-computing node delivering one-second interval data streams. Platforms such as Yokogawa OpreX analyze drift and cavitation, then automatically adjust control valves to maintain ±0.5% set-points[1]Source: Yokogawa Electric Corporation, “OpreX Asset Operations and Management,” yokogawa.com. Pharmaceutical continuous-manufacturing lines rely on the same feedback loops to stay within U.S. Food and Drug Administration process analytical technology guidelines. Siemens disclosed that predictive analytics embedded in its ultrasonic meters cut unscheduled chemical-plant downtime by 22% in 2025. Real-time visibility also links with enterprise software; a European beverage producer tied electromagnetic meters to SAP S/4HANA and trimmed raw-material waste by 14%.
Global Water And Wastewater Infrastructure Investments
Utilities losing 25% to 40% of treated water to leaks are replacing mechanical meters with battery-powered ultrasonic and electromagnetic alternatives. China earmarked CNY 150 billion (USD 21 billion) in 2025 to digitize networks across 100 cities. India’s Jal Jeevan Mission introduced prepaid meters that lowered non-revenue water from 42% to 28% in Jaipur within 18 months. In the United States, USD 55 billion from the Bipartisan Infrastructure Law channels funding toward hourly-data advanced metering installations[2]Source: U.S. Environmental Protection Agency, “Bipartisan Infrastructure Law Water Funding,” epa.gov. European consulting estimates show potential recovery of EUR 8 billion annually if smart meters eliminate undetected losses.
Energy-Sector Safety And Accuracy Compliance Mandates
Revisions to international custody-transfer standards require ±0.2% accuracy for liquefied natural gas metering, performance that only Coriolis and multipath ultrasonic devices achieve. Norway ordered offshore platforms to add redundant meters with self-diagnostics after a revenue discrepancy on the Troll field. Saudi Aramco is fitting 1,200 fiscal-transfer points with Emerson Coriolis units to avoid penalties tied to drift beyond ±0.15%. United States pipeline integrity regulations now oblige hazardous-liquid operators to install leak-detection algorithms, accelerating adoption of clamp-on ultrasonic meters that avoid welding.
Brownfield Demand For Battery-Powered Clamp-On Retrofits
Aging refineries and chemical plants rarely tolerate long shutdowns, so they prefer non-invasive clamp-on meters that sidestep hot-work permits. KROHNE’s OPTISONIC 8300 delivers 10-year battery life and LoRaWAN connectivity, enabling fast installation in classified areas. A Gulf Coast petrochemical complex cut retrofit spending to USD 340,000, versus USD 1.8 million for inline options, by eliminating scaffolding and depressurization. Endress+Hauser’s portable Proline unit records data 15 minutes after arrival, a pace prized for troubleshooting and functional safety validations. Updated IEC 61508 rules now acknowledge clamp-on technology for Safety Integrity Level 2 duties, opening doors in nuclear and pharmaceutical facilities.
Restraints Impact Analysis*
| Restraint | (~) % Impact on CAGR Forecast | Geographic Relevance | Impact Timeline |
|---|---|---|---|
| High CAPEX of Advanced Coriolis and Ultrasonic Meters | -0.7% | Global, acute in South America, Africa, Southeast Asia | Short term (≤ 2 years) |
| Skilled-Calibration and Maintenance Talent Shortage | -0.5% | North America, Europe, Middle East | Medium term (2-4 years) |
| Cyber-Security Exposure of Wireless Smart Meters | -0.3% | Global, with heightened concern in North America, Europe | Short term (≤ 2 years) |
| Semiconductor Shortages for Ultrasonic Transducers | -0.4% | Global, supply concentrated in Taiwan, South Korea | Medium term (2-4 years) |
| Source: Mordor Intelligence | |||
High CAPEX Of Advanced Coriolis And Ultrasonic Meters
Acquisition prices run three to ten times higher than electromagnetic or vortex alternatives, prompting cash-constrained utilities to delay upgrades. A 4-inch Coriolis meter can cost USD 12,000-18,000, compared with USD 2,500-4,000 for an electromagnetic counterpart[3]Source: Emerson Electric Co., “Micro Motion Coriolis Meters,” emerson.com. Specialized mounting, vibration-isolation, and zeroing steps add another USD 3,000-5,000 to commissioning. Lifecycle economics favor premium meters, but procurement teams often concentrate on upfront budgets. Subscription-based meter-as-a-service offerings are emerging to convert capital expense into operating expense and accelerate adoption.
Cyber-Security Exposure Of Wireless Smart Meters
Hard-coded credentials and unencrypted firmware channels have triggered multiple advisories. CISA’s 2025 alert listed 14 vulnerable models across six vendors. Ransomware altered flow data at a European water utility, forcing a 48-hour boil-water order and highlighting the stakes for public health. ISA/IEC 62443 now mandates encrypted communication, secure boot and role-based access controls, yet only 31% of installed meters meet the standard. Vendors responded by embedding hardware security modules; Schneider Electric added TPM 2.0 and WireGuard VPN support at an incremental USD 800 per device.
*Our forecasts treat driver/restraint impacts as directional, not additive. The impact forecasts reflect baseline growth, mix effects, and variable interactions.
Segment Analysis
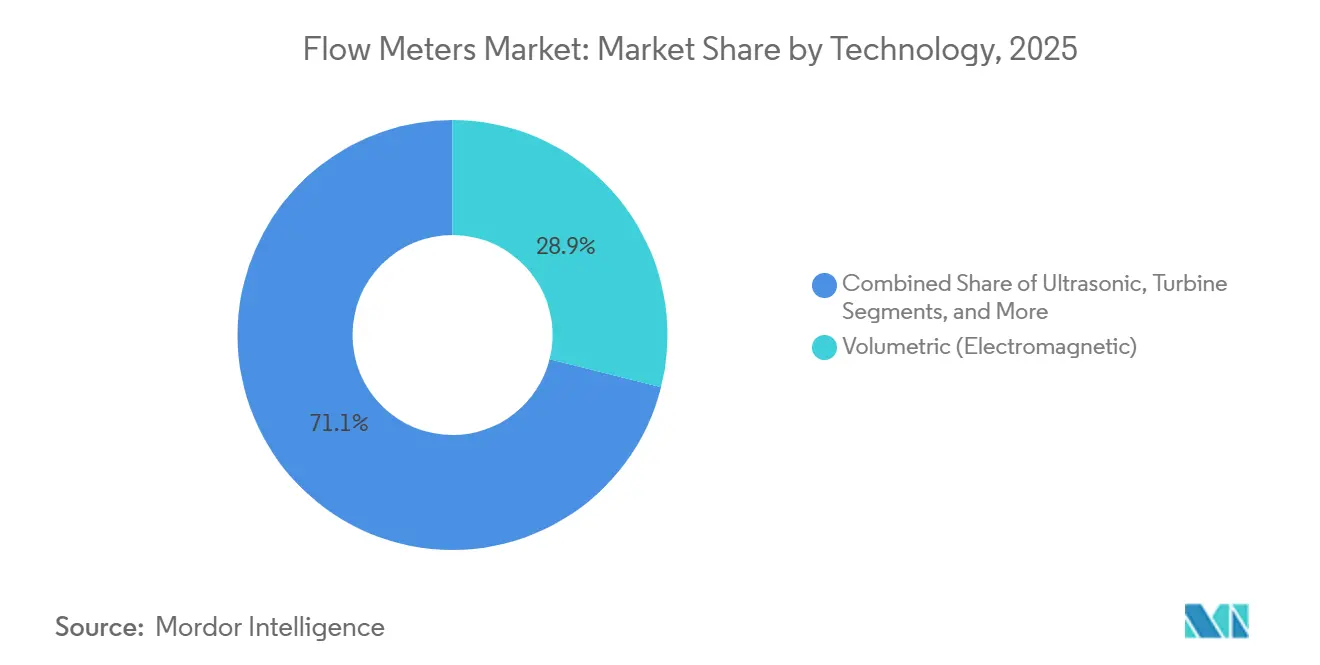
By Technology: Precision Requirements Drive Mass-Flow Adoption
Mass-based methods accounted for USD 2.6 billion in 2025 and are advancing at a 7.4% CAGR. The flow meters market benefits as hydrogen blending and carbon-capture sequestration demand direct mass measurement immune to density shifts. Coriolis meters have become the default choice for liquefied CO₂ custody transfer, illustrated by the Northern Lights CCS project in Norway, which operates at 100 bar with ±0.05% uncertainty. Ultrasonic designs are displacing turbines in gas distribution because they keep ±1.5% accuracy when hydrogen reaches 20% of volume.
Volumetric technologies still hold 28.9% of 2025 revenue, anchored by electromagnetic meters in municipal water networks. Differential-pressure orifice plates remain common in steam lines, though they require 10-20 diameters of straight pipe. Thermal mass sensors are flourishing in biogas and compressed-air loops, where low flow rates compromise turbine performance. Positive-displacement units persist in fuel-dispensing and viscous-liquid batching. Vortex meters offer a mid-price, low-maintenance option for power-plant steam. Collectively, these trends underscore a structural rotation inside the flow meters industry toward high-accuracy, self-diagnosing devices that integrate seamlessly with digital-twin software.


By Mounting/Installation: Non-Invasive Retrofits Gain Momentum
In-line hardware represented 48.2% of 2025 revenue but is growing at a slower 4.2% pace because brownfield sites face downtime penalties if pipes are cut. Clamp-on variants, by contrast, are expanding at 5.9% and permit installation without depressurization. A North American midstream operator retrofitted 120 lines in eight weeks using clamp-on ultrasonic devices at 62% lower cost than in-line alternatives. Insertion probes, which penetrate but do not replace pipe sections, are finding niches in large-diameter water mains.
Battery innovations extend field life to 10-15 years, letting meters act as wireless IoT nodes. Functional-safety certification for Safety Integrity Level 2 has widened the addressable market to nuclear and pharmaceutical plants. Still, custody-transfer points continue to rely on in-line meters that deliver ±0.1% certainty. The flow meters market now segments by tolerance as much as by mechanics, with end users balancing cost, accuracy and downtime avoidance.
By Fluid Type: Gas Metering Accelerates With Hydrogen And LNG
Liquid applications generated 65.6% of 2025 revenue, yet gas metering is growing faster at 6.2% through 2031. Germany’s hydrogen-blend rule compels replacement of 2.3 million turbine meters with ultrasonic models by 2028. The Netherlands’ HyWay27 will install more than 300 ultrasonic meters to track pure hydrogen flows at distribution pressure. LNG export terminals are deploying multipath ultrasonics to maintain ±0.15% accuracy from -162 °C to +50 °C.
Steam metering also shows momentum as district-heating operators move from orifice plates to vortex sensors, reducing pressure drop and maintenance. On the liquid side, pharmaceuticals are adopting single-use Coriolis meters that eliminate cleaning validation, while food processors choose hygienic electromagnetic units for clean-in-place cycles. The flow meters market therefore spans temperature extremes from cryogenic LNG to boiling steam, highlighting the breadth of technological requirements.
By End-User Industry: Utilities Anchor Demand, While Upstream Oil Slows
Water and wastewater utilities controlled 29.4% of 2025 sales and are advancing at 6.7% as leakage-reduction targets tighten worldwide. Oil and gas remains sizable but trails at 4.1% CAGR as capital shifts from exploration to midstream measurement upgrades. Chemical plants adopt Coriolis meters for batch accuracy and raw-material savings. Power stations deploy vortex sensors in steam loops and ultrasonic units in cooling-water systems. Food and beverage plants specify 3-A-certified Coriolis and electromagnetic designs to shorten clean-in-place cycles.
Pharmaceutical and biotechnology facilities are a high-growth niche, turning to single-use meters that prevent cross-contamination in continuous bioprocessing lines. Metals and mining rely on rugged electromagnetic units for abrasive slurry, while pulp and paper mills meter both steam and process water. These sector-specific use cases collectively diversify revenue streams, making the flow meters market less dependent on the oil cycle than a decade ago.
Geography Analysis
Asia-Pacific accounted for 38.9% of 2025 revenue, powered by China’s CNY 150 billion smart-water initiative and India’s leak-detection mandates. Japan leverages edge-computing analytics in chemical and electronics plants, while South Korea fits thermal mass sensors in expanding semiconductor fabs. Growth also reflects large-scale hydrogen pilot pipelines in Australia and LNG export expansion in Malaysia.
Europe is forecast to lead growth at a 5.3% CAGR. Germany’s hydrogen-blend rule moves millions of meters to ultrasonic technology, Denmark’s district-heating networks install heat meters to comply with European Union energy-efficiency regulations, and the United Kingdom pursues a 50% leakage-reduction goal that stimulates smart-meter procurement. Additionally, Norway’s CCS projects and France’s hydrogen stations accelerate demand for custody-transfer Coriolis devices.
North America grows at 4.6% as the United States directs USD 55 billion to water infrastructure and midstream oil operators modernize custody meters. The Middle East invests heavily in desalination, using electromagnetic devices to monitor feedwater and brine. South America’s prospects improve after Brazilian utility privatizations unlock smart-meter funding, while Africa shows selective progress with prepaid municipal installations in South Africa and pilot bulk-supply meters in Nigeria. Collectively, these regional programs underpin a broad global baseline for the flow meters market.


Competitive Landscape
The top five suppliers, Emerson, Endress+Hauser, ABB, Siemens and Yokogawa - collectively hold about 40% of revenue, a level that classifies the flow meters market as moderately concentrated. Emerson deepened its software footprint by acquiring NI Corporation for USD 8.2 billion, adding LabVIEW and TestStand integration to its Micro Motion meters. Endress+Hauser embeds Heartbeat self-diagnostics across Coriolis and electromagnetic lines, stretching calibration intervals from one to three years. ABB now bundles meters with its Ability digital-control suites, locking in clients through integrated automation.
Chinese firms such as Sinomeasure undercut prices by up to 40%, forcing incumbents to differentiate via cybersecurity, predictive analytics and vertical-specific certifications. Niche innovators like Bronkhorst target microfluidics in semiconductor and life-science markets, using MEMS thermal sensors that measure sub-milliliter flows. Patent filings for artificial-intelligence flow-profiling surged to 127 in Europe during 2025, with Siemens and Emerson leading. Overall, differentiation is shifting from mechanical design to embedded software, service networks and compliance credentials.
Flow Meters Industry Leaders
Yokogawa Electric Corporation
ABB Ltd
Siemens AG
Bronkhorst High-Tech BV
Honeywell International Inc.
- *Disclaimer: Major Players sorted in no particular order

Recent Industry Developments
- January 2026: Emerson Electric Co. launched the Micro Motion G-Series Coriolis meter with hardware security modules and encrypted HART-IP communication.
- December 2025: Endress+Hauser AG opened a EUR 45 million (USD 48 million) plant in Aurangabad, India, to produce electromagnetic and ultrasonic meters for Asia-Pacific.
- November 2025: Siemens AG partnered with TotalEnergies to equip 85 hydrogen refueling stations in France and Germany with SITRANS ultrasonic meters.
- October 2025: ABB Ltd acquired Severn Trent Services’ calibration business for USD 120 million, adding 14 ISO 17025 laboratories in North America and Europe.


Research Methodology Framework and Report Scope
Market Definitions and Key Coverage
Our study defines the global flow meters market as revenue generated from newly manufactured devices that measure volumetric or mass flow of liquids or gases inside closed piping, covering electromagnetic, ultrasonic, Coriolis, differential-pressure, turbine, vortex, and positive-displacement designs. Portable testers shipped with integrated transmitters and embedded firmware are counted within scope.
Refurbished equipment, stand-alone flow sensors lacking on-board signal processing, rental fleets, and aftermarket calibration or maintenance contracts are excluded.
Segmentation Overview
- By Technology
- Volumetric
- Differential Pressure
- Electromagnetic
- Ultrasonic
- Turbine
- Positive Displacement
- Vortex
- Mass
- Coriolis
- Thermal Mass
- Volumetric
- By Mounting/Installation
- In-Line
- Clamp-On/External
- Insertion
- By Fluid Type
- Liquid
- Gas
- Steam
- By End-User Industry
- Oil and Gas
- Water and Wastewater
- Chemical and Petrochemical
- Power Generation
- Food and Beverage
- Pulp and Paper
- Pharmaceuticals and Biotechnology
- Metals and Mining
- Other End-User Industries
- By Geography
- North America
- United States
- Canada
- Mexico
- South America
- Brazil
- Argentina
- Rest of South America
- Europe
- Germany
- United Kingdom
- France
- Italy
- Spain
- Rest of Europe
- Asia-Pacific
- China
- India
- Japan
- South Korea
- Australia and New Zealand
- Rest of Asia-Pacific
- Middle East
- Saudi Arabia
- United Arab Emirates
- Turkey
- Rest of Middle East
- Africa
- South Africa
- Nigeria
- Egypt
- Rest of Africa
- North America
Detailed Research Methodology and Data Validation
Primary Research
Structured interviews with instrumentation engineers, procurement heads at water utilities, oil and gas operators, and regional distributors across Asia Pacific, North America, Europe, and the Gulf let us test desk-derived assumptions, capture live ASP movements, and verify adoption rates for smart diagnostics.
Desk Research
Mordor analysts gather foundational signals from tier-one sources such as the International Energy Agency, United States Geological Survey, Eurostat industrial production files, and the Water Environment Federation, with shipment statistics drawn from Volza. Company 10-K filings, investor decks, and patent families accessed through Questel enrich technology timelines and pricing corridors. The sources named illustrate the range consulted; many additional open databases and newsfeeds helped round out historical demand and supply patterns.
Market-Sizing & Forecasting
A top-down build begins with industrial value added and utility capital spending to reconstruct the addressable demand pool, followed by sampled vendor shipment totals and ASP × volume checks to fine-tune results. Variables tracked, such as rig count, municipal desalination capacity additions, refinery throughput, smart factory index shifts, replacement-cycle length, and average meter life, feed a multivariate regression that projects 2026-2030 growth. Bottom-up gaps where channel data run thin are bridged with analogs from adjacent fluid-control hardware and aligned to expert feedback before sign-off.
Data Validation & Update Cycle
Outputs pass automated variance scans, peer review by a senior analyst, and reconciliation against quarterly earnings surprises. Reports refresh yearly, with interim updates triggered by price shocks, regulatory changes, or major mergers, ensuring every client receives an up-to-date view.
Why Mordor's Flow Meter Baseline Earns Credibility
Published estimates often diverge because firms select different product baskets, price ladders, and refresh cadences, a reality we acknowledge up front so buyers grasp the roots of variation.
Key gap drivers include some publishers folding in retrofit services, using alternative currency conversion dates, or projecting aggressive IIoT premiums that inflate smart meter revenue.
Benchmark comparison
| Market Size | Anonymized source | Primary gap driver |
|---|---|---|
| USD 8.46 B (2025) | Mordor Intelligence | |
| USD 9.10 B (2024) | Global Consultancy A | Counts steam and open-channel meters plus maintenance contracts |
| USD 11.31 B (2025) | Industry Research B | Applies retail-level mark-ups and bundles OEM service kits |
| USD 9.92 B (2025) | Analytical Firm C | Uses limited shipment survey and uniform ASP across regions |
The comparison shows that Mordor Intelligence, by fixing a disciplined scope and cross-validated price ladders, delivers a balanced, transparent baseline that decision-makers can replicate and trust.


Key Questions Answered in the Report
What is the current market value for flow meters?
The flow meters market size is USD 8.93 billion in 2026 with a projected value of USD 11.33 billion by 2031.
Which technology segment is growing the fastest?
Mass-based Coriolis and thermal meters are advancing at a 7.4% CAGR due to hydrogen, carbon-capture and bioprocessing applications.
Why are utilities replacing mechanical meters?
Leakage-reduction mandates and infrastructure funding push utilities to adopt battery-powered smart meters that deliver hourly data and cut non-revenue water.
How is hydrogen adoption influencing flow-meter demand?
Regulations that allow 20% hydrogen blending in gas networks compel utilities to switch from turbine to ultrasonic or Coriolis meters that preserve accuracy.
Page last updated on:


