Flat Antenna Market Size and Share
Market Overview
| Study Period | 2020 - 2031 |
|---|---|
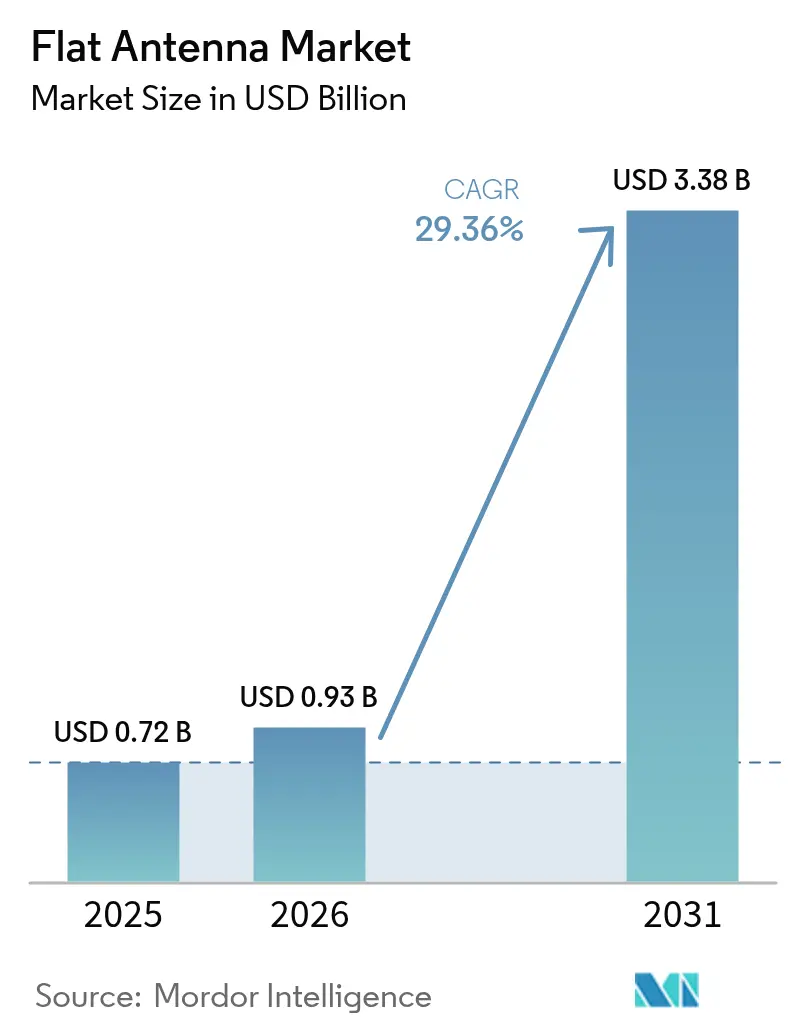
| Market Size (2026) | USD 0.93 Billion |
| Market Size (2031) | USD 3.38 Billion |
| Growth Rate (2026 - 2031) | 29.36% CAGR |
| Fastest Growing Market | Asia Pacific |
| Largest Market | North America |
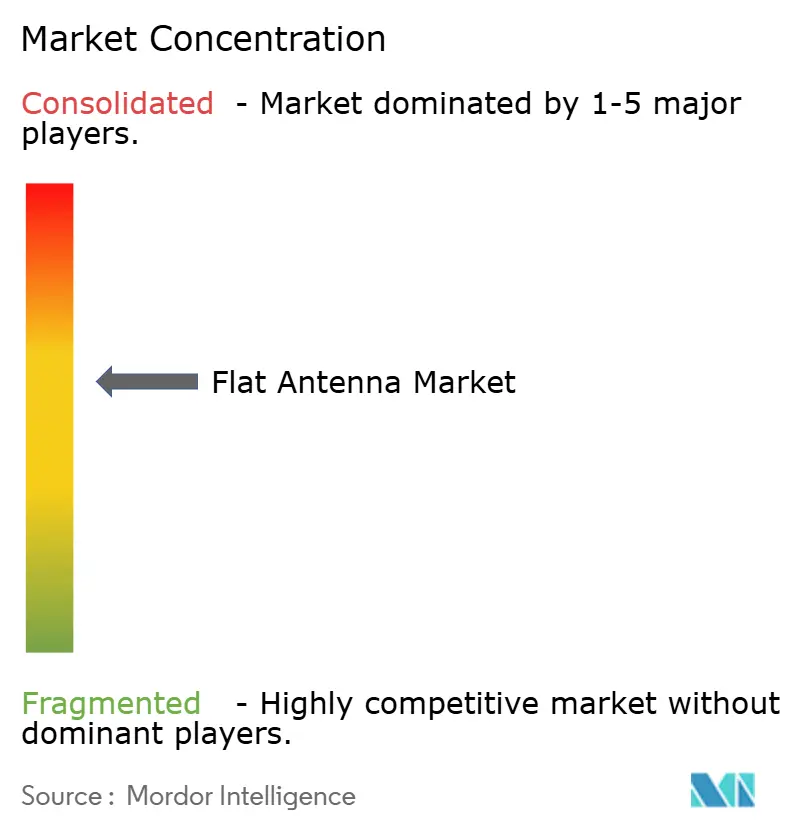
| Market Concentration | Medium |
Major Players *Disclaimer: Major Players sorted in no particular order Image © Mordor Intelligence. Reuse requires attribution under CC BY 4.0. | |
Flat Antenna Market Analysis by Mordor Intelligence
The Flat Antenna Market size was valued at USD 0.72 billion in 2025 and estimated to grow from USD 0.93 billion in 2026 to reach USD 3.38 billion by 2031, at a CAGR of 29.36% during the forecast period (2026-2031).
Intensifying low-earth-orbit (LEO) constellation roll-outs, mounting defense modernization budgets, and airline retrofit programs are steadily shifting preference from parabolic dishes to compact electronically steered panels.[1]Telesat, “Telesat Contracts Intellian to Build Lightspeed User Terminal,” telesat.com Demand is further reinforced by maritime broadband upgrades, remote area connectivity initiatives, and the emergence of eVTOL air-taxi services that require always-on, multi-orbit links. Regulatory clarity on non-geostationary service rules in the United States and Europe also compresses certification timelines and lowers adoption risk for enterprise users. Meanwhile, supply agreements between terminal makers and satellite network operators are locking in production volumes, accelerating economies of scale and reducing unit prices of flat‐panel arrays.[2]Hughes Network Systems, “HL1100W ESA Announcement,” echostar.com
Key Report Takeaways
- By application, Defense and Government led with 37.52% of flat antenna market share in 2025, whereas eVTOL/Urban Air Mobility is set to expand at a 33.44% CAGR to 2031.
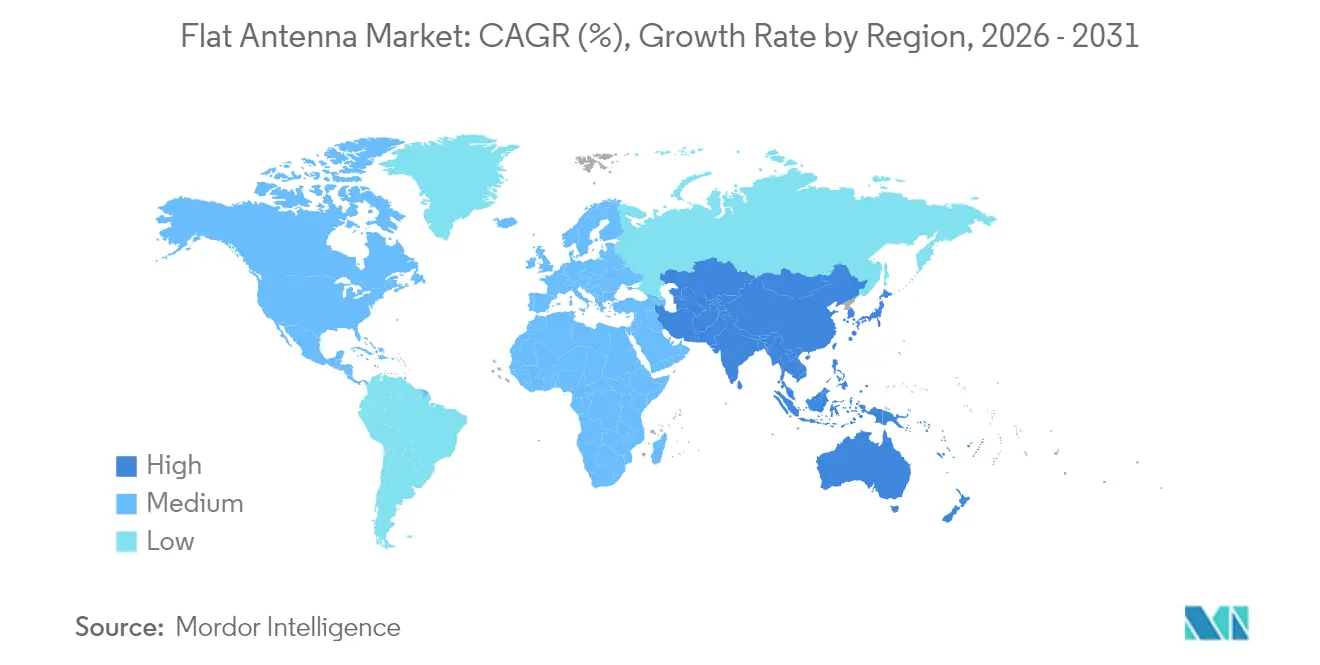
- By region, North America captured 40.55% revenue share in 2025; Asia Pacific is projected to grow at a 31.24% CAGR through 2031.
- By technology, electronically steered phased arrays held 54.30% of the flat antenna market share in 2025, while metamaterial/RIS-based designs are forecast to post a 36.85% CAGR to 2031.
- By frequency band, Ku/Ka systems commanded 45.62% share of the flat antenna market size in 2025; V/EHF solutions are pacing at a 30.58% CAGR to 2031.
- By platform, land-mobile installations accounted for a 33.41% share of the flat antenna market size in 2025, whereas portable/man-pack units are advancing at a 34.92% CAGR through 2031.
Note: Market size and forecast figures in this report are generated using Mordor Intelligence’s proprietary estimation framework, updated with the latest available data and insights as of 2026.
Global Flat Antenna Market Trends and Insights
Drivers Impact Analysis*
| Driver | ( ~ )% Impact on CAGR Forecast | Geographic Relevance | Impact Timeline |
|---|---|---|---|
| LEO-constellation rollout drives demand for compact user terminals | +8.5% | North America and Europe initially, global thereafter | Medium term (2-4 years) |
| Rising broadband connectivity needs for maritime and remote areas | +6.2% | Asia-Pacific sea lanes and Arctic passages | Long term (≥ 4 years) |
| Commercial aircraft retrofits for IFC upgrades | +4.8% | North America and Europe, expanding to Asia Pacific | Medium term (2-4 years) |
| Unmanned systems adoption in defense and ISR | +3.7% | Tri-regional defense markets | Short term (≤ 2 years) |
| eVTOL and autonomous-vehicle SatCom requirements | +2.9% | Urban centers in major economies | Long term (≥ 4 years) |
| Metamaterial manufacturing cuts cost and weight | +2.1% | Global manufacturing hubs | Medium term (2-4 years) |
| Source: Mordor Intelligence | |||
LEO-Constellation Rollout Drives Demand for Compact User Terminals
- Mega-constellation operators are commissioning hundreds of satellites, forcing ground terminals to support rapid handovers and wide look-angles. Intellian’s Ka-band panel for the Telesat Lightspeed network exemplifies the shift, enabling millisecond beam switching and obsoleting mechanically driven dishes. The flat antenna market benefits because electronically steered arrays shrink size, weight, and maintenance, thereby fitting enterprise rooftops, mobility platforms, and government vehicles. New supply contracts are already scaling annual production into tens of thousands of units, accelerating per-terminal cost declines. Low latency also opens premium use cases such as algorithmic trading and remote industrial control, which further increases addressable revenues. Hughes’ HL1100W single-panel ESA for the OneWeb network demonstrates how operators are racing to certify turnkey terminals for service launch in 2025.
Commercial Aircraft Retrofits for IFC Upgrades
Airlines are pursuing cabin connectivity as a competitive differentiator and are installing flush-mounted flat panels that cut drag and fuel burn compared with radome-topped dishes. Delta Air Lines’ selection of Hughes’ Fusion solution with ThinKom’s Ka2517 unit highlights carrier demand for multi-orbit flexibility across LEO and GEO links. Drag reduction studies show 75-90% lower aerodynamic penalty, translating to significant lifetime fuel savings that offset upfront hardware costs. Regulatory agencies have simplified supplemental type certification, compressing downtime for retrofit installations. Hawaiian Airlines’ Starlink rollout indicates how early adopters are influencing peer carriers to adopt similar architectures. Viasat’s Amara IFC platform adds a dual-beam ESA that dynamically allocates capacity based on route congestion, underscoring the importance of intelligent terminal software in tandem with hardware innovation.[3]Viasat, “Amara IFC Platform Launched,” viasat.com
Unmanned Systems Adoption in Defense and ISR
Modern defense doctrine favors distributed, unmanned assets that require beyond-line-of-sight satellite links. The U.S. Army’s metaferrite conformal antenna research promises ultra-thin panels that blend into airframes while retaining multi-band agility. General Atomics is embedding AESA apertures into its EagleEye radar to double range and cut maintenance, illustrating private-sector adoption of the same architecture. Resilient communications are essential for contested environments, so contracts such as L3Harris’ USD 89.4 million DEUCSI award demonstrate government intent to leverage commercial multipath space internet while retaining encrypted waveforms. Viasat’s Phased Array R&D contract underscores sustained funding for lighter, lower-profile terminals that resist jamming.
eVTOL and Autonomous-Vehicle SatCom Requirements
Electric vertical-takeoff aircraft operate across congested urban corridors where terrestrial links may fail. NASA’s UAM research notes satellite channels as vital backup for command-and-control, and minimalist flat panels satisfy strict weight budgets. Regulatory bodies crafting UAM standards are leaning toward mandatory redundancy, which will lock satellite transceivers into every certified air-taxi. Flat arrays also suit maritime drones and autonomous trucks that venture beyond cellular coverage, expanding total addressable demand. 5G–satellite network slicing is emerging, creating blended connectivity packages that further lift unit volumes. As prototype eVTOL fleets scale commercial service from 2026 onward, repeat purchases of standardized antennas will drive high-margin aftermarket revenue for suppliers.
Restraints Impact Analysis*
| Restraint | % Impact on CAGR Forecast | Geographic Relevance | Impact Timeline |
|---|---|---|---|
| High R&D and production cost of active phased-arrays | -4.2% | Global, particularly affecting emerging market adoption | Short term (≤ 2 years) |
| Thermal management & RF power-handling limits | -3.1% | Global, especially high-power applications | Medium term (2-4 years) |
| GaN/RF-IC supply-chain choke-points | -2.8% | Global, concentrated impact in Asia Pacific manufacturing | Short term (≤ 2 years) |
| Emerging orbital-debris rules restricting terminal density | -1.9% | Global, with stricter enforcement in developed markets | Long term (≥ 4 years) |
| Source: Mordor Intelligence | |||
High R&D and Production Cost of Active Phased Arrays
Developing a new flat-panel architecture routinely exceeds USD 50 million in non-recurring engineering spend, largely due to expensive gallium nitride power amplifiers that cost 3-5 times more than silicon chips. Specialized clean-room lines and near-field test chambers impose added capital. These economics favor incumbents and elongate payback for start-ups, decelerating new-entrant diversity in the flat antenna market. Component vendors are exploring 3D-printed passive layers and automated pick-and-place to trim labor, while system primes negotiate long-term take-or-pay wafer contracts. As metamaterial designs mature, they may undercut legacy phased arrays by collapsing element count and simplifying bias networks, but wide-band efficiency must first reach parity.
GaN/RF-IC Supply-Chain Choke-Points
China controls 98% of primary gallium extraction, and its 2024 export license regime introduced real risk to North American and European fab flows. Spot shortages have already stretched lead times past 40 weeks for some high-power monolithic microwave ICs, raising working-capital requirements for antenna OEMs. Intel’s accelerated foundry build-out and allied government subsidies aim to localize wide-bandgap transistor supply. In parallel, research groups are pushing silicon carbide and high-k dielectric substitutes for lower power nodes, reserving scarce GaN only for mission-critical amplifiers. Diversification will take several years, holding near-term production risk and restraining the flat antenna market CAGR.
*Our forecasts treat driver/restraint impacts as directional, not additive. The impact forecasts reflect baseline growth, mix effects, and variable interactions.
Segment Analysis
By Application: Defense Drives Current Demand While eVTOL Shapes Future Growth
Defense and Government represented 37.52% of the flat antenna market share in 2025 due to multiband tactical terminals and unmanned vehicle roll-outs that command premium pricing. Commercial airlines rank second on the back of rising in-flight connectivity retrofits. Ship operators continue adopting hybrid GEO-LEO packages to improve crew welfare and cargo tracking. In value terms, the application segment contributed the largest portion of the flat antenna market size, and is expected to retain primacy until 2027 as NATO members refresh satcom inventories.
The eVTOL/Urban Air Mobility category is projected to register a 33.44% CAGR, the highest within applications, as regulatory corridors open after 2026. City-pair operators will require small, lightweight, multi-orbit panels that integrate with avionics without compromising battery payload. Concurrently, consumer broadband terminals will leverage falling hardware prices to penetrate underserved rural territories. Emergency-response agencies are also adding man-portable kits to restore connectivity during disasters, widening the customer base for the flat antenna market.


By Frequency Band: Ku/Ka Dominance Faces V/EHF Innovation
Ku/Ka solutions held 45.62% share of the flat antenna market size in 2025 because of robust satellite capacity and long-standing regulatory allocations. Rain-fade resilience at Ku-band suits maritime use, while Ka-band’s higher throughput supports video, cloud, and VPN backhaul. X-band remains a defense preserve for secure links and radar fusion.
The V-/EHF-band slice is set to grow at a 30.58% CAGR as militaries move toward low-probability-of-intercept waveforms and commercial constellations target sub-TeraHertz capacity. Hardware challenges such as tighter phase tolerance and higher path loss are spurring innovations in thermal substrates and meta-lens gain structures. Multi-band antennas that switch between K, Ku, and Ka within a single aperture are gaining traction, promising fleet operators flexibility without hardware swap-outs.
By Platform: Land-Mobile Leadership Challenged by Portable Innovation
Land-mobile vehicles, including trucks, emergency response vans, and defense armored carriers, accounted for 33.41% of the flat antenna market share in 2025, retaining leadership through proven reliability and well-defined installation standards. Ground fixed stations, though stationary, continue serving enterprises requiring high uptime, especially in the energy sector.
Portable/man-pack kits are forecast to expand at a 34.92% CAGR, spurred by soldier modernization and disaster-relief agencies that prize rapid deployment and battery efficiency. Advances in low-power beamforming ASICs and carbon-fiber chassis reduce carry weight below 4 kg, opening dual-use markets for journalists and remote mining crews. Airborne and maritime platforms strengthen baseline growth as hybrid GEO-LEO subscriptions improve coverage continuity.

By Antenna Technology: ESA Dominance Faces Metamaterial Disruption
Electronically steered phased arrays controlled 54.30% of flat antenna market share in 2025, underpinned by proven reliability on almost 1,550 commercial aircraft and millions of maritime streaming hours. Solid-state switching delivers millisecond beam agility needed for LEO satellites while removing moving parts that historically drove maintenance spend. Hybrid electromechanical approaches persist for cost-sensitive land terminals, blending coarse mechanical azimuth with fine electronic elevation control to keep the bill of materials low.
Metamaterial and reconfigurable intelligent surface (RIS) architectures are on course for a 36.85% CAGR to 2031, potentially slashing element counts by embedding phase gradients in passive surfaces. Early prototypes fabricated by additive manufacturing have halved weight relative to classic ESAs, encouraging aerospace primes to fund pilot lines. Should large-scale printing reach six-sigma yield, metamaterials could reset flat antenna market cost curves and hasten mass adoption in consumer electronics.
Geography Analysis
North America captured 40.55% of flat antenna market share in 2025 following early LEO constellation deployments by SpaceX and OneWeb, a high concentration of defense projects, and aggressive airline connectivity upgrades. The U.S. Federal Communications Commission has issued streamlined non-geostationary licensing rules, lowering administrative barriers for terminal certification while extending spectrum sharing rights that protect incumbent services. Canada’s export-control liberalization is also enabling cross-border supply-chain integration, accelerating joint development programs.
Asia Pacific is projected to generate the fastest regional CAGR of 31.24% to 2031 as governments in Japan, South Korea, and Australia allocate budget for sovereign space assets and satellite broadband programs. Chinese vendors have achieved export-class safety certifications on Ku-band panels, opening Southeast-Asian maritime markets. Seoul’s Electronics and Telecommunications Research Institute is trialing low-profile Ku antennas for high-speed rail, signaling diversification beyond defense. Rapidly expanding e-commerce and telemedicine in remote islands create incremental demand for enterprise VSAT, reinforcing the growth trajectory of the flat antenna market.
Europe remains a stable growth arena where ESA technology permeates commercial aviation, cruise shipping, and governmental networks. SES’s planned USD 3.1 billion takeover of Intelsat will consolidate multi-orbit capacity, pairing the merged fleet with in-house terminal roadmaps to protect margins. National defense agencies, led by the Netherlands and France, are channeling procurement toward low observable flat arrays that integrate with next-generation combat aircraft. Middle East and Africa show nascent but accelerating orders, especially from offshore energy rigs and humanitarian agencies that require resilient links during crises.

Competitive Landscape
The supplier base comprises a mix of vertically integrated satellite operators, established aerospace primes, and venture-backed specialists. Market power is notably concentrated in firms able to deliver antenna hardware bundled with capacity and service-level agreements, creating sticky customer lock-ins. ThinKom’s VICTS architecture has accumulated more than 17 million flight hours, earning de-risking credentials that airlines value. Viasat, meanwhile, leverages the installed base of Inmarsat to cross-sell its newly launched Aera ESA through a multi-orbit service wrapper, a tactic that widens switching costs for end users.
Acquisition strategy underpins the race for RF talent and patent portfolios. Honeywell’s USD 1.9 billion purchase of CAES injects heritage microwave engineering into its defense division, providing a springboard for next-gen AESA airborne radomes. L3Harris continues to pick up small fabless designers to shore up DEUCSI program deliverables, aiming for interoperability between commercial LEO providers and classified networks. On the innovation flank, Hanwha Phasor and Kymeta pursue metamaterial and liquid-crystal polymer substrates to outflank cost curves, attracting airline trials that could unlock high-volume production if performance holds.
For now, supply-chain constraints around GaN wafers and test equipment temper aggressive expansion plans, nudging vendors toward collaborative sourcing consortia. The Federal Communications Commission’s 2024 technical filing rules that mandate detailed beam contours and debris mitigation add compliance overhead, which entrenches seasoned incumbents. Nonetheless, the impending commercialization of eVTOL platforms presents a white-space opening where nimble entrants can win design-ins before certification hardens around legacy players, preserving healthy competitive tension within the flat antenna market.
Flat Antenna Industry Leaders
Cobham plc
Kymeta Corporation
Airbus SE
Honeywell International Inc.
L3Harris Technologies
- *Disclaimer: Major Players sorted in no particular order

Recent Industry Developments
- April 2025: Viasat unveiled its Amara IFC solution with dual-beam Aera ESA to support GEO, HEO, and LEO links
- April 2025: Hughes Network Systems introduced the HL1100W ESA for OneWeb’s LEO service, opening enterprise orders
- March 2025: Delta Air Lines selected Hughes’ Fusion solution featuring ThinKom’s Ka2517 antenna for A350 and A321neo aircraft
- February 2025: Telesat contracted Intellian to produce Ka-band flat-panel user terminals for the Lightspeed LEO network
- September 2024: Viasat secured a USD 33.6 million U.S. Air Force contract to develop AESA terminals for tactical aircraft


Research Methodology Framework and Report Scope
Market Definitions and Key Coverage
Our study defines the flat antenna market as all low-profile, planar antennas that electronically or mechanically direct beams for satellite or terrestrial links across Ku, Ka, multi-band, X, and V/EHF frequencies, whether fixed, vehicular, airborne, maritime, or portable. These units are factory-built, wafer-thin, and integrate feed network, phase shifters, and RF front-end in one sealed panel.
Scope exclusion: parabolic dishes, conventional patch arrays thicker than five centimeters, and stand-alone beamforming ICs are not counted within the revenue pool.
Segmentation Overview
- By Application
- Aerospace
- Defense and Government
- Commercial Aviation
- Maritime
- Land Mobile / 5G Backhaul
- Consumer Broadband and Others
- By Frequency Band
- Ku-Band
- Ka-Band
- K/u//Ka Multi-band
- X-Band
- V-/EHF-Band
- By Platform
- Ground Fixed Stations
- Land-Mobile (Vehicular)
- Airborne
- Maritime and Offshore
- Portable / Man-pack
- By Antenna Technology
- Electronically-Steered Phased Array (ESA)
- Hybrid Electronically/Mechanically Steered
- Mechanically Steered Flat Panel
- Metamaterial / RIS-based
- By Geography
- North America
- United States
- Canada
- Mexico
- South America
- Brazil
- Argentina
- Rest of South America
- Europe
- United Kingdom
- Germany
- France
- Rest of Europe
- Asia Pacific
- China
- Japan
- India
- South Korea
- Rest of Asia Pacific
- Middle East and Africa
- United Arab Emirates
- Saudi Arabia
- South Africa
- Rest of Middle East and Africa
- North America
Detailed Research Methodology and Data Validation
Primary Research
In parallel, we interviewed antenna OEM engineers, satellite operators in North America, Europe, and Asia, inflight-connectivity integrators, maritime VSAT installers, and defense program officers. Their insights clarified price erosion curves, lead times, electronics yields, and regional retrofit intentions that public documents rarely quantify.
Desk Research
Initial fact-finding drew on open sources such as ITU filings, FCC earth-station licenses, Euroconsult launch logs, UN Comtrade shipment codes for HS 852910, and trade association yearbooks from GSOA or the IMTMA. Company 10-Ks, investor decks, and aerospace procurement notices complemented these public data.
Mordor analysts accessed paid libraries like D&B Hoovers for supplier financials and Dow Jones Factiva for deal tracking, which helped cross-check shipment volumes and average selling prices. The examples above are illustrative; numerous other repositories were reviewed to frame market boundaries and historical growth.
Market-Sizing & Forecasting
We blended a top-down reconstruction of demand pools, linking active GEO and LEO terminal counts, aircraft and vessel install bases, and remote 5G backhaul sites, with selective bottom-up roll-ups of leading panel shipments and sampled ASP × volume checks. Variables such as constellation launch cadence, antenna efficiency gains, Ku-to-Ka migration, defense modernization outlays, and aero-IFC penetration rates fed the model. A multivariate regression, validated through scenario analysis, projected 2025-2030 growth; gaps in supplier granularity were bridged by regional adoption coefficients derived from primary interviews.
Data Validation & Update Cycle
Outputs run through variance flags that compare totals with customs values, install-base trackers, and quarterly earnings. Senior reviewers challenge anomalies before release. Reports refresh each year, with mid-cycle revisions triggered by material events like constellation delays or export restrictions, ensuring clients always receive the latest calibrated view.
Why Mordor's Flat Antenna Market Baseline Deserves Greater Confidence
Published market values often diverge because firms pick different hardware mixes, service attachments, and refresh rhythms.
Key gap drivers include whether passive panels and broader satellite antenna families are merged, the aggressiveness of uptake scenarios for LEO user terminals, currency conversion dates, and the cadence at which ASP deflation is re-benchmarked.
Benchmark comparison
| Market Size | Anonymized source | Primary gap driver |
|---|---|---|
| USD 0.72 B (2025) | Mordor Intelligence | |
| USD 13.7 B (2025) | Global Consultancy A | Combines all satellite antennas and gateway arrays, inflating base; limited primary validation of ASP trajectory |
| USD 2.21 B (2024) | Industry Journal B | Uses shipment units only for aviation and telecom, omits defense retrofits, then applies uniform pricing |
| USD 0.56 B (2024) | Advisory Firm C | Excludes land-mobile and portable panels, relies on two regional customs series without cross-checks |
The comparison underscores that Mordor's disciplined scope selection, mixed-method model, and annual refresh deliver a balanced, transparent baseline that decision-makers can trace to clear assumptions and replicate with confidence.


Key Questions Answered in the Report
What is the current size of the Flat Antenna Market?
The Flat Antenna Market size stood at USD 0.93 billion in 2026 and is forecast to hit USD 3.38 billion by 2031.
Which application dominates flat-panel demand today?
Defense and Government holds the largest share at 37.52% owing to robust funding for multi-band, unmanned, and tactical communication programs.
Which region will grow the fastest through 2031?
Asia Pacific is projected to clock a 31.24% CAGR due to expanding satellite infrastructure and government-backed broadband initiatives.
Why are airlines adopting flat antennas for IFC?
Electronically steered arrays reduce aerodynamic drag by up to 90%, cut fuel burn, and enable multi-orbit switching for consistent passenger connectivity.
How will metamaterial antennas impact the market?
Metamaterial designs could lower weight and production cost, driving a 36.85% CAGR for the segment and potentially broadening consumer device adoption.
What supply-chain risks could slow growth?
Dependence on gallium nitride wafers and thermal management challenges may constrain production capacity in the short term, tempering the overall CAGR.
Page last updated on:


