Distributed Antenna Systems Market Size and Share
Market Overview
| Study Period | 2020 - 2031 |
|---|---|
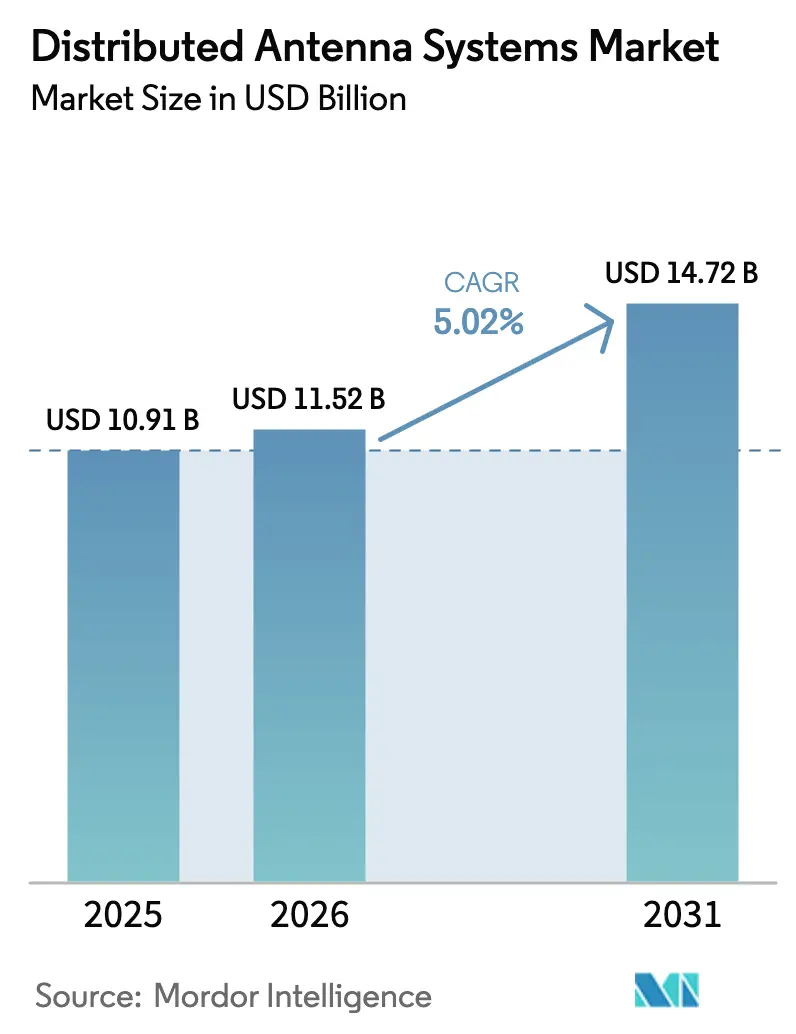
| Market Size (2026) | USD 11.52 Billion |
| Market Size (2031) | USD 14.72 Billion |
| Growth Rate (2026 - 2031) | 5.02% CAGR |
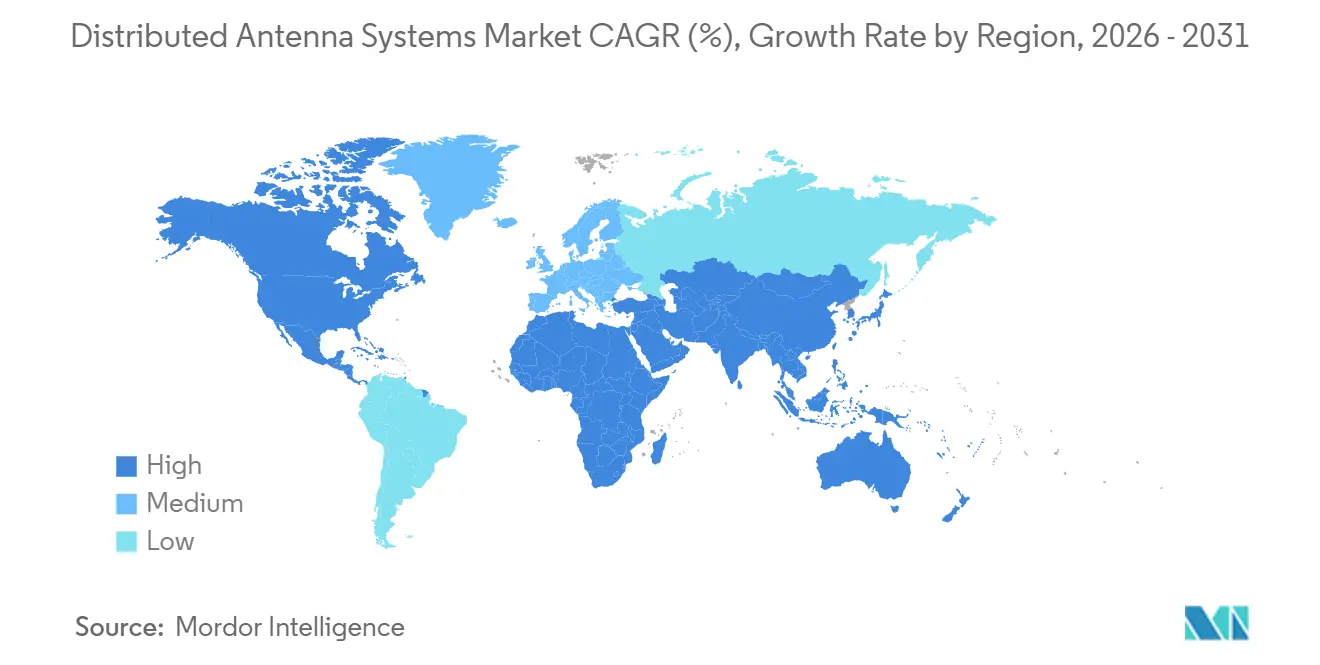
| Fastest Growing Market | Asia Pacific |
| Largest Market | North America |
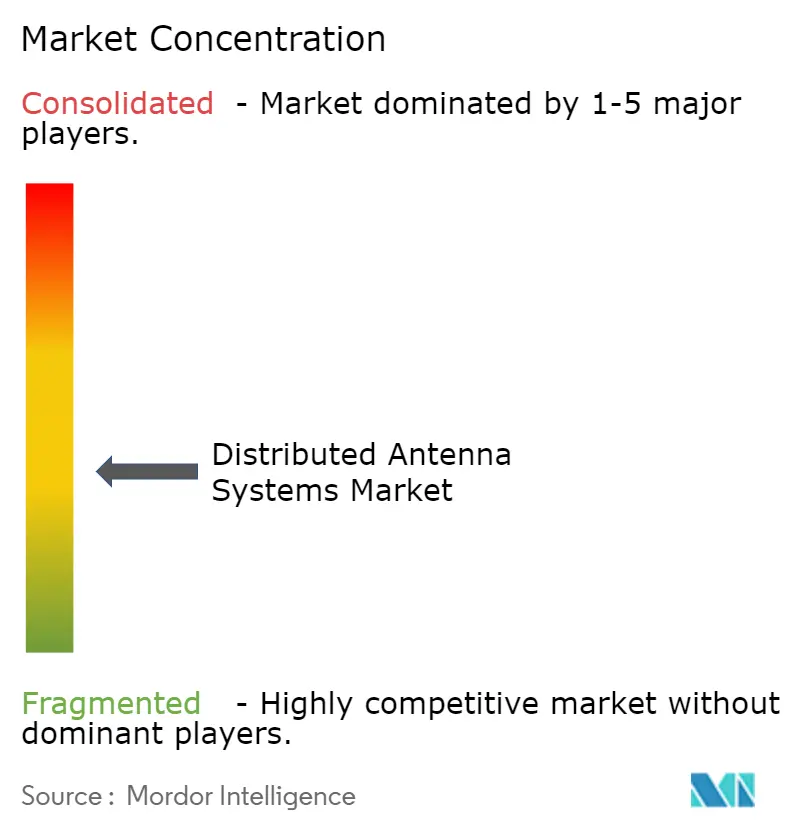
| Market Concentration | Medium |
Major Players *Disclaimer: Major Players sorted in no particular order Image © Mordor Intelligence. Reuse requires attribution under CC BY 4.0. | |
Distributed Antenna Systems Market Analysis by Mordor Intelligence
The Distributed Antenna Systems Market size is projected to expand from USD 10.91 billion in 2025 and USD 11.52 billion in 2026 to USD 14.72 billion by 2031, registering a CAGR of 5.02% between 2026 to 2031. This expansion rests on a triad of forces: public-safety coverage mandates, the cost advantages of neutral-host ownership, and 5G propagation challenges in dense buildings. Healthcare digitalization, smart-venue monetization, and energy-efficient hybrid architectures are accelerating replacement of legacy active units, while small-cell competition is restraining hardware revenues. Commercial real-estate owners have started to view DAS as an income-generating asset rather than a compliance burden, and operators are reallocating capital toward spectrum purchases and cloud cores, further favoring shared infrastructure.
Key Report Takeaways
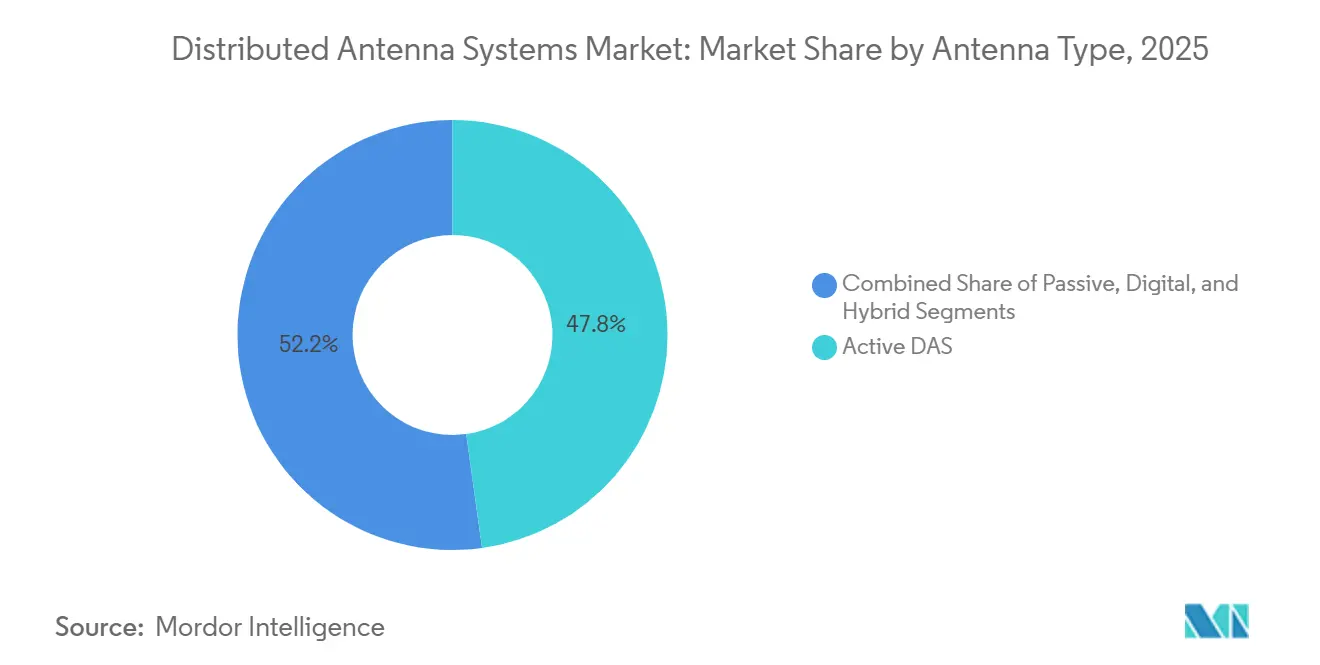
- By antenna type, active DAS held 47.80% revenue share in 2025, whereas hybrid architectures are advancing at a 6.10% CAGR through 2031
- By end-user, telecommunications operators led with 28.60% of the distributed antenna systems market share in 2025; healthcare facilities are projected to expand at 7.80% CAGR to 2031
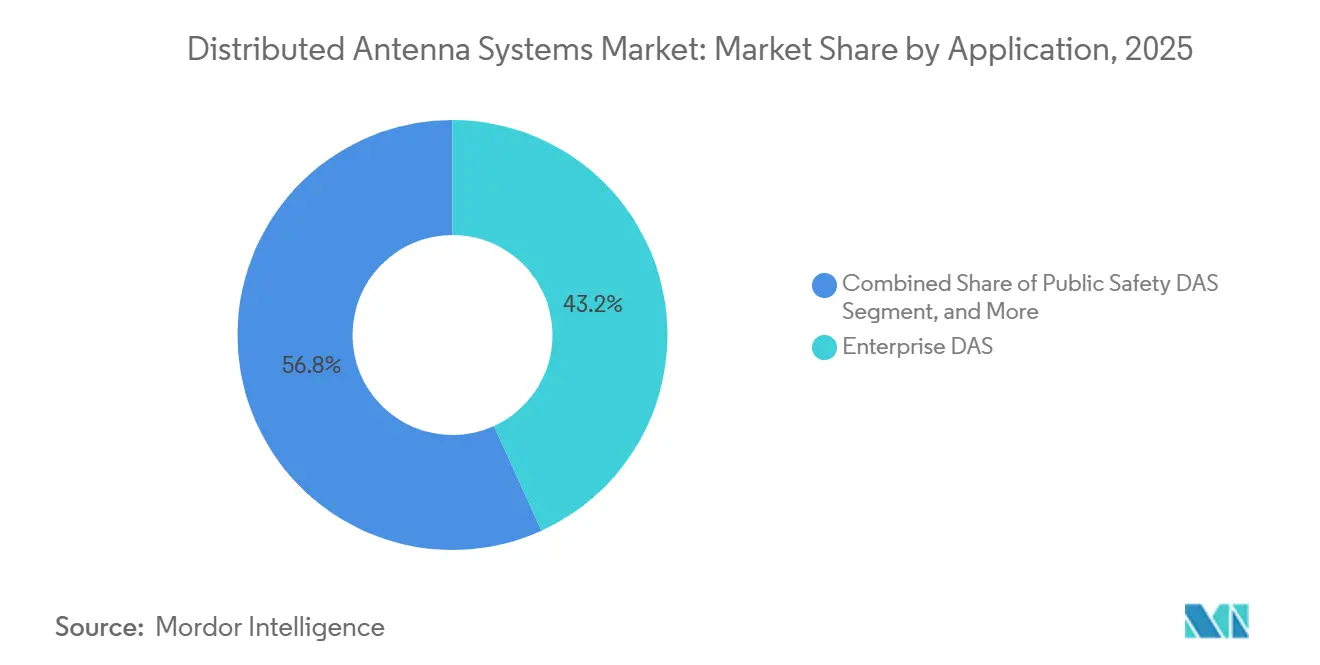
- By application, enterprise systems accounted for a 43.20% slice of the distributed antenna systems market size in 2025, while neutral-host configurations are advancing at a 6.30% CAGR through 2031
- By ownership model, carrier-owned assets retained 51.40% share in 2025; neutral-host deployments are expected to rise at 5.80% CAGR to 2031
- By region, North America commanded 38.50% of 2025 revenue, yet Asia-Pacific is projected to grow at 7.43% CAGR through 2031
Note: Market size and forecast figures in this report are generated using Mordor Intelligence’s proprietary estimation framework, updated with the latest available data and insights as of January 2026.
Market Trends and Insights
Drivers Impact Analysis of Distributed Antenna Systems Market*
| Driver | (~) % Impact on CAGR Forecast | Geographic Relevance | Impact Timeline |
|---|---|---|---|
| 5G Network Densification Boosting Indoor-Coverage Demand | +1.2% | North America, China, Japan, South Korea | Medium term (2-4 years) |
| Regulatory Mandates for In-Building Public-Safety Coverage | +0.9% | North America, Europe, Singapore | Short term (≤ 2 years) |
| Neutral-Host Business Models Lowering Property-Owner CAPEX | +0.8% | North America, Western Europe, GCC states | Medium term (2-4 years) |
| AI-Driven DAS Self-Optimization Lowers Network OPEX | +0.6% | North America, Asia-Pacific technology hubs | Long term (≥ 4 years) |
| Rising Mobile Data Traffic in Large Venues | +0.7% | Urban event hubs worldwide | Short term (≤ 2 years) |
| Proliferation of IoT and Smart-Building Applications | +0.5% | Asia-Pacific smart cities, North American commercial real estate | Long term (≥ 4 years) |
| Source: Mordor Intelligence | |||
5G Network Densification Boosting Indoor-Coverage Demand
Millimeter-wave signals suffer high attenuation through walls, so operators are compelled to supplement outdoor macro roll-outs with indoor platforms, especially in China’s 3.64 million 5G base-station footprint and Singapore’s 50% standalone 5G mandate for 2025. Neutral-host DAS at Empower Field in Denver moved 50 terabytes over two concerts, several times a typical NFL game, illustrating how large venues require venue-specific infrastructure. The switch to C-Band balances penetration and capacity, yet still demands indoor nodes in premium properties. Because 80% of mobile traffic originates indoors, distributed antenna systems market carriers see rapid payback when high-density users congregate in stadiums, hospitals, and transport hubs.
Regulatory Mandates for In-Building Public-Safety Coverage
FCC Docket 21-346 requires 99% indoor LTE coverage for commercial buildings by 2025, driving compulsory DAS adoption.[1]FCC, “FCC Docket 21-346 Indoor Coverage Requirements,” FCC.GOV FirstNet’s USD 1.7 billion rural grant program placed systems in 30,000 buildings, giving owners an incentive to meet Enhanced 911 accuracy rules.[2]FirstNet Authority, “Rural Grants and Building Footprint,” FIRSTNET.GOV European transport-corridor coverage directives and Singapore’s fire-code updates create similar pressure. Large medical campuses such as Cleveland Clinic integrated FirstNet and commercial 5G in a single network, assuring both public-safety and clinical uptime. Compliance has reduced DAS deployment cycles from discretionary to mandated timelines, shortening decision windows for property developers.
Neutral-Host Business Models Lowering Property-Owner CAPEX
A single infrastructure owner serving several carriers can cut venue capital outlay by 60-80% and converts a sunk cost into lease revenue of USD 1,500-5,000 per operator per month. The Hosted Open RAN framework now standardizes interfaces, letting airports such as Hartsfield-Jackson shrink equipment rooms by 40% while accommodating T-Mobile and AT&T on the same fiber backbone. Although coordination delays persist, revenue-sharing deals typically allocate 20-40% of carrier fees to landlords, creating an annuity that improves net operating income.
AI-Driven DAS Self-Optimization Lowers Network OPEX
Machine-learning controllers embedded in new radio units tune power, beam-forming, and spectrum on live traffic, trimming energy by up to 40% during off-peak periods. JMA’s XRAN 5.0 detects and suppresses multi-operator inter-modulation, halving truck-roll visits. Huawei’s LampSite X in Dubai hit 5.1 Gbps peaks while dynamically steering beams to moving users. These savings mitigate rising electricity costs and comply with EU energy-efficiency mandates, but carriers must share granular data with neutral hosts, raising cybersecurity and privacy concerns.
Restraints Impact Analysis of Distributed Antenna Systems Market*
| Restraint | (~) % Impact on CAGR Forecast | Geographic Relevance | Impact Timeline |
|---|---|---|---|
| Multi-Operator Coordination and Spectrum-Clearance Complexity | -0.7% | North America and Europe with multiple incumbent carriers | Short term (≤ 2 years) |
| Sustainability Pressure on Energy-Intensive Systems | -0.4% | Europe and North America under green-building frameworks | Medium term (2-4 years) |
| High Installation and Deployment Costs for Large Venues | -0.6% | Emerging markets and mid-tier facilities globally | Short term (≤ 2 years) |
| Complex Regulatory Approvals and Building-Zoning Permits | -0.5% | Airports, hospitals, and historic urban districts worldwide | Short term (≤ 2 years) |
| Source: Mordor Intelligence | |||
Multi-Operator Coordination and Spectrum-Clearance Complexity
Serving three or more carriers inside one venue forces detailed negotiation of frequencies and power masks, extending projects by 6-18 months. At the Superdome, aligning 91 zones for AT&T, Verizon, and T-Mobile took 14 months before commercial service began. Passive inter-modulation can degrade signal by 10-15 dB if filtering is inadequate, so integrators spend extra on testing. Many emerging-market regulators still license spectrum per operator rather than venue, limiting the neutrality benefits in the distributed antenna systems market.
High Installation and Deployment Costs for Large Venues
Advanced 5G-ready systems cost USD 4-8 per square foot, or up to USD 10 million for stadium-scale sites, excluding 15-25% annual OPEX. Small cells cut capex to USD 1.5-3 per square foot but lack multi-operator support. Fiber-to-antenna designs such as Corning’s Everon saved 33% capex at Colorado’s Anschutz campus, yet retrofits remain expensive in legacy buildings. Payback periods of 3-7 years, in the distributed antenna systems market, discourage mid-tier venues unless a neutral host financier assumes the risk.
*Our forecasts treat driver/restraint impacts as directional, not additive. The impact forecasts reflect baseline growth, mix effects, and variable interactions.
Distributed Antenna Systems Market Segment Analysis
By Antenna Type:
Hybrid Architectures Balance Cost and PerformanceHybrid platforms are carving space between high-powered active units and coaxial passive layouts in the distributed antenna systems market. Hybrid DAS recorded a 6.10% CAGR and is expected to keep eating into active systems that still represent the largest slice of the distributed antenna systems market size. Active units, while capable of multi-band power output, consume 5-15 kW per site and occupy 65% more rack space than passive variants, forcing venue owners to upgrade cooling and power circuits. Passive solutions remain viable in buildings under 100,000 square-feet but lose 3-6 dB every 100 feet of coax. Digital fiber variants convert RF to light, cutting energy 60-70% and easing software upgrades, as evidenced by LampSite roll-outs across 20 countries.
Hybrid systems integrate fiber backhaul with localized amplification, which brings a compromise between capital and power budgets. Verizon’s Open RAN deployment in Austin links Samsung software units with CommScope antennas to avoid vendor lock-in. Operators favor hybrids because energy now represents 20-30% of OPEX, and software control lets them turn off sectors overnight. Suppliers offering modular radio heads and remote software keys gain pricing power as venues stagger investments over several budget cycles.


By End-User:
Healthcare Networks Accelerate Digital AdoptionTelecommunications operators still dominated demand with 28.60% revenue in 2025, but hospitals are the fastest risers, expanding at a 7.80% CAGR as electronic health-record access, imaging transfer, and real-time monitoring require zero service interruptions in the distributed antenna systems market.[3]HealthITAnalytics, “Telemedicine Adoption 2023,” HEALTHITANALYTICS.COM Mayo Clinic in Rochester runs more than 70,000 medical devices on a Corning DAS, showing the operational stakes. Manufacturing floors are leaning toward CBRS small cells for robotics due to lower USD 0.97-1.12 per-square-foot cost, curbing DAS penetration.
Government and public-safety agencies rely on Band 14 integration, a use case that keeps distributed antenna systems market share sticky despite small-cell competition. Sports venues such as Empower Field exploit DAS capacity to enable mobile ordering and augmented-reality replays, driving ancillary revenue. Transportation hubs adopt neutral-host networks to avoid multiple rebuilds, as seen at Hartsfield-Jackson Airport.
By Application:
Neutral-Host Configurations Reshape EconomicsEnterprise deployments accounted for 43.20% share of application revenue of the distributed antenna systems market in 2025, but neutral-host systems are growing at a 6.30% CAGR as landlords pursue recurring income. AT&T’s multi-operator Superdome project generated 69 terabytes over three concerts and shows how lease fees turn infrastructure into cash flows. Public-safety overlays remain mandatory yet complex, because Band 14 priority and preemption need separate core slices.
Converged architectures combining DAS, CBRS, and Wi-Fi are emerging after the Small Cell Forum’s 2024 specification, giving owners a single pane-of-glass for all radio services. Revenue-share models, however, defer income until all operators sign on, slowing adoption in smaller properties.
By Ownership Model:
Neutral-Host Momentum BuildsCarrier-owned assets still hold 51.40% of value in the distributed antenna systems market, but neutral-host investments are expected to climb at a 5.80% CAGR as operators channel capital to spectrum auctions and virtual cores. DigitalBridge’s USD 854 million acquisition of Boingo signaled investor appetite for steady lease streams. Crown Castle now manages 115,000 small-cell nodes plus DAS, bundling offerings to stadium owners.
Enterprise-owned systems are losing ground because neutral hosts can cut capex by 60-80% and still guarantee multi-carrier coverage. Saudi Arabia’s trial of shared 4.0-4.1 GHz indoor spectrum showed that regulator-assigned neutral blocks reduce coordination headaches and could accelerate adoption in new smart-city builds.
Geography Analysis
North America Distributed Antenna Systems Market
North America held 38.50% of 2025 revenue in the distributed antenna systems market, propelled by the FCC’s 99% indoor mandate and FirstNet’s 30,000-building footprint. High-traffic venues such as Empower Field moved 50 terabytes in two days, justifying USD 4-8 per-square-foot investments. The region favors premium neutral-host pricing yet faces 3-7 year paybacks in mid-tier properties, so operators focus on stadiums, airports, and healthcare.
APAC Distributed Antenna Systems Market
Asia-Pacific is the near-term growth engine at 7.43% CAGR, underpinned by China’s 3.64 million 5G sites, India’s 700,000-site target, and Singapore’s nationwide indoor targets. Large metro projects in Hong Kong and Shenzhen installed full-line coverage within ten weeks, illustrating execution speed. Japan’s dense yet aging buildings complicate retrofits, pushing suppliers toward slimline antennas. South Korea and Australia, past the coverage milestone, now emphasize venue upgrades.
EMEA and LATAM Distributed Antenna Systems Market
Europe’s energy-efficiency rules spur digital solutions that cut consumption 60-70%. Fragmented building codes, however, add 3-12 months to permitting, slowing multi-country roll-outs. The United Kingdom’s Project Gigabit and transport-corridor obligations keep public-funded programs active, yet historic edifices require specialized fire-proof cabling. The Middle East and Africa is expected to grow rapidly through 2031 on the back of smart-city programs in Riyadh, Dubai, and Doha. du’s first 5G-Advanced indoor network hit 5.1 Gbps, signaling appetite for cutting-edge performance. Spectrum-sharing pilots in Saudi Arabia point to regulatory openness that could sidestep coordination delays common elsewhere. Latin America and Sub-Saharan Africa remain nascent, with DAS limited to premium malls and airports, but urbanization and smartphone-penetration trends suggest a latent pipeline once financing hurdles ease.

Competitive Landscape
Competition spans equipment vendors, neutral-host operators, integrators, and carriers, none exceeding a double-digit global revenue share. Vendors differentiate on power efficiency and software interoperability, as shown by Verizon’s Open-RAN multi-vendor DAS that bound Samsung software to CommScope antennas. Corning, JMA Wireless, and SOLiD are pushing digital and hybrid portfolios promising 30-50% power savings, in line with EU energy rules.
Neutral-host operators such as Boingo, American Tower, and Crown Castle pursue scale to amortize capex across many venues. DigitalBridge’s Boingo purchase consolidated 70-plus sports venues and airport deals, while Crown Castle’s mix of 115,000 small-cell nodes with DAS gives venue owners a one-stop solution. American Tower teamed with AT&T to broaden indoor reach, signaling convergence between tower firms and neutral-host models.
Software-defined innovations create openings for challengers. JMA’s USD 100 million raise funds AI-driven interference mitigation, and Ericsson’s neutral-spectrum pilots in Saudi Arabia explore new licensing models. Small-cell makers threaten the distributed antenna systems industry by offering cheaper alternatives, causing DAS hardware revenue to decline at -2.5% CAGR, but hybrid solutions are reclaiming share where multi-operator support and uniform coverage trump lowest capex. Overall, pricing power lies with suppliers who can bundle software, power savings, and lease financing, tilting the distributed antenna systems market toward a service-oriented model rather than pure hardware sales.
Distributed Antenna Systems Industry Leaders
CommScope Holding Company Inc.
Corning Incorporated
AT&T Inc.
American Tower Corporation
Cobham Limited
- *Disclaimer: Major Players sorted in no particular order
Distributed Antenna Systems Market Companies Covered in this Report
- CommScope Holding Company Inc.
- Corning Incorporated
- AT&T Inc.
- American Tower Corporation
- Cobham Limited
- SOLiD Inc.
- TE Connectivity Ltd.
- Comba Telecom Systems Holdings Ltd.
- Boingo Wireless Inc.
- JMA Wireless
- Dali Wireless Inc.
- Zinwave (Wilson Electronics)
- Nokia Corporation
- Ericsson AB
- Huawei Technologies Co. Ltd.
- Radio Frequency Systems
- Advanced RF Technologies Inc.
- PBE Axell Wireless
- Maven Wireless Sweden AB
- Baicells Technologies Co. Ltd.
- Tower Bersama Group
- Anixter International Inc.
- Amphenol Corporation
- Antenna Products Corporation

Recent Industry Developments in Distributed Antenna Systems Market
- January 2026: Hartsfield-Jackson Atlanta International Airport completed a neutral-host 5 G platform that reduced infrastructure footprint by 40% and prepared the hub for projected passenger growth through 2035.
- February 2025: AT&T activated a 91-zone multi-operator DAS at the Superdome, generating 69 terabytes during three concerts and showcasing neutral-host revenue potential.
- November 2024: Verizon launched the first Open-RAN compliant multi-vendor DAS at the University of Texas Moody Center, enabling software-based capacity scaling.
- October 2025: Huawei reported digital-antenna deployments in 20 countries for more than 40 operators, cutting power consumption 60-70%.


Distributed Antenna Systems Market Report Scope and Research Methodology
Market Definition and Coverage
Our study defines the distributed antenna system market as all active, passive, digital, hybrid, and supporting control components that reroute licensed or unlicensed RF signals through a fiber-or-coax fed network of spatially separated antennas to improve cellular and public-safety coverage in buildings, transport hubs, campuses, and other high-density zones. The 2025 global market value is estimated at USD 10.90 billion.
Scope exclusion: radio access network small cells installed as stand-alone capacity nodes are excluded.
Segments Covered in This Report
- By Antenna Type
- Active
- Passive
- Digital
- Hybrid
- By End-User
- Manufacturing
- Healthcare
- Government and Public Safety
- Transportation and Logistics
- Sports and Entertainment Venues
- Telecommunications Operators
- Other Commercial Sectors
- By Application
- Enterprise DAS
- Public Safety DAS
- Neutral-Host / Multi-Operator DAS
- By Ownership Model
- Carrier-Owned
- Neutral-Host
- Enterprise-Owned
- By Geography
- North America
- United States
- Canada
- Mexico
- Europe
- United Kingdom
- Germany
- Netherlands
- France
- Ireland
- Rest of Europe
- Asia-Pacific
- China
- India
- Singapore
- Japan
- Australia
- Indonesia
- Rest of Asia-Pacific
- South America
- Brazil
- Chile
- Rest of South America
- Middle East
- United Arab Emirates
- Saudi Arabia
- Turkey
- Rest of Middle East
- Africa
- South Africa
- Nigeria
- Rest of Africa
- North America
Data Sources, Market Sizing, and Validation
Primary Research
Mordor analysts hold interviews with system integrators, neutral-host operators, safety-code inspectors, and carrier network planners across North America, Europe, Asia-Pacific, and the Gulf. These conversations clarify installed-base growth, average equipment mark-ups, and 5G readiness ratios that secondary data alone cannot reveal.
Desk Research
We begin with structured reviews of public datasets from bodies such as the FCC, Ofcom, and ETSI for spectrum mandates; construction spend trackers from the U.S. Census and Eurostat that signal new floor space; shipment statistics from UN Comtrade for coaxial cable and RF amplifiers; and peer-reviewed papers in IEEE Xplore that benchmark DAS signal-propagation losses. Company 10-Ks, investor decks, and respected trade portals supplement trend discovery. Subscription resources, D&B Hoovers for integrator revenue splits and Dow Jones Factiva for deal news, help our team cross-check volume cues. The sources cited are illustrative rather than exhaustive, with many additional data points referenced during validation.
Market-Sizing & Forecasting
We anchor totals through a top-down reconstruction that scales new commercial floor area, public-safety code adoption rates, and 5G densification milestones to build the potential demand pool, which is then benchmarked against sampled supplier roll-ups and channel checks. Key inputs include average cost per radiating point, code-mandated square-foot coverage, 5G penetration in urban macro cells, fiber-backhaul price trends, and renovation cycles for Class-A real estate. Multivariate regression with time-series dummy variables projects 2026-2030 values, while bottom-up samples adjust for regional anomalies before final reconciliation.
Data Validation & Update Cycle
Outputs pass variance checks versus neutral spectrum-license fees and indoor traffic benchmarks, followed by analyst peer review. We refresh every twelve months and issue interim revisions when code changes or large-venue tenders materially move the needle.
How Mordor Intelligence's Distributed Antenna Systems Market Size Compares to Other Published Estimates
Published figures vary because firms adopt different scopes, assume divergent adoption speeds, or refresh models at unequal intervals.
Key gap drivers include whether retrofit projects are counted, if public-safety only installations are isolated, and the cadence at which 5G price erosion on equipment ASPs is applied.
Benchmark comparison
| Market Size | Anonymized source | Primary gap driver |
|---|---|---|
| USD 10.90 B (2025) | Mordor Intelligence | - |
| USD 11.36 B (2025) | Global Consultancy A | Includes small-cell radio units and counts announced but unfunded stadium retrofits |
| USD 10.10 B (2025) | Industry Research Firm B | Applies 15-year forecasting stretch and folds advanced antenna arrays into DAS total |
In summary, Mordor's disciplined scope, balanced top-down/bottom-up blend, and annual refresh cycle provide decision-makers with a dependable, transparent baseline that traces directly to verifiable square footage, code adoption, and equipment cost variables.


Key Questions Answered in the Report
What CAGR is forecast for the distributed antenna systems market through 2031?
The market is projected to grow at a 5.02% CAGR between 2026 and 2031.
Which antenna type is expanding fastest in the distributed antenna systems market?
Hybrid architectures are growing at 6.10% CAGR because they balance capital cost and performance.
Why are healthcare facilities investing in indoor wireless platforms?
Telemedicine adoption and stringent uptime needs push hospitals to install multi-operator DAS that guarantee uninterrupted coverage.
How do neutral-host models improve project economics for venue owners?
A single infrastructure serves all carriers, cutting capital outlay by up to 80% and generating lease income of USD 1,500-5,000 per operator each month.
Page last updated on:


