Satellite Antenna Market Size and Share
Market Overview
| Study Period | 2020 - 2031 |
|---|---|
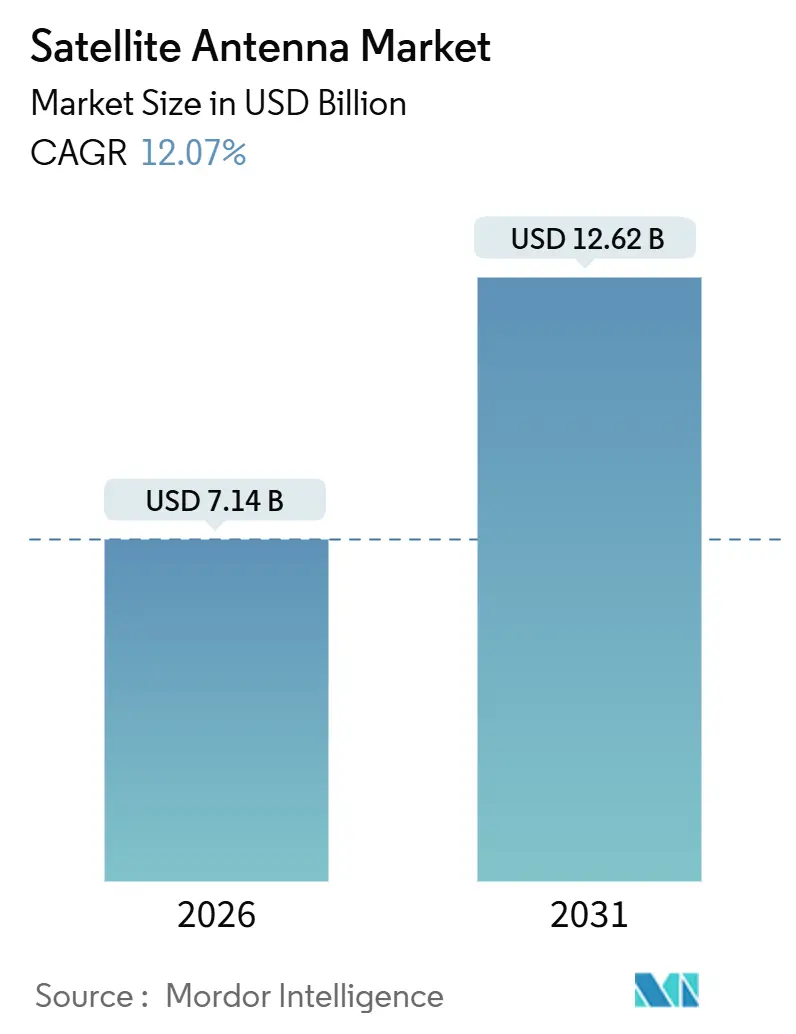
| Market Size (2026) | USD 7.14 Billion |
| Market Size (2031) | USD 12.62 Billion |
| Growth Rate (2026 - 2031) | 12.07% CAGR |
| Fastest Growing Market | Asia Pacific |
| Largest Market | North America |
| Market Concentration | Medium |
Major Players *Disclaimer: Major Players sorted in no particular order Image © Mordor Intelligence. Reuse requires attribution under CC BY 4.0. | |
Satellite Antenna Market Analysis by Mordor Intelligence
The satellite antenna market size reached USD 7.14 billion in 2026 and is on track to hit USD 12.62 billion by 2031, advancing at a 12.07% CAGR over the period. Growth is stoked by low-Earth-orbit (LEO) broadband constellations, rising defense demand for multi-orbit resiliency, high-throughput satellite (HTS) payload rollouts, and the commercial aviation push for reliable in-flight connectivity. Flat-panel electronically steered arrays (ESAs) continue to compress price points, catalyzed by automotive-style manufacturing partnerships, while regulatory streamlining in the United States and Europe trims certification lead times for airborne retrofits. Defense agencies are expanding budgets for protected X- and Ka-band terminals that interoperate across geostationary (GEO), medium Earth orbit (MEO), and LEO systems, even as commercial operators chase the lowest cost per bit. Meanwhile, export-control pressure on gallium-nitride chipsets and rain-fade challenges in equatorial regions temper near-term adoption in emerging markets.
Key Report Takeaways
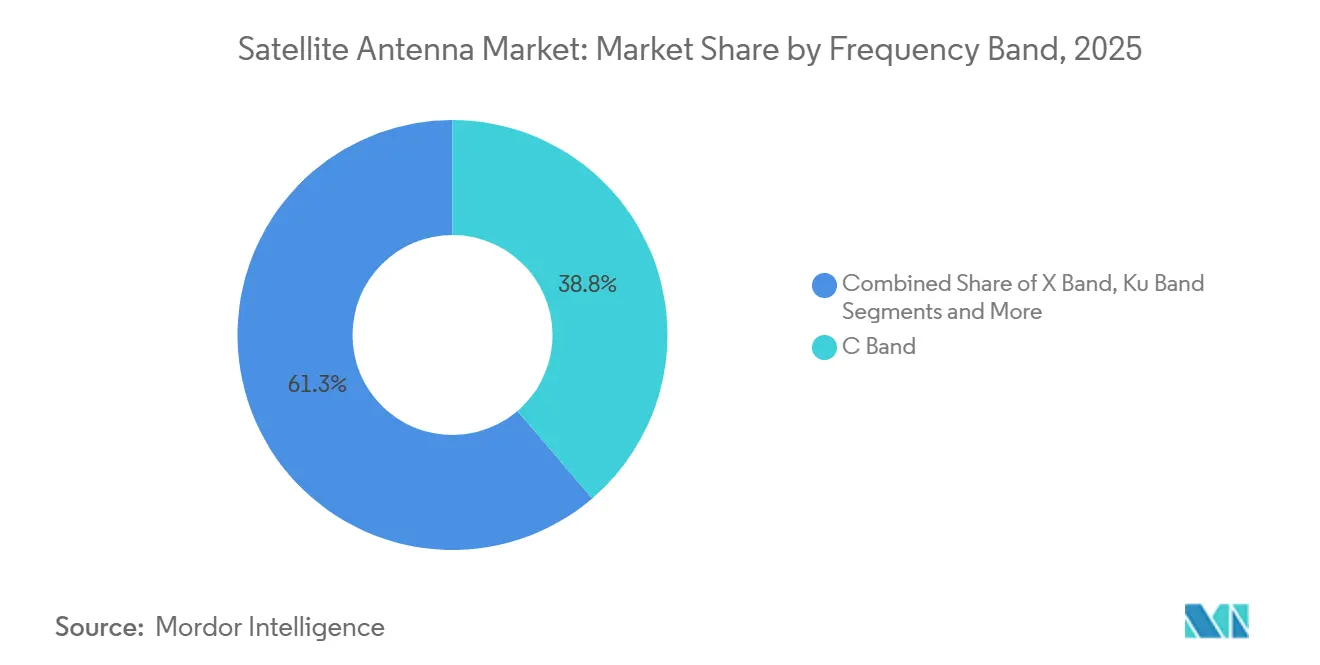
- By frequency band, C Band led with 38.75% of satellite antenna market share in 2025, while Ka Band is projected to expand at an 11.80% CAGR to 2031.
- By antenna type, parabolic reflectors commanded 44.10% of 2025 revenue; flat-panel designs are progressing at a 34.2% CAGR through 2031.
- By application, land-based platforms held 36.70% share of the satellite antenna market size in 2025, and airborne platforms are advancing at a 12.60% CAGR to 2031.
- By end user, the commercial segment captured 52.40% share in 2025, whereas government and defense procurement is set to rise at a 9.8% CAGR through 2031.
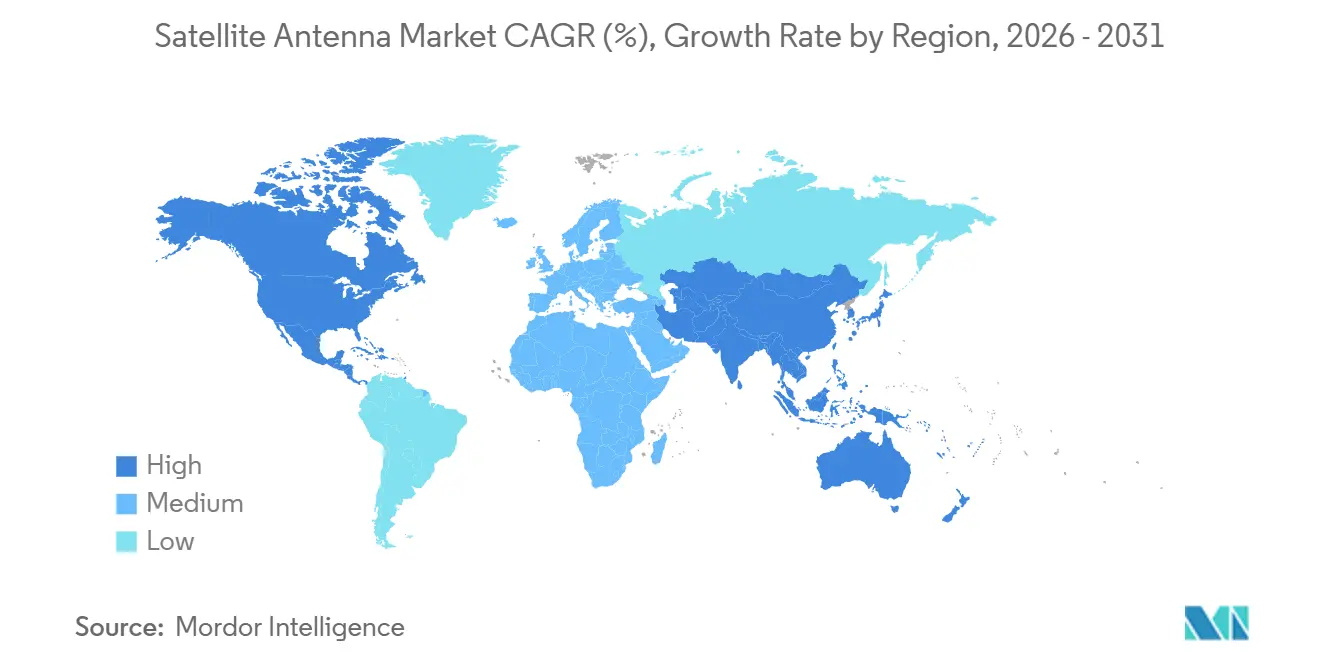
- By geography, North America retained 41.50% of 2025 revenue, and Asia-Pacific is forecast to register a 9.7% CAGR to 2031.
Note: Market size and forecast figures in this report are generated using Mordor Intelligence’s proprietary estimation framework, updated with the latest available data and insights as of January 2026.
Market Trends and Insights
Drivers Impact Analysis of Satellite Antenna Market*
| Driver | (~) % Impact on CAGR Forecast | Geographic Relevance | Impact Timeline |
|---|---|---|---|
| Proliferation of LEO Broadband Constellations | +3.2% | Global, early density in North America and Europe | Medium term (2-4 years) |
| Rapid Militarization of Space (MilSATCOM) | +2.8% | North America, Europe, Asia-Pacific | Long term (≥ 4 years) |
| High Throughput Satellite Payload Adoption | +2.1% | Global, concentrated in North America and Middle East | Medium term (2-4 years) |
| Commercial In-Flight Connectivity Boom | +1.9% | North America, Europe, Asia-Pacific aviation corridors | Short term (≤ 2 years) |
| ESA-Based Flat-Panel Cost Curve Deflation | +1.5% | Global, manufacturing hubs in North America and Asia-Pacific | Medium term (2-4 years) |
| Lunar and Cislunar Mission Communications | +0.6% | North America, Europe, Asia-Pacific | Long term (≥ 4 years) |
| Source: Mordor Intelligence | |||


Proliferation of LEO Broadband Constellations
More than 6,750 Starlink spacecraft orbited by late-2024, with Eutelsat OneWeb completing its 648-satellite first-generation network the same year. Amazon’s Project Kuiper must orbit 1,663 satellites by July 2026 to preserve spectrum, locking in demand for user terminals as milestones near. These mega-constellations oblige antennas that track multiple fast-moving targets, pushing ESAs over parabolic dishes in aviation, maritime, and land-mobile segments. Parity pricing on flat panels is emerging as volumes climb, and constellation operators often subsidize hardware to accelerate subscriber uptake. The resulting ecosystem shift compresses cost per megabit, encouraging telcos in remote regions to adopt satellite backhaul for last-mile broadband.
Rapid Militarization of Space (MilSATCOM)
The U.S. Department of the Air Force awarded L3Harris a USD 1.2 billion terminal contract in mid-2024, underscoring defense appetite for multi-orbit resiliency[1]Source: Jen Judson, “Air Force Taps L3Harris for USD 1.2 Billion Multi-Orbit Terminals,” Defense News, defensenews.com. NATO released a resilient SATCOM framework that mandates terminal agility between commercial and military satellites within milliseconds to avoid jamming [2]Source: NATO Allied Command Transformation, “Framework for Resilient SATCOM,” NATO, nato.int. Asian defense agencies mirror this posture: India launched dedicated communications satellites in 2024 and Japan funded new X-band ground stations in its 2025 budget. These initiatives elevate demand for X- and Ka-band hardware with encryption, embedded cybersecurity, and anti-jam waveforms. Established primes with classified-program experience retain an edge, although flat-panel innovators are gaining traction by partnering with system integrators.
High Throughput Satellite Payload Adoption
HTS architectures multiply available capacity by using thousands of steerable spot beams. SES’s O3b mPOWER became fully operational in 2024, delivering more than 50,000 Ka-band beams that can be reassigned in seconds. Viasat’s ViaSat-3 Americas platform entered service the same year, adding 1 terabit-per-second throughput for mobility clients. These payloads incentivize dual-frequency (Ku- and Ka-band) antennas able to adapt coding and modulation in real time. Operators with HTS capacity sell bandwidth in gigabit blocks rather than transponders, favoring terminals with beam-steering software. The HTS boom also fuels terminal upgrades in broadcast, mining, and oil-and-gas teleports that historically ran lower-capacity C-band systems.
Commercial In-Flight Connectivity Boom
Starlink Aviation counted more than 100,000 installations by end-2024, while Gogo Business Aviation posted an 18% shipment jump that year, thanks to Gulfstream and Bombardier line-fit deals. The U.S. Federal Aviation Administration trimmed supplemental type-certificate processing for ESAs to under 12 months, removing a major bottleneck. Airlines monetize connectivity through premium seats, advertising, and operational data links, shifting the service from a cost center to a top-line enhancer. Drag-reducing flat panels replace dome radomes on narrow-body fleets, saving fuel and supporting sustainability pledges. Competitive differentiation now hinges on delivering streaming-class bandwidth gate-to-gate without costly firmware swaps when roaming across GEO and LEO systems.
Restraints Impact Analysis of Satellite Antenna Market*
| Restraint | (~) % Impact on CAGR Forecast | Geographic Relevance | Impact Timeline |
|---|---|---|---|
| Ku-/Ka-Band Rain Fade in Equatorial Regions | −1.4% | Equatorial Africa, Southeast Asia, Central and South America | Short term (≤ 2 years) |
| Export-Control Bottlenecks on ESA Chipsets | −1.8% | Global, most acute in Asia-Pacific and Middle East | Medium term (2-4 years) |
| Mounting Orbital-Debris Insurance Premiums | −0.9% | Global, pronounced for operators and launch providers | Medium term (2-4 years) |
| CAPEX Crunch at Emerging-Market Telcos | −1.1% | Africa, South America, select Asia-Pacific nations | Short term (≤ 2 years) |
| Source: Mordor Intelligence | |||
Export-Control Bottlenecks on ESA Chipsets
The Bureau of Industry and Security tightened export controls on gallium nitride in 2024, slowing phased-array chipset deliveries to Asia-Pacific buyers. China countered by restricting outbound gallium and germanium, prompting non-Chinese fabs to qualify alternative supply chains at higher cost. ITAR rules add six-to-nine-month delays for many commercial transactions, as Kymeta disclosed in investor materials. Hanwha Phasor chose to open a U.S. subsidiary to navigate the regime, duplicating engineering resources and elongating roadmaps. These constraints elevate terminal pricing in price-sensitive regions and complicate multinational deployment schedules.
Ku/Ka-Band Rain Fade in Equatorial Regions
Heavy precipitation in tropical zones introduces 0.4-2 dB/km attenuation at Ka-band frequencies, occasionally dropping link availability below 99.5% during monsoons. Operators mitigate risk through adaptive coding, uplink power control, and site diversity, but these tactics increase capital and operational expenses. Maritime users on equatorial shipping lanes must oversize antennas or accept service degradation, reducing the addressable market for high-capacity terminals. Telcos in Southeast Asia and equatorial Africa therefore weigh fiber or microwave as backhaul alternatives, delaying satellite upgrades. Hybrid Ku-Ka dual-band systems help restore uptime but raise bill-of-materials costs for ESAs, challenging vendors to protect margins.
*Our forecasts treat driver/restraint impacts as directional, not additive. The impact forecasts reflect baseline growth, mix effects, and variable interactions.
Satellite Antenna Market Segment Analysis
By Frequency Band:
Ka-Band Momentum Reshapes Spectrum EconomicsKa Band is projected to record an 11.80% annual expansion to 2031, making it the fastest-growing slice of the satellite antenna market. SES O3b mPOWER and Viasat ViaSat-3 both rely on Ka spot beams that can be flexed regionally, and their combined demand anchors multiyear procurement of dual-band ESAs. In contrast, C Band retained a 38.75% satellite antenna market share in 2025, serving government teleports, disaster-recovery nodes, and broadcast uplinks that prize rain-fade resilience. Ku Band remains a workhorse for direct-to-home and first-generation aeronautical links, yet growth is slowing as capacity migrates upward in frequency. L/S and VHF/UHF bands hold niche roles in mobile satellite services and legacy defense radios.
Operators lean on Ka-band for higher spectral efficiency and abundant regulatory allocations secured at the 2023 World Radiocommunication Conference. Integrators now bundle adaptive coding to tame equatorial fade and employ dual-band architectures that steer traffic to Ku during severe weather, preserving quality of service. This mixed-spectrum approach allows premium airlines to guarantee streaming-grade inflight plans and lets oil-rig operators keep SCADA networks online during storms. As unit costs fall, Ka antennas move down-market into small merchant ships and remote agriculture, broadening the customer base without cannibalizing C-band reliability tiers.


By Antenna Type:
Flat-Panel ESA Disrupts Parabolic IncumbencyParabolic reflectors held 44.10% of 2025 revenue, a testament to proven mechanics and low upfront cost for fixed sites. Nonetheless, flat-panel designs are scaling at a 34.2% CAGR, the standout rate in the satellite antenna market through 2031, thanks to thin profiles that reduce drag on aircraft and eliminate moving parts on vehicles. Ball Aerospace partnered with Flex to bring automotive surface-mount economics to phased-array lines, targeting a 40% price cut per unit. Kymeta’s Osprey u8 priced below USD 9,000 in 2024, slashing entry costs for small craft. Horn, dielectric-resonator, FRP-radome, and metal-stamp variants play supportive roles, either as specialty radiators or protective housings.
Manufacturers diversify with hybrid solutions, such as Intellian’s v240MT that marries a 2.4 m parabolic dish with software-defined modems allowing agile GEO-LEO handoffs. Optical beamforming prototypes from All.Space replace radio-frequency phase shifters with liquid-crystal elements, trimming component counts by 60%, boosting yield, and lowering power draw. Meanwhile, Greenerwave’s reconfigurable intelligent surfaces aim to steer beams without active RF components, a potentially transformative path for battery-powered land portable terminals.
By Application:
Airborne Platforms Accelerate FastestLand-based systems led the satellite antenna market size in 2025 at 36.70% of sales, reflecting entrenched demand for teleports, cellular backhaul, and enterprise VSAT. Yet airborne platforms represent the fastest climber at a 12.60% CAGR through 2031 as airlines race to retrofit narrow-body fleets. Starlink Aviation’s rapid penetration and FAA certification reform are headline enablers. Airlines monetize bandwidth through ticket premiums and loyalty-program engagement, and business-jet operators treat always-on communication as a default amenity for C-suite passengers. Spaceborne antennas form a small but strategic slice, focused on inter-satellite and deep-space links that test cutting-edge pointing technologies.
Maritime adoption also re-accelerates, driven by Royal Caribbean’s fleet-wide Starlink rollout and container-ship operators seeking predictive maintenance feeds. Cruise and offshore-energy customers increasingly demand gigabit-class throughput, causing antenna makers to offer multi-orbit, multi-band terminals housed in single radomes to simplify deck integration and cut swap costs. Land mobile remains steady, buoyed by first-responder agencies integrating high-speed links for drones, bodycams, and situational-awareness platforms.

By End User:
Defense Procurement Sustains Premium PricingCommercial buyers held 52.40% of satellite antenna market share in 2025, but defense budgets deliver the thickest margins and are forecast to grow 9.8% annually. The Space Force, U.S. Army, and allied ministries prize ruggedized terminals that hop among GEO, MEO, and LEO links, integrate encryption, and withstand cyber attacks. Commercial telcos chase dollar-per-gig efficiencies, accepting shorter life cycles and relying on subsidy-laden hardware from constellation operators. The divergence creates parallel supply chains: primes build bespoke MilSATCOM kits in classified facilities, while venture-backed ESA specialists ship standard SKUs through e-commerce channels.
Hybrid procurement arises when defense agencies lease capacity from commercial LEO constellations, thereby spurring demand for dual-use terminals. Vendors that can certify to both ARINC and MIL-STD standards unlock broader addressable markets. At the same time, insurance-related cost escalation in orbital debris pushes network operators to negotiate risk-sharing clauses, indirectly affecting antenna replacement cycles as fleets deorbit older spacecraft sooner.
Geography Analysis
North America Satellite Antenna Market
North America anchored 41.50% of 2025 revenue, propelled by early LEO deployments, the Space Force’s modernization roadmap, and streamlined FAA processes. Defense primes such as L3Harris and Viasat enjoy multi-year contracts that stabilize domestic demand even as commercial aviation retrofits accelerate. Canada’s rural broadband programs also procure thousands of fixed terminals, expanding the customer base beyond mobility verticals. While growth slows as installed bases mature, aftermarket upgrades for dual-band capability sustain volumes.
APAC Satellite Antenna Market
Asia-Pacific is projected to advance at a 9.7% CAGR to 2031, the strongest regional trajectory in the satellite antenna market. China’s plan to orbit 13,000 satellites by 2030 mandates tens of thousands of ground terminals each year, and the nation is spinning up domestic GaN foundries to reduce exposure to U.S. export controls. India targets a USD 44 billion space economy by 2033, catalyzing public-private joint ventures in antenna fabrication. Japan’s quasi-zenith satellite expansion and South Korea’s defense export ambitions add further pull. Regulatory bodies in Australia and Indonesia now pre-approve Starlink terminal imports, reflecting policy momentum across the region.
EMEA and South America Satellite Antenna Market
Europe balances sovereign security goals and commercial aspirations. The European Space Agency’s IRIS² secure-connectivity constellation received EUR 150 million in funding in 2024, directly subsidizing user-terminal procurements for critical infrastructure operators [3]Source: European Space Agency, “IRIS² Secures Funding,” esa.int. OneWeb’s completed network supplies broadband to maritime operators in the North Sea and Mediterranean, requiring dual-band antennas that roam between LEO and GEO links. The Middle East invests in Ka-band ground stations to support lunar gateway missions and resilient communication for remote oilfields. Sub-Saharan Africa and South America lag on capital outlays, yet Starlink’s direct-to-consumer model circumvents telco partners, shipping self-install kits to rural households and sparking incremental demand for low-cost ESAs.
Mordor Intelligence provides coverage of the satellite antenna market across other key regional markets, including Europe, Middle East, and Africa, each with their regulatory frameworks and demand patterns.

Competitive Landscape
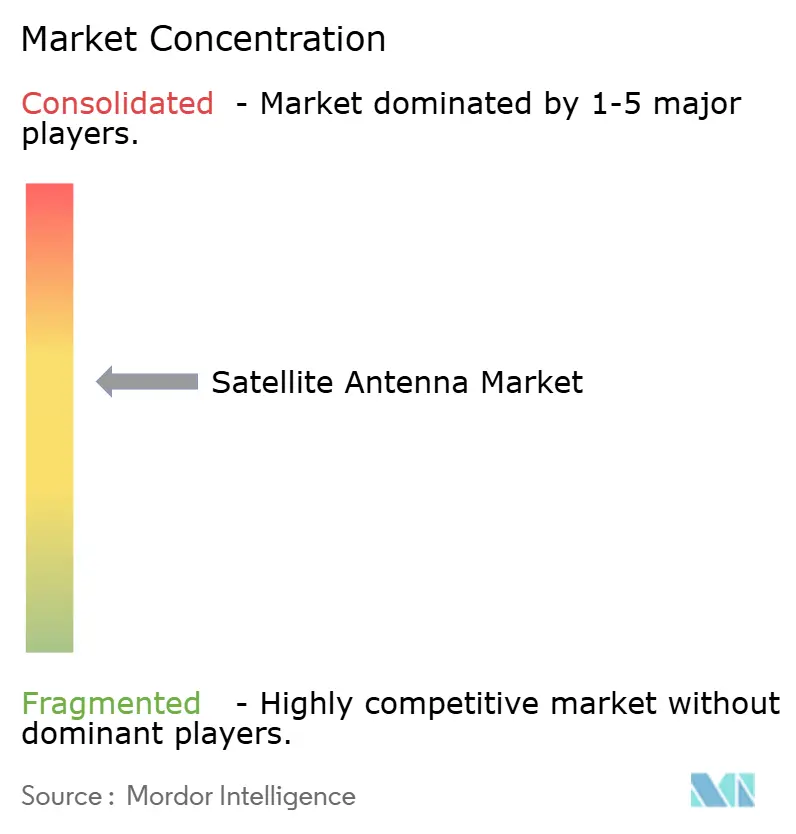
Competition is moderately fragmented, with the top five suppliers controlling a little over 60% of revenue. Primes such as L3Harris, Honeywell, and Viasat leverage vertically integrated stacks covering payloads, terminals, and service layers, allowing bundled contracts that lock in customers for years. Yet these incumbents face nimble challenges: Kymeta markets metamaterial flat panels priced for mass adoption, All.Space brings optical beamforming to cut component counts, and Hanwha Phasor scales dual-band ESAs for defense mobility programs. Manufacturing alliances - Ball Aerospace with Flex - signal a pivot from artisanal builds to automotive-style throughput, a prerequisite for meeting LEO-constellation volumes.
Regulation shapes rivalry. ITAR pushes many non-U.S. vendors to form domestic subsidiaries, as seen with Hanwha Phasor’s 2024 U.S. expansion. Spectrum licensing and orbital-debris compliance further raise the bar, benefiting firms with in-house legal teams who can fast-track filings. Insurers embed the Space Sustainability Rating in underwriting models, prompting operators to favor terminal vendors with active collision-avoidance protocols that minimize premium hikes.
Technology roadmaps cluster around multi-orbit agility, power efficiency, and software-defined modems. Vendors embed artificial-intelligence beam-tracking to reduce handoff latency below 100 milliseconds, a requirement for cloud gaming and remote-piloting applications. The convergence of satellite and terrestrial 5G networks puts antenna makers at the heart of direct-to-device ambitions, where smartphones latch directly onto LEO satellites without relay towers. Early field trials by AST SpaceMobile and Lynk drive fresh R&D alliances between handset OEMs and ESA suppliers, hinting at another wave of disruptive entrants by decade’s end.
Satellite Antenna Industry Leaders
Honeywell International Inc.
Viasat Inc.
L3Harris Technologies Inc.
Cobham SATCOM
Intellian Technologies
- *Disclaimer: Major Players sorted in no particular order
Satellite Antenna Market Companies Covered in this Report
- Honeywell International Inc.
- CPI International Inc.
- Kymeta Corp.
- Norsat International Inc.
- Cobham SATCOM
- L3Harris Technologies Inc.
- Viasat Inc.
- Airbus Defence and Space
- Gilat Satellite Networks Ltd.
- Maxar Technologies
- Ball Aerospace
- Intellian Technologies
- Isotropic Systems (All.Space)
- Hanwha Phasor
- SES S.A. (O3b mPOWER User Terminals)
- Thales Alenia Space
- MT Mechatronics
- SatixFy Ltd.
- General Dynamics Mission Systems
- LEOcloud Inc.
- Hughes Network Systems

Recent Industry Developments in Satellite Antenna Market
- December 2024: Royal Caribbean completed fleet-wide deployment of Starlink Maritime connectivity across its cruise ships.
- November 2024: Eutelsat OneWeb finalized its 648-satellite constellation and signed terminal deals with Intellian and Hughes.
- October 2024: The European Space Agency allotted EUR 150 million to launch the IRIS² secure-connectivity constellation.
- September 2024: All.Space acquired Isotropic Systems, gaining optical beamforming intellectual property valued at about USD 50 million.


Satellite Antenna Market Report Scope and Research Methodology
Market Definition and Coverage
Our study defines the satellite antenna market as all newly manufactured parabolic, flat-panel, horn, and related antenna systems operating in Ku, Ka, C, X, L/S, and VHF/UHF bands that enable space-to-space or space-to-ground links across land, maritime, airborne, and spaceborne platforms. We value factory-gate hardware revenue in constant 2025 USD.
Scope Exclusion: We exclude VSAT airtime contracts, consumer TV-sat dishes, and phased-array modules already embedded inside full aircraft connectivity kits.
Segments Covered in This Report
- By Frequency Band
- C Band
- X Band
- Ku Band
- Ka Band
- L/S Band
- VHF/UHF Band
- By Antenna Type
- Parabolic Reflector
- Flat-Panel (ESA/RSA)
- Horn
- Dielectric-Resonator
- FRP-Radome
- Metal-Stamp
- By Application
- Spaceborne
- Airborne
- Maritime
- Land (Mobile and Fixed)
- By End-User
- Commercial
- Government and Defense
- By Geography
- North America
- United States
- Canada
- Mexico
- Europe
- Germany
- United Kingdom
- France
- Italy
- Spain
- Russia
- Rest of Europe
- Asia-Pacific
- China
- Japan
- India
- South Korea
- Australia
- Rest of Asia-Pacific
- Middle East
- Saudi Arabia
- United Arab Emirates
- Turkey
- Rest of Middle East
- Africa
- South Africa
- Nigeria
- Rest of Africa
- South America
- Brazil
- Argentina
- Rest of South America
- North America
Data Sources, Market Sizing, and Validation
Primary Research
We validated secondary insights through interviews with antenna OEM engineers, launch-service buyers, naval communications officers, and airborne connectivity integrators across North America, Europe, and Asia-Pacific. Their guidance sharpened adoption timelines, realistic average selling prices, and failure-rate assumptions that literature alone could not reveal.
Desk Research
We began by harvesting numeric clues from tier-1 public sources, such as ITU network filings, FCC earth-station logs, NASA and ESA launch manifests, International Maritime Organization vessel registries, and SIPRI defense spending tables; these datasets let us trace annual antenna demand by platform and band with credible lineage. Our team also accessed D&B Hoovers financials, Dow Jones Factiva archives, and MarkLines aerospace parts data to cross-check supplier revenue splits and contract volumes. Company 10-Ks, investor decks, trade-show proceedings, and IEEE papers rounded out the evidence pool. The catalogue cited here is illustrative; many additional repositories informed our desk work.
Market-Sizing & Forecasting
We applied a top-down launch-and-installation reconstruction that starts with platform build counts, orbit deployments, and retrofit cycles, which are then multiplied by penetration rates and calibrated ASP curves. Select bottom-up supplier roll-ups and channel checks served as guardrails that flagged over-counts. We run a multivariate regression to 2030 using six core drivers: annual Ku/Ka launch manifests, high-throughput satellite capacity additions, defense SATCOM capital budgets, commercial in-flight connectivity fleet counts, maritime broadband activations, and flat-panel cost deflation trends. This is where Mordor Intelligence differentiates by aligning each variable with consensus ranges gathered from expert calls.
Data Validation & Update Cycle
We triangulate every forecast with independent metrics, trigger anomaly alerts inside the model, and route outputs through a two-step peer review before sign-off. Reports refresh yearly, and we perform interim updates when major launches slip, large defense contracts are awarded, or currency swings distort ASPs, ensuring clients receive a freshly reviewed dataset at delivery.
How Mordor Intelligence's Satellite Antenna Market Size Compares to Other Published Estimates
Published values often diverge because firms pick different antenna families, pricing anchors, refresh cadences, and currency bases. We acknowledge those realities upfront so buyers can gauge fit.
Gap drivers usually stem from whether consumer dishes are counted, how flat-panel ASP erosion is treated, and if dual-orbit replacements are netted out. Mordor Intelligence posts figures in constant 2025 USD, updates annually, and tests scope choices with end-user interviews, whereas several publishers rely on earlier datasets, broader service inclusions, or one-off shipment extrapolations.
Benchmark comparison
| Market Size | Anonymized source | Primary gap driver |
|---|---|---|
| USD 6.36 B (2025) | Mordor Intelligence | n/a |
| USD 6.96 B (2024) | Global Consultancy A | Includes flat-panel radome service revenue and does not net out dual-orbit replacements |
| USD 4.82 B (2024) | Regional Consultancy B | Excludes defense antenna procurements and freezes Ku-band ASPs |
| USD 4.10 B (2021) | Trade Journal C | Uses older base year and relies on shipment extrapolation without recent ASP erosion adjustment |
The comparison shows that when scope breadth, price curves, and update rhythm line up coherently, estimates converge toward our balanced baseline. According to Mordor Intelligence, this disciplined, transparent path makes our numbers a dependable foundation for strategic decisions.


Key Questions Answered in the Report
How large is the satellite antenna market in 2026?
The market generated USD 7.14 billion in 2026 and is projected to grow to USD 12.62 billion by 2031.
Which frequency band is expanding the fastest?
Ka Band leads growth with an 11.80% CAGR, driven by high-throughput satellite payloads and LEO broadband rollouts.
Why are flat-panel ESAs gaining traction over parabolic dishes?
ESAs offer low profiles, simultaneous multi-satellite tracking, and lower maintenance because they have no moving parts, making them ideal for aircraft, vehicles, and maritime vessels.
Which region will post the highest growth through 2031?
Asia-Pacific is forecast to register a 9.7% CAGR due to large constellation deployments in China and expanding space programs in India and Japan.
Page last updated on:


