Market Overview
| Study Period | 2021 - 2031 |
|---|---|
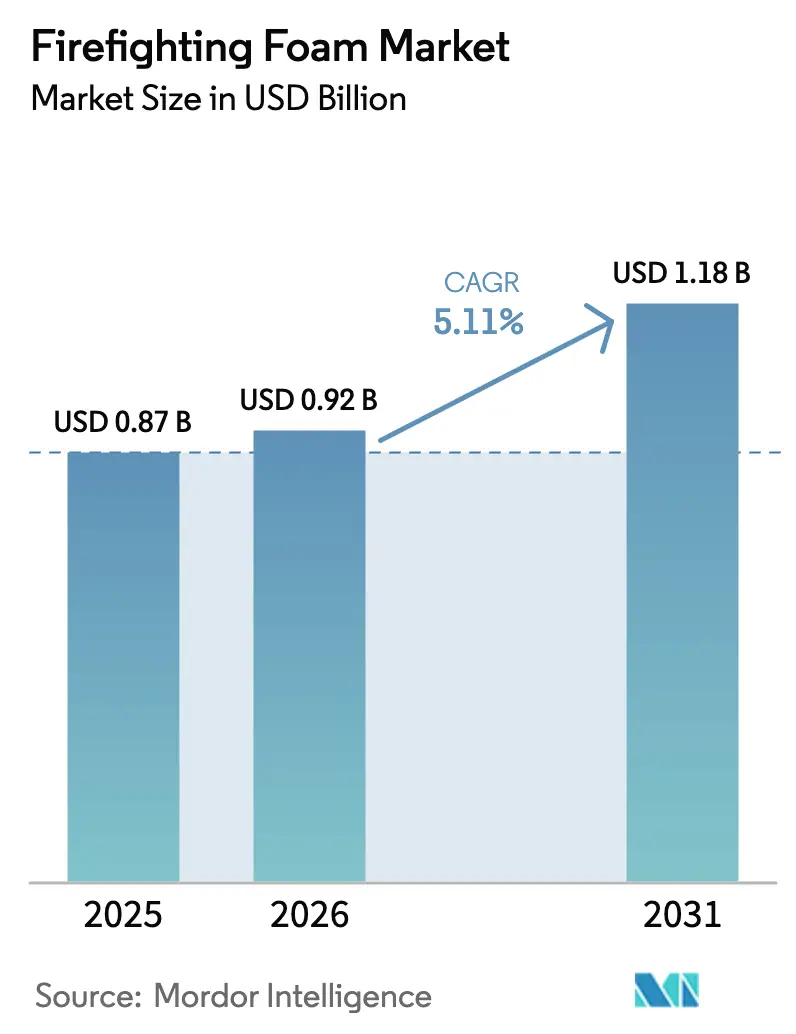
| Market Size (2026) | USD 0.92 Billion |
| Market Size (2031) | USD 1.18 Billion |
| Growth Rate (2026 - 2031) | 5.11% CAGR |
| Fastest Growing Market | Asia Pacific |
| Largest Market | North America |
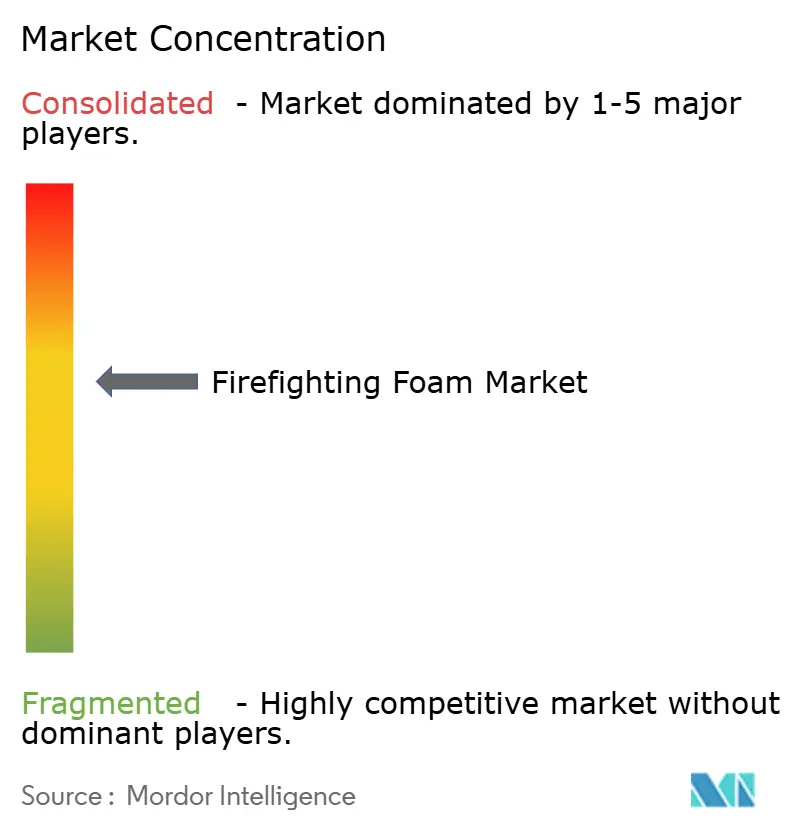
| Market Concentration | Medium |
Major Players *Disclaimer: Major Players sorted in no particular order Image © Mordor Intelligence. Reuse requires attribution under CC BY 4.0. | |
Firefighting Foam Market Analysis by Mordor Intelligence
The Firefighting Foam Market size was valued at USD 0.87 billion in 2025 and is estimated to grow from USD 0.92 billion in 2026 to reach USD 1.18 billion by 2031, at a CAGR of 5.11% during the forecast period (2026-2031). Ongoing regulatory pressure against per- and polyfluoroalkyl substances (PFAS) is accelerating a pivot away from aqueous film-forming foam (AFFF) toward fluorine-free concentrates that help asset owners sidestep liability exposure under new U.S. and European rules. At the same time, stricter industrial‐safety mandates in oil, gas, mining, and warehouse environments are lifting baseline demand for fixed-foam systems, while rapid build-out of LNG bunkering, hydrogen hubs, and mega-logistics facilities is opening new high-growth application pockets across Asia-Pacific and the Middle East. Competitive intensity is rising as specialty suppliers introduce second-generation fluorine-free formulations that close historical performance gaps and secure third-party certifications from Underwriters Laboratories (UL) and the International Civil Aviation Organization (ICAO). Together, these forces are reshaping procurement strategies, driving capital-expenditure cycles for retrofits, and compressing the product-development window for incumbents that still rely on PFAS-based chemistries.
Key Report Takeaways
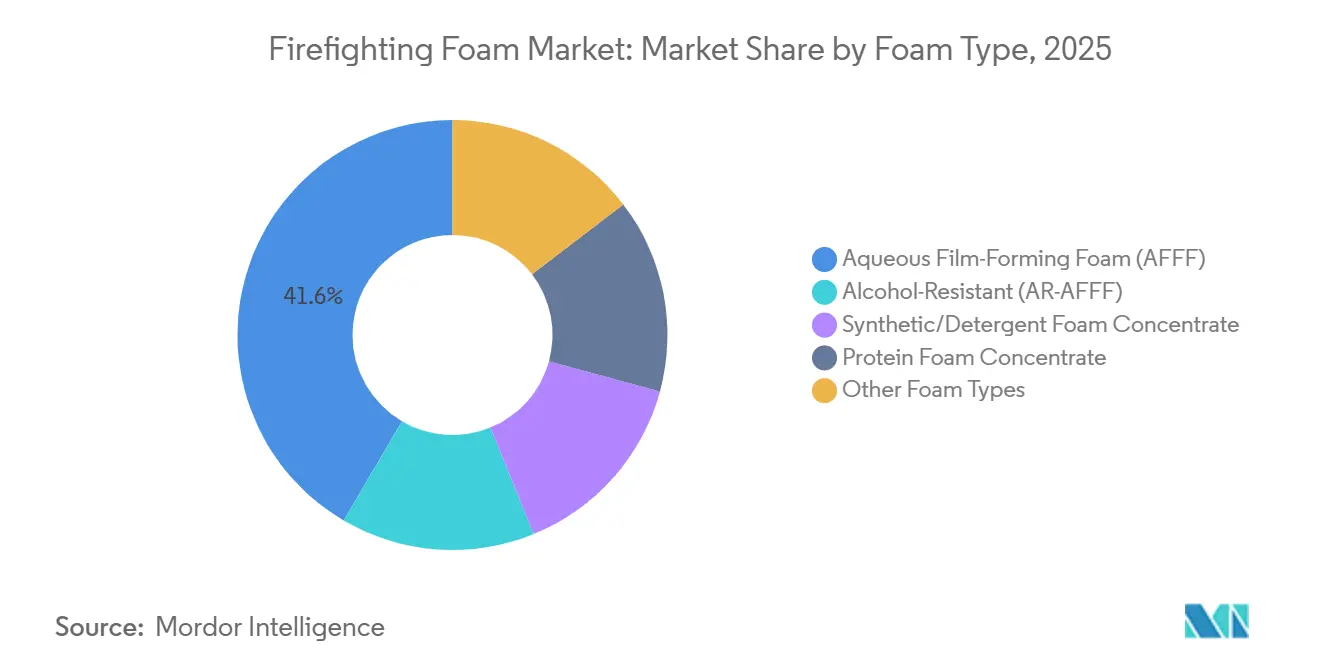
- By foam type, AFFF led with 41.55% revenue share in 2025; other foam types are forecast to expand at a 6.31% CAGR to 2031.
- By fluorine content, PFAS-containing products accounted for 54.79% of the Firefighting Foam market share in 2025, while fluorine-free foams are advancing at a 6.61% CAGR through 2031.
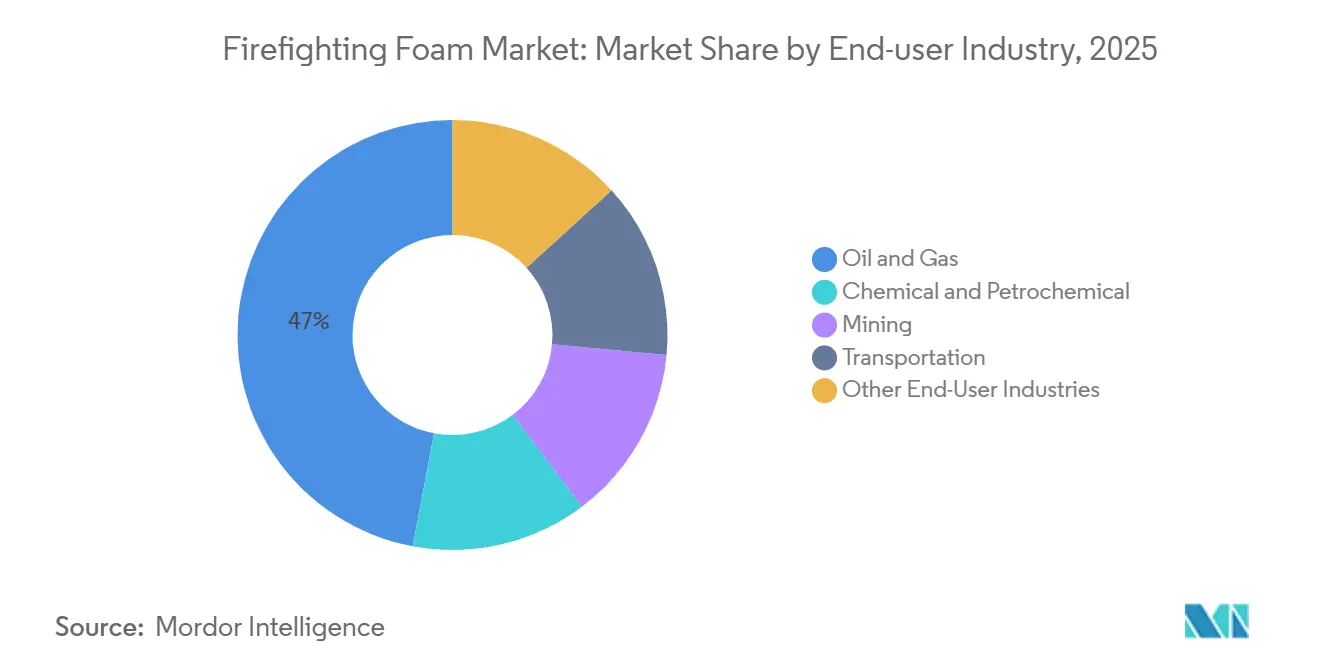
- By end-user industry, oil and gas commanded a 47.05% share of the Firefighting Foam market size in 2025; mining is projected to grow at a 6.45% CAGR between 2026-2031.
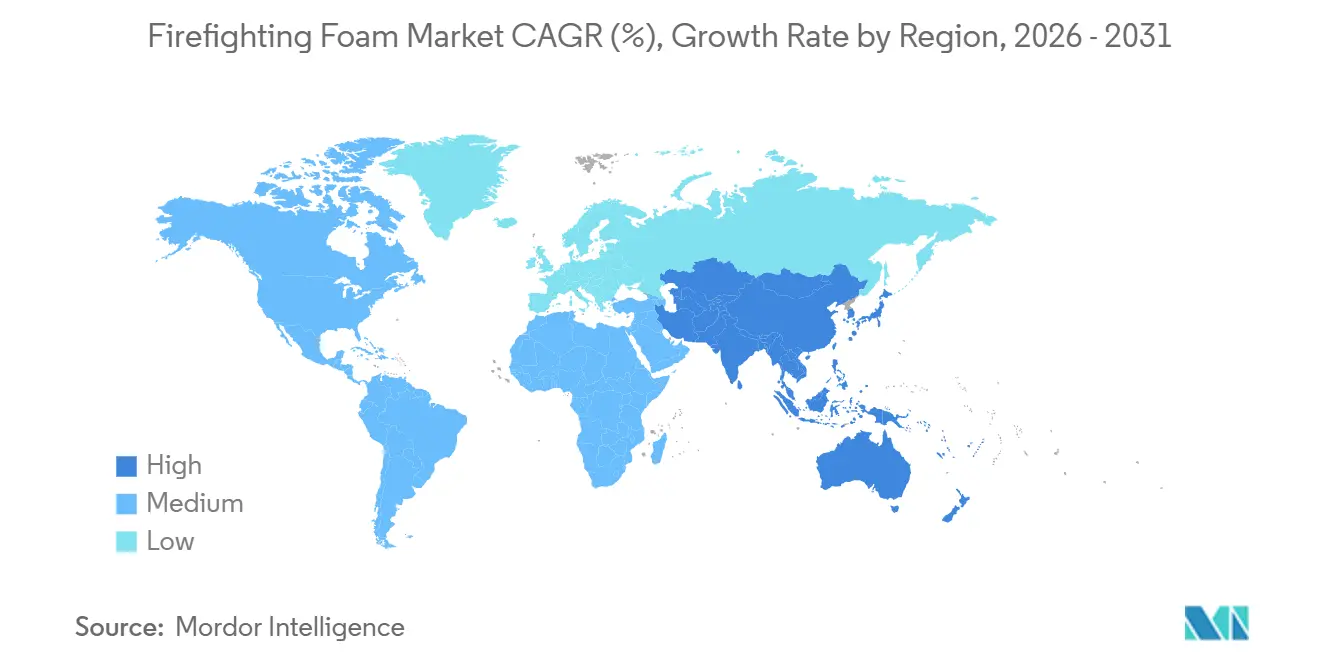
- By geography, North America held 38.71% revenue share in 2025; Asia-Pacific is on track for the fastest regional expansion at a 6.04% CAGR through 2031.
Note: Market size and forecast figures in this report are generated using Mordor Intelligence’s proprietary estimation framework, updated with the latest available data and insights as of January 2026.
Global Firefighting Foam Market Trends and Insights
Drivers Impact Analysis*
| Drivers | (~) % Impact on CAGR Forecast | Geographic Relevance | Impact Timeline |
|---|---|---|---|
| Transition toward fluorine-free foams accelerated by PFAS regulations | +1.8% | Global, with North America and EU leading enforcement | Medium term (2-4 years) |
| Strict government mandates to maintain industrial safety | +1.2% | Global, concentrated in oil and gas and chemical sectors | Long term (≥ 4 years) |
| Rising fire risk at expanding LNG bunkering and hydrogen hubs | +0.9% | APAC core (China, South Korea, Japan), spill-over to Middle East | Medium term (2-4 years) |
| Mandatory fixed-foam systems in mega-warehouses and automated logistics centers | +0.7% | North America, Europe, APAC urban corridors | Short term (≤ 2 years) |
| Increased military and aviation fire-protection retrofits | +0.6% | North America, Europe, select Middle East bases | Medium term (2-4 years) |
| Source: Mordor Intelligence | |||
Transition Toward Fluorine-Free Foams Accelerated by PFAS Regulations
Regulatory action intensified in 2025 and 2026 as the European Union finalized a binding PFAS phase-out for non-military foam applications by 2028, prompting airports in France, Germany, and the United Kingdom to convert early to avoid stranded assets. In the United States, the Federal Aviation Administration issued Advisory Circular 150/5210-6E in March 2025, opening the door for fluorine-free foams at 520 commercial airports formerly locked into AFFF procurement.[1]Federal Aviation Administration, “Advisory Circular 150/5210-6E,” FAA.GOV. Australia’s Civil Aviation Safety Authority followed in August 2025 with a similar directive covering new airport construction. Collectively, these measures shortened AFFF life cycles, forced manufacturers to accelerate portfolio reformulations, and required operators to budget for retrofits. In the United States, stakeholders face remediation liabilities at individual contaminated sites, a consequence of delayed actions under CERCLA enforcement.
Strict Government Mandates to Maintain Industrial Safety
In response to a series of high-profile incidents, regulators in the oil, gas, and petrochemical sectors worldwide tightened fire-protection codes between 2024 and 2025. In India, the Petroleum and Natural Gas Regulatory Board mandated the installation of fixed-foam systems at onshore oil terminals and LNG facilities with large capacities. This directive encompasses projects currently under construction across three coastal states.[2]Petroleum and Natural Gas Regulatory Board India, “Safety Standards,” PNGRB.GOV.IN. Meanwhile, in June 2025, Saudi Aramco revised its internal engineering standards, stipulating foam-water deluge protection for hydrogen and blue-ammonia plants being developed in Jubail and Ras Al Khair. Over in the U.S., OSHA put forth a proposal for annual third-party testing of foam systems at chemical plants managing flammable liquids. This move impacts facilities and shifts procurement trends towards higher-performance, fluorine-free options, even with a premium on unit prices.
Rising Fire Risk at Expanding LNG Bunkering and Hydrogen Hubs
By the end of 2025, the number of global LNG bunkering sites surged. Each site now stocks concentrate, adhering to NFPA 11 application-rate guidelines. The global count of hydrogen refueling stations also saw a notable rise. In Japan, all heavy-duty hydrogen stations are now required to have foam-water spray systems. Meanwhile, South Korea mandates fixed-foam protection at blue-hydrogen facilities. Both Japan and South Korea have shown a preference for fluorine-free foams, which boast low conductivity and a diminished risk of static discharge. This trend is steering the Firefighting Foam market towards synthetic detergent chemistries, known for their enhanced stability in cryogenic conditions.
Mandatory Fixed-Foam Systems in Mega-Warehouses and Automated Logistics Centers
As e-commerce surges, the urgency for robust fire protection in warehouses intensifies. The NFPA 13 has mandated that U.S. warehouses housing high-hazard commodities must now install foam-water sprinklers or in-rack suppression systems. This directive has had an immediate effect on pre-existing warehouses. In Germany, similar regulations have been rolled out for automated facilities. Meanwhile, China has unveiled GB 50016-2025, targeting logistics centers that feature robotic sorting and battery-charging stations. Warehouse operators are increasingly opting for fluorine-free foams, which leave minimal residue on sensitive electronics and conveyor systems, underscoring a collective move away from traditional AFFF solutions.
Restraints Impact Analysis*
| Restraints | (~) % Impact on CAGR Forecast | Geographic Relevance | Impact Timeline |
|---|---|---|---|
| Environmental and health liabilities of PFAS-bearing foams | -0.9% | Global, acute in North America and EU | Short term (≤ 2 years) |
| High disposal, cleanup and retrofit costs for legacy systems | -0.6% | North America, Europe, developed APAC markets | Medium term (2-4 years) |
| Performance gap and compatibility limits in some fluorine-free alternatives | -0.4% | Global, concentrated in oil and gas and aviation | Short term (≤ 2 years) |
| Source: Mordor Intelligence | |||
Environmental and Health Liabilities of PFAS-Bearing Foams
Starting January 2026, new U.S. drinking-water standards will limit PFOA and PFOS levels to minimal levels. This move has labeled numerous public water systems as non-compliant, with significant remediation costs anticipated. Manufacturers are feeling the pinch: a major settlement in 2024 underscored the escalating costs tied to legacy PFAS liabilities. Meanwhile, in Germany, authorities mandate producer-funded programs for take-back and destruction, inflating end-of-life expenses. In response, insurers have begun excluding PFAS coverage from general-liability policies, hastening the obsolescence of AFFF in the Firefighting Foam market.
High Disposal, Cleanup, and Retrofit Costs for Legacy Systems
High-temperature incineration of PFAS foam is expensive. A refinery with significant quantities of AFFF could face substantial disposal bills, and that's before factoring in any system upgrades. When retrofitting, facilities often need to invest in new proportioning pumps, piping, and nozzles. This is due to fluorine-free foams being more viscous than AFFF, leading to additional expenses for a mid-sized facility. However, smaller airports and independent fuel terminals, lacking sufficient capital reserves, are turning to government grants, which often fall short of the requested amounts.
*Our forecasts treat driver/restraint impacts as directional, not additive. The impact forecasts reflect baseline growth, mix effects, and variable interactions.
Segment Analysis
By Foam Type: Commercial Pressure Shrinks AFFF Supremacy
AFFF maintained 41.55% of the Firefighting Foam market share in 2025, yet its grip weakened under growing regulatory bans and liability costs. Replacement cycles tightened as European airports eliminated AFFF procurement from January 2026, and Australia barred PFAS foams from new airfield projects. Meanwhile, other foam types posted a 6.31% CAGR, the fastest among foam types, as second-generation products such as SOLBERG RE-HEALING RF6 matched ICAO Level B benchmarks.
End-users now segment procurement. Military, aviation, and petrochemical operators still draw on AFFF inventories for mission-critical functions that require vapor-sealing films, but warehousing, data centers, and mining move decisively toward fluorine-free alternatives that leave minimal residue. Protein foams retain niche demand for tank-farm protection where fuel-shedding properties outweigh environmental concerns. Manufacturers are balancing their strategies: they maintain AFFF production lines for aftermarket refills, yet channel their research and development budget towards developing fluorine-free portfolios.


By Fluorine Content: Momentum Shifts to Zero-PFAS Chemistries
PFAS-containing formulations still represented 54.79% of 2025 global sales, but the fluorine-free segment is projected to outgrow the broader Firefighting Foam market at a 6.61% CAGR through 2031. Europe's decision to phase out PFAS foams by 2028 has reduced historic demand. Meanwhile, a 2025 policy shift by the Federal Aviation Administration prompted U.S. airports to exclusively seek contracts for fluorine-free concentrates. Certifications are now being awarded at a quicker pace: Angus Fire's TRIDOL F3 achieved ICAO Level C in September 2025, bridging a vital performance gap for fire scenarios involving wide-body aircraft.
When considering disposal, cleanup, and litigation costs, the economic advantage leans towards zero-PFAS alternatives. However, hurdles remain. The higher viscosity of these alternatives demands upgrades to piping systems, and their sensitivity to water hardness necessitates investments in filtration. Supply constraints are significant; lead times have surged, delaying retrofits at U.S. naval air stations and in European petrochemical hubs.
By End-User Industry: Energy Complex Drives Volume, Mining Fuels Outperformance
Oil and gas installations contributed 47.05% of 2025 revenues, reflecting stringent NFPA 11 and API 2510 requirements at refineries, offshore platforms, and LNG terminals. Mining demand is expanding fastest at a 6.45% CAGR as lithium and rare-earth extraction projects in Australia, Chile, and the Democratic Republic of Congo adopt foam-water spray systems for battery-storage areas.
Thanks to aviation retrofits and the establishment of LNG bunkering infrastructure, the transportation sector maintained a steady volume. Meanwhile, chemical and petrochemical facilities shifted their focus towards alcohol-resistant foams. Warehousing and logistics centers, categorized under "other industries," experienced growth, driven by code updates mandating foam systems in high-rack automated facilities. A pilot conversion at ExxonMobil's Beaumont refinery in Texas underscores the rigorous validation standards that deter oil majors from widespread deployment until they confirm compatibility and obtain underwriter approval.
Geography Analysis
North America retained 38.71% of 2025 revenue, anchored by a dense petrochemical corridor and the largest installed AFFF base worldwide. The U.S. military alone holds thousands of legacy systems slated for replacement, but supply shortages and compatibility tests push completion into 2027. Canada is catching up following Transport Canada’s interim guidance that permits fluorine-free foams at airports subject to risk assessment, whereas Mexico remains constrained by budget and continues to rely on existing AFFF stockpiles.
Asia-Pacific is forecast to expand at a 6.04% CAGR and overtake Europe in absolute growth by 2030. China commands nearly half the regional Firefighting Foam market size, supported by rapid LNG import-terminal construction and coal-chemical investments that require fixed-foam protection. India's new safety code targets LNG facilities exceeding 50,000 m³ and accelerates procurement across planned terminals. Meanwhile, Japan and South Korea, driven by hydrogen-economy legislation, are transitioning to fluorine-free products, mandating foam suppression at production and dispensing sites.
Europe is at the forefront of policy innovation. Starting January 2026, Germany and the Netherlands will prohibit PFAS foams at civilian airports, while Nordic countries mandated zero-PFAS agents in all public facilities by 2025. This early adoption gives regional suppliers an edge to boost exports as other regions align with European standards. Upgrade cycles are also lifting demand in South America and the Middle East and Africa, supported by Brazilian ethanol terminals and hydrogen initiatives from Saudi Aramco.

Competitive Landscape
The firefighting foam market is moderately consolidated. Perimeter Solutions invested USD 65 million to certify its RE-HEALING RF6 line, landing contracts at Frankfurt and Heathrow airports once European regulators approved fluorine-free alternatives. Johnson Controls has leveraged global distribution and bundling capacity, offering integrated foam, proportioning equipment, and maintenance packages attractive to mega-warehouse developers. Patent filings hit a record in 2025, focused on bio-based surfactants and low-temperature stabilization, revealing how research and development budgets continue to migrate away from PFAS chemistries. Niche specialists capitalize on application expertise, winning contracts in data centers and lithium mines that require residue-free properties absent in legacy AFFF.
Firefighting Foam Industry Leaders
Johnson Controls
Perimeter Solutions
Angus Fire
Dafo Fomtec AB
Sthamer
- *Disclaimer: Major Players sorted in no particular order

Recent Industry Developments
- April 2025: Perimeter Solutions unveiled its latest product, SOLBERG SPARTAN, at FDIC 2025. This innovative foam concentrate, boasting a 1% fluorine-free formulation, is engineered to empower firefighters in achieving complete fire suppression. The foam is effective against various fire scenarios, including structure, wildland, vehicle, gasoline, and dumpster blazes.
- February 2025: Perimeter Solutions reported a 93.42% increase in fire safety sales, reaching USD 436.27 million in 2024. This growth highlights the rising demand for firefighting products, driving innovation and expanding their adoption across various applications.


Research Methodology Framework and Report Scope
Market Definitions and Key Coverage
Our study defines the global firefighting foam market as the revenue from fresh concentrate formulations (AFFF, AR-AFFF, protein, fluoroprotein, synthetic, and new fluorine-free blends) that producers supply for suppression and training across industrial, municipal, aviation, marine, and specialty settings. Values are captured at ex-factory pricing and converted to constant 2024 US dollars to remove inflation effects.
Scope Exclusion: Fire monitors, proportioning hardware, fixed-system engineering services, and on-site disposal costs sit outside the revenue pool.
Segmentation Overview
- By Foam Type
- Aqueous Film-Forming Foam (AFFF)
- Alcohol-Resistant (AR-AFFF)
- Synthetic/ Detergent Foam Concentrate
- Protein Foam Concentrate
- Other Foam Types (Fluorine-Free Synthetic (F3), etc.)
- By Fluorine Content
- PFAS-Containing
- Fluorine-Free
- By End-user Industry
- Oil and Gas
- Chemical and Petrochemical
- Mining
- Transportation
- Other End-User Industries (Military and Defense, Warehousing and Logistics, etc.)
- By Geography
- Asia-Pacific
- China
- India
- Japan
- South Korea
- ASEAN Countries
- Rest of Asia-Pacific
- North America
- United States
- Canada
- Mexico
- Europe
- Germany
- United Kingdom
- France
- Italy
- Spain
- NORDIC Countries
- Rest of Europe
- South America
- Brazil
- Argentina
- Rest of South America
- Middle-East and Africa
- Saudi Arabia
- South Africa
- Rest of Middle-East and Africa
- Asia-Pacific
Detailed Research Methodology and Data Validation
Primary Research
Mordor analysts interviewed seasoned fire chiefs, foam chemists, oil-and-gas HSE officers, and airport procurement leads across North America, Europe, the GCC, and Asia-Pacific. These discussions validated unit consumption per risk site, concentrate shelf life, and the practical pace of PFAS phase-outs, helping us refine model assumptions.
Desk Research
We begin with authoritative open data. Government fire-safety codes and recall records (NFPA, U.S. EPA Toxic Release Inventory), European Chemicals Agency PFAS restriction drafts, United Nations POPs review files, and International Energy Agency refinery counts establish demand footprints. Trade bodies such as the Fire Equipment Manufacturers' Association and Energy Institute provide shipment logs and incident statistics, while press and patent scans in Dow Jones Factiva and Questel highlight technology shifts.
Company filings pulled through D&B Hoovers, investor decks, customs summaries, and voluntary product-withdrawal notices sharpen regional mix and average selling price trends. The sources named are illustrative only; many additional publications informed data collection, validation, and contextual reads.
Market-Sizing & Forecasting
The top-down model scales concentrate demand from installed risk inventory such as the number of hydrocarbon storage tanks, active drilling rigs, certified airports, chemical plants, and naval vessels, multiplied by verified annual foam usage and replacement rates. Select bottom-up roll-ups of leading supplier revenues and sampled ASP × volume confirm totals. Key forecast drivers, including oil price outlook, mid-stream capital spending, airport construction pipelines, and legislated PFAS compliance deadlines, feed a multivariate regression that projects volumes, then values, through 2030.
Data Validation & Update Cycle
Outputs pass a two-stage analyst review where anomalies versus incident statistics, shipment data, and prior editions are flagged and, when needed, re-checked with respondents. Reports refresh every twelve months, with interim revisions triggered by material regulatory or pricing shocks.
Why Mordor's Firefighting Foam Baseline Is Dependable
Published estimates often diverge because firms choose different foam families, geographic mixes, currency years, and replacement assumptions. Mordor's disciplined scope alignment, annual refresh, and variable-driven modelling temper such swings.
Key gap drivers include bundling of firefighting hardware, exclusion of fluorine-free products, optimistic substitution curves, and inconsistent currency conversions.
Benchmark comparison
| Market Size | Anonymized source | Primary gap driver |
|---|---|---|
| USD 0.87 B (2025) | Mordor Intelligence | - |
| USD 1.05 B (2025) | Global Consultancy A | Bundles hardware and wetting agents with concentrates |
| USD 0.76 B (2021) | Industry Publisher B | Uses older base year and static uptake rates |
| USD 0.99 B (2024) | Trade Journal C | Omits fluorine-free formulations and applies regional ASP averages globally |
The comparison shows that Mordor delivers a balanced, transparent baseline grounded in traceable variables and repeatable steps, giving decision-makers a figure they can trust for planning and investment.


Key Questions Answered in the Report
How large is the Firefighting Foam market in monetary terms?
The Firefighting Foam market size is valued at USD 0.92 billion in 2026 and is forecast to reach USD 1.18 billion by 2031, registering a CAGR of 5.11% in this period.
What is driving the shift toward fluorine-free formulations?
Regulatory bans on PFAS, escalating liability costs, and improving performance parity are pushing asset owners toward certified fluorine-free foams.
Which end-user sector accounts for the highest demand?
Oil and gas operations lead, contributing 47.05% of 2025 revenue thanks to stringent fire-safety codes at refineries, LNG terminals, and tank farms.
Which region is expected to grow fastest by 2031?
Asia-Pacific is projected to post the strongest CAGR at 6.04% through 2031, propelled by LNG bunkering, hydrogen hubs, and mega-warehouse construction.
How are suppliers responding to changing regulations?
Market leaders are investing heavily in research and development and capacity for fluorine-free foams, pursuing UL and ICAO certifications, and forming regional production partnerships to shorten lead times.
What are the main cost barriers to AFFF replacement?
High disposal fees for legacy PFAS foams, system retrofits to handle higher-viscosity alternatives, and supply shortages of certified fluorine-free concentrates drive total transition costs upward.
Page last updated on:


