Fiberglass Pipes Market Size and Share
Market Overview
| Study Period | 2021 - 2031 |
|---|---|
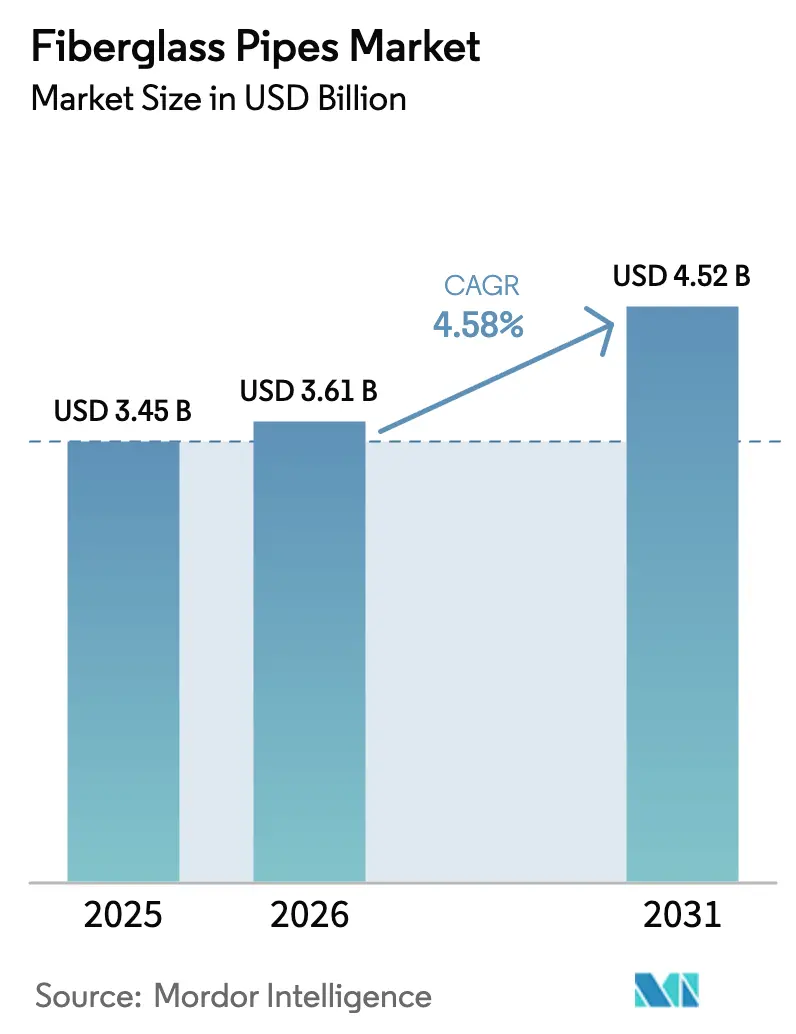
| Market Size (2026) | USD 3.61 Billion |
| Market Size (2031) | USD 4.52 Billion |
| Growth Rate (2025 - 2030) | 4.58% CAGR |
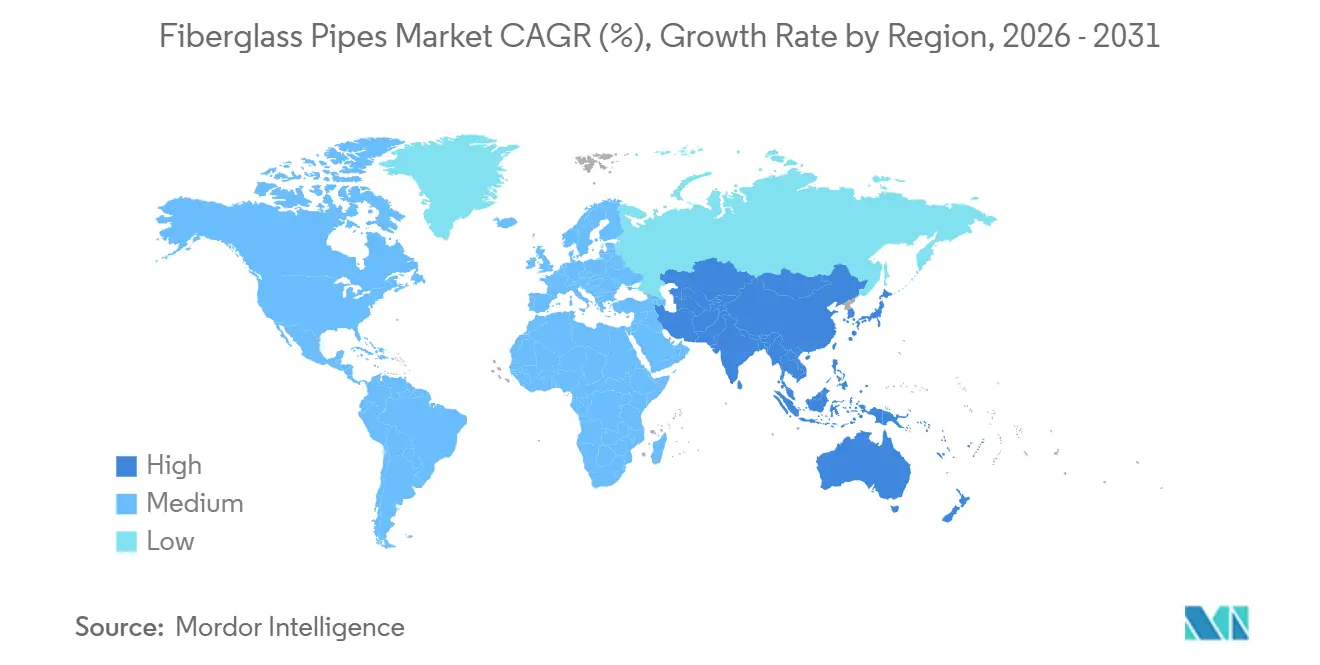
| Fastest Growing Market | Asia Pacific |
| Largest Market | Asia Pacific |
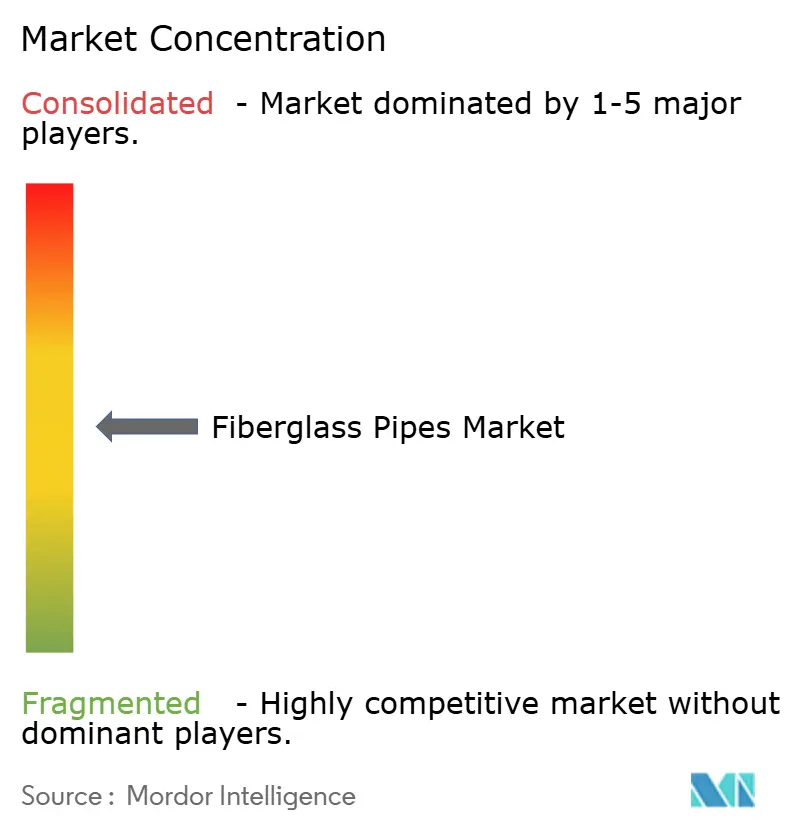
| Market Concentration | Medium |
Major Players *Disclaimer: Major Players sorted in no particular order Image © Mordor Intelligence. Reuse requires attribution under CC BY 4.0. | |
Fiberglass Pipes Market Analysis by Mordor Intelligence
The Fiberglass Pipes Market size is expected to grow from USD 3.45 billion in 2025 to USD 3.61 billion in 2026 and is forecast to reach USD 4.52 billion by 2031 at a 4.58% CAGR over 2026-2031. Operators are shifting away from steel and concrete toward composite solutions that cut corrosion losses, lower installation weight, and improve total cost of ownership. Regulatory mandates in water, wastewater, and hydrogen transport accelerate bid specifications that favor glass-fiber composites. Suppliers are pairing 150-year design-life warranties with embedded sensor packages to defend margins against low-cost Asian entrants. Raw-material cost swings and tightening recyclability rules temper growth but have not derailed the demand pipeline, given parallel investment cycles in desalination, municipal upgrades, and carbon-capture networks. Governments in Asia-Pacific and the Middle East allot substantial infrastructure budgets that convert pilot deployments into multi-kilometer contracts, thereby cementing volume visibility for fabricators.
Key Report Takeaways
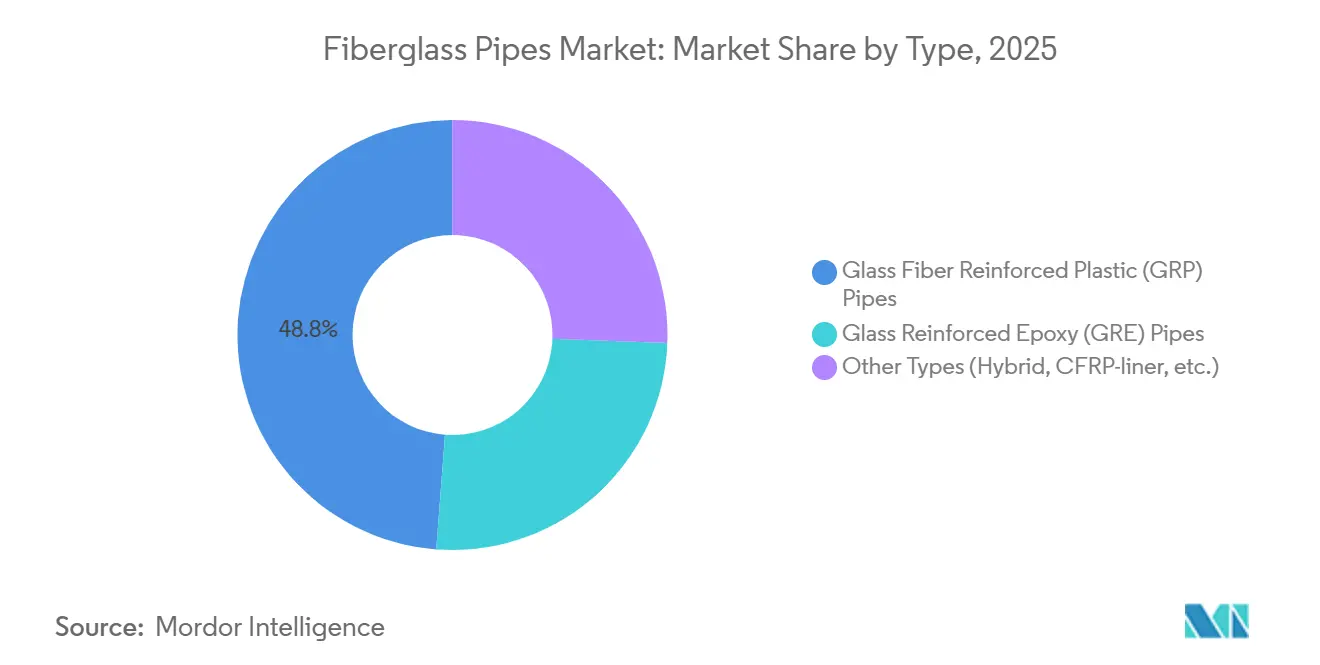
- In 2025, Glass Fiber Reinforced Plastic (GRP) accounted for 48.79% of the fiberglass pipes market share, establishing its dominance in the market. Glass Reinforced Epoxy (GRE) pipes are anticipated to grow at a compound annual growth rate (CAGR) of 4.82% during the forecast period, extending through 2031.
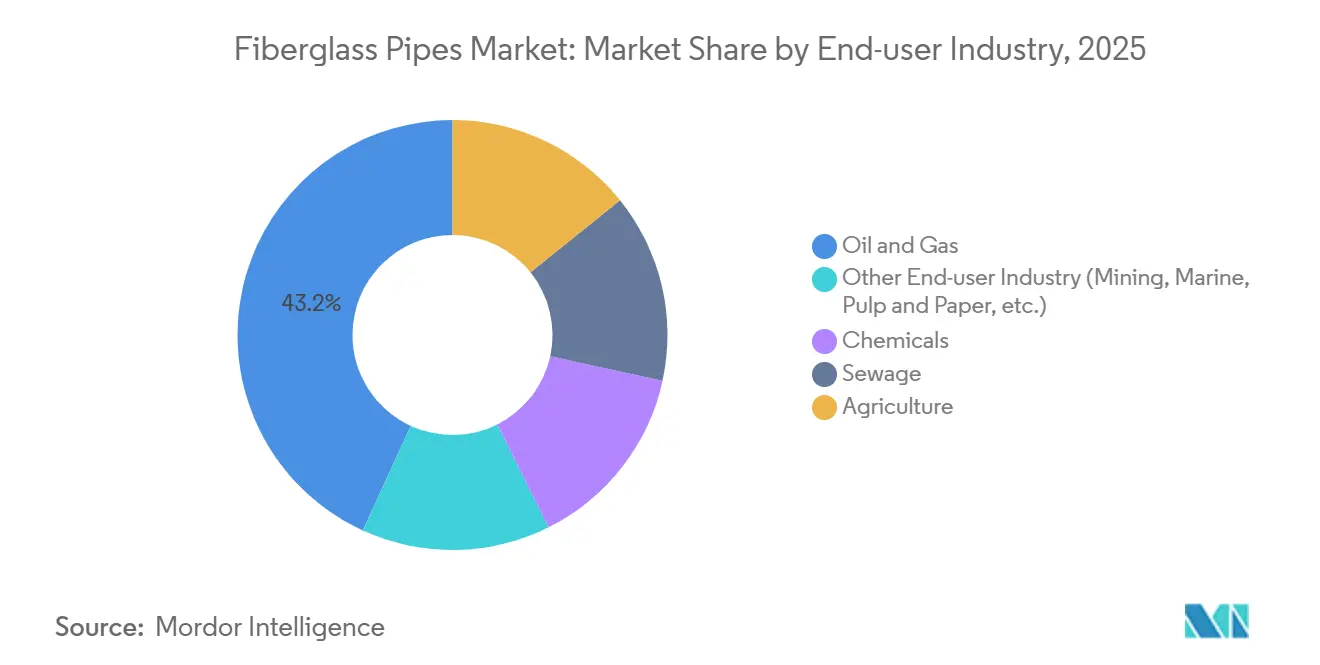
- The oil and gas sector represented 43.15% of the fiberglass pipes market size in 2025, making it a key end-user industry. Additionally, other industries, including mining, marine, and pulp-and-paper, are projected to expand at a CAGR of 4.97% by 2031.
- Asia-Pacific emerged as a leading region, contributing 44.42% of the revenue share in 2025. The region is expected to maintain steady growth with a 4.65% CAGR through 2031.
Note: Market size and forecast figures in this report are generated using Mordor Intelligence’s proprietary estimation framework, updated with the latest available data and insights as of January 2026.
Global Fiberglass Pipes Market Trends and Insights
.
Driver Impact Analysis*
| Drivers | (~) % Impact on CAGR Forecast | Geographic Relevance | Impact Timeline |
|---|---|---|---|
| Increasing installation of oil and gas pipelines | +1.2% | Middle East, North America, Asia-Pacific | Medium term (2-4 years) |
| Water- and wastewater-infrastructure replacement programs | +1.5% | Asia-Pacific, North America, Europe | Long term (≥4 years) |
| Rising demand in chemical processing industry | +0.8% | Asia-Pacific core, spill-over to North America and Europe | Medium term (2-4 years) |
| Surge in large-diameter desalination projects | +0.9% | Middle East, North Africa, Australia | Short term (≤2 years) |
| Hydrogen-transport and CCUS pilot networks supporting fiberglass pipes demand | +0.6% | National, with early gains in United States, Canada, and select EU member states | Long term (≥4 years) |
| Source: Mordor Intelligence | |||
Increasing Installation of Oil and Gas Pipelines
National oil companies are scaling non-metallic pipe programs to cut sour-service downtime and cathodic-protection spend. Saudi Aramco’s Master Gas System phase three adds 4,000 kilometers of composite flowlines, marking the world’s largest single-country adoption of fiberglass standards. Colorado regulators require API 15S-compliant pipes on new gathering lines, triggering replacement of legacy steel assets. Strohm’s 33-kilometer thermoplastic composite pipe order for Aramco’s Fadhili gas expansion underscores material convergence across onshore and offshore fields[1]“Strohm Wins 33 km TCP Contract for Fadhili Gas,” Strohm, strohm.eu. API and CSA codes provide the harmonized framework that de-risks operator qualification cycles and accelerates volume uptake. As new wells trend toward higher H₂S and CO₂ levels, fatigue-resistant GRE grades capture incremental share within the fiberglass pipes market.
Water- and Wastewater-Infrastructure Replacement Programs
Consent decrees and urban expansion fast-track composite adoption in municipal networks. San Antonio Water System awarded USD 26.5 million in 2024 to install six miles of fiberglass pipe under an Environmental Protection Agency order, signaling a shift from clay and concrete toward corrosion-immune systems. India’s CPHEEO Manual codifies GRP across DN 200-3000 ranges, effectively embedding fiberglass in every state-funded water tender[2]“CPHEEO Manual on Water Supply and Treatment,” Ministry of Housing and Urban Affairs, mohua.gov.in. China’s trenchless jacking projects in Zhongxian, Linhai, and Guangzhou illustrate how GRP minimizes surface disruption in dense urban corridors. These programs expand the fiberglass pipes market by tying compliance deadlines to rapid installation metrics, a combination where light-weight composites excel.
Rising Demand in Chemical Processing Industry
Chlor-alkali, fertilizer, and pulp-and-paper facilities replace PTFE-lined steel with dual-laminate FRP to reduce flange maintenance and unplanned shutdowns. Ashland’s Derakane epoxy vinyl ester resins improve solvent resistance at service temperatures up to 135 °C. NOV Fiber Glass Systems markets fluoropolymer-lined pipes that extend service life beyond 20 years in aggressive pH and thermal cycles. Korean fabricator HLB ENG supplies GRE pipes rated to 25 bar for marine installations, winning share via eight-week lead times that outpace European vendors. ASME Section X certification underpins buyer confidence, enabling the fiberglass pipes market to penetrate specialty chemical segments that demand verifiable pressure-cycle data.
Surge in Large-Diameter Desalination Projects
Middle Eastern mega-plants elevate demand for DN 2000-plus GRP conveyance lines. VA Tech Wabag’s Yanbu 5 facility in Saudi Arabia selected fiberglass intake and brine pipes to counter chloride-induced pitting that plagues duplex stainless steel. Group Five Pipe secured a USD 800 million contract with the Saline Water Conversion Corporation, locking in five-year production visibility. Australia’s Alkimos expansion evaluates GRP to meet state-level embodied-carbon rules while managing coastal corrosion risks. ISO 14692 standards streamline stress analysis, letting engineers specify thinner walls without compromising burst safety factors, thereby widening the fiberglass pipes market addressable scope.
Restraint Impact Analysis*
| Restraints | (~) % Impact on CAGR Forecast | Geographic Relevance | Impact Timeline |
|---|---|---|---|
| Raw-material (resin and glass) price volatility | -0.7% | Global, acute in import-dependent Europe and Southeast Asia | Short term (≤2 years) |
| Limited recyclability and looming regulation risk | -0.5% | Europe, North America, select Asia-Pacific markets | Medium term (2-4 years) |
| Shortage of certified composite-pipe installers | -0.4% | North America (US, Canada) and Middle East (Saudi Arabia, UAE), with spillover to emerging markets | Medium term (2-4 years) |
| Source: Mordor Intelligence | |||
Raw-material (resin and glass) Price Volatility
Epoxy and polyester resin prices track crude-derived feedstocks, and supply shocks can reverse cost deflation within a single quarter. Glass-fiber furnaces consume large volumes of natural gas, exposing European producers to TTF price swings that topped 40% volatility in early 2025. Specialty epoxy grades command 25-35% premiums over commodity polyester, curbing uptake in budget-constrained water projects. Smaller Southeast Asian fabricators lack hedging tools, so currency fluctuations amplify landed-cost uncertainty and squeeze margins. Persistent volatility leads EPC contractors to include price-adjustment clauses, slightly elongating bid cycles for fiberglass pipes market projects.
Limited Recyclability and Looming Regulation Risk
The European Union amended the End-of-Life Vehicles Directive in 2024, imposing composite recyclability thresholds by 2030 that current pyrolysis and solvolysis plants cannot meet economically. A Nature Materials study reports fiber tensile strength degradation of up to 30% after mechanical recycling, rendering reclaimed fibers unsuitable for pressure pipe reuse. California’s extended producer responsibility laws assign disposal costs to manufacturers, effectively internalizing environmental externalities. Amiblu’s carbon-neutral plant in Tarragona showcases scope 1 and 2 progress, yet scope 3 recyclability remains unresolved. This regulatory overhang restrains expansion in automotive and adjacent sectors of the fiberglass pipes market.
*Our forecasts treat driver/restraint impacts as directional, not additive. The impact forecasts reflect baseline growth, mix effects, and variable interactions.
Segment Analysis
By Type: GRP Dominates, GRE Accelerates in High-Pressure Service
GRP commanded 48.79% fiberglass pipes market share in 2025, reflecting its cost leadership in municipal, irrigation, and low-pressure oil gathering lines. GRE pipes, though smaller in absolute shipments, are advancing at a 4.82% CAGR through 2031 as offshore platforms and chemical plants require higher temperature and pressure ratings. Operators accept GRE’s 25–35% price premium because epoxy matrices offer fatigue resistance under multi-axial stress and cyclic loading. HOBAS scaled capacity by 50% in 2024, launching a second U.S. line that produces 12- to 118-inch diameters with 150-year design-life warranties, an advantage that mitigates life-cycle cost discussions during municipal tenders. Deepwater fields in West Africa and the Gulf of Mexico specify epoxy grades to avoid hydrogen-induced blistering, thus lifting demand for GRE within the fiberglass pipes market.
New hybrid architectures combine carbon-fiber pressure armor with thermoplastic liners to handle ultra-deepwater tension loads that exceed 3,000 meters. Although still niche, these designs demonstrate the material innovation curve that keeps composites ahead of metallic counterparts suffering embrittlement in hydrogen service. API 15S and ISO 14692 revisions incorporate higher design factors for composite joints, reducing uncertainty allowances and trimming wall-thickness budgets. Continuous winding processes lower per-meter resin utilization and shorten cure cycles, allowing fabricators to pass efficiency gains to buyers without eroding margins. Consequently, volume growth in GRE and hybrids outpaces GRP, reshaping the product-mix outlook inside the fiberglass pipes market.


By End-User Industry: Non-Energy Segments Lead Growth Curve
Oil and gas remained the single-largest buyer with 43.15% demand in 2025, yet diversification is underway. Other end-user industries including mining, marine, and pulp-and-paper will expand at a 4.97% CAGR. NOV’s Ceram Core slurry lines withstand 240 bar pressure and abrasive tailings, enabling Chilean copper mines to extend pipeline life beyond 20 years. Dual-laminate FRP with PVDF liners cut flange-maintenance intervals in chlor-alkali plants from annual cycles to five-year windows, saving operators up to USD 2 million per turnaround. Sewage upgrades in Nagpur and Guangzhou specify GRP to resist hydrogen sulfide attack, driving municipal share gains outside traditional energy verticals.
Agriculture, although smaller, adopts GRP center-pivot irrigation lines to reduce pump energy by 20% compared with steel. Flowtite’s continuous-mandrel process delivers leak-tight joints that meet 32-bar ratings, catering to large Saudi and Argentine farms seeking water-use efficiency. Global pulp-and-paper mills replace carbon-steel condensate return lines with GRE to withstand mixed-phase corrosion, showcasing broader industrialization of composite piping. Compounded by tightening regulations on wastewater discharge, these factors collectively lift non-energy verticals’ share in the fiberglass pipes market.
Geography Analysis
Asia-Pacific owns 44.42% revenue share in 2025 and is forecast to maintain a 4.65% CAGR through 2031 as China, India, and Saudi Arabia modernize fluid-transfer grids. China’s trenchless jacking projects adopt DN 250-2000 GRP pipes to minimize urban disruption, while Zhejiang-based fabricators supply 50-year-rated pump stations that reinforce reliability narratives. India’s CPHEEO guidelines anchor GRP specifications in every centrally funded water program, reinforcing pipeline bid uniformity. Saudi Arabia’s USD 800 million Group Five Pipe contract and Strohm’s composite flowline delivery integrate fiberglass across desalination and hydrocarbon systems. These concurrent capital programs cement Asia-Pacific as the growth engine for the fiberglass pipes market.
North America rides regulatory upgrades tied to API and CSA standards. San Antonio’s consent-decree project and Colorado’s flowline mandates demonstrate how legal compliance converts to immediate purchase orders. The U.S. Department of Energy’s Hydrogen Shot pilots double-wall FRP pipes that blend hydrogen and CO₂ transport, spotlighting composites as the default for distributed energy grids. HOBAS’s new U.S. line and Amiblu’s capacity in Spain funnel extra supply toward North American tenders, shortening lead times and edging out imports. Collectively these initiatives equip the region with a stable 4.2% CAGR, second only to Asia-Pacific in the fiberglass pipes market.
Europe focuses on water resilience and decarbonization. EIB financed EUR 500 million for SUEZ projects that evaluate trenchless GRP in historic urban centers. The United Kingdom earmarked GBP 8 billion for reservoirs, transfers, and desalination between 2025–2030, opening new demand for DN 3000 pipes rated at 32 bar. Amiblu’s Tarragona plant achieves 72% CO₂ reduction through onsite solar, aligning with procurement rules that favor low-embodied-carbon materials.
South America and Middle East and Africa trail in absolute spending but display pockets of high growth where donor agencies and national oil companies underwrite composite infrastructure, providing optional upside to the fiberglass pipes market.

Competitive Landscape
The fiberglass pipes market features moderate fragmentation. Regional challengers in China and India undercut incumbents by up to 25% on ex-factory pricing, yet quality audits tied to ISO 14692 and API 15S limit their access to large international tenders. Fabricators pursue mergers and acquisitions to secure resin supply and amortize automated filament-winding lines, compressing cost curves for the mid-tier. Market exits among undercapitalized players continue, especially in Europe, where recyclability regulations elevate compliance spending. The net effect nudges concentration upward, though the fiberglass pipes market remains far from oligopolistic.
Innovation pipelines pivot toward hydrogen transport and carbon-capture networks. The U.S. Department of Energy’s USD 2 million prize to NOV and H2C validates double-wall FRP designs with integrated leak detection, a configuration likely to become the default in low-molecular-weight gas service.
Fiberglass Pipes Industry Leaders
Future Pipe Industries
NOV
Amiantit Company
Amiblu Holding GmbH
Hengrun Group Co., Ltd.
- *Disclaimer: Major Players sorted in no particular order

Recent Industry Developments
- January 2025: Amiblu invested EUR 4.16 million to add a second line at its Tarragona, Spain plant, boosting capacity to 300 kilometers per year and achieving 72% CO₂ reduction through 2,000 solar panels that supply 51% renewable energy.
- October 2024: HOBAS commissioned a new manufacturing line that brings North American capacity to 12-inch-118-inch FRPM pipes supporting 150-year service life.
- April 2024: HOBAS announced a 50% capacity expansion to meet rising municipal demand for corrosion-immune water and wastewater pipes in the United States.


Global Fiberglass Pipes Market Report Scope
Fiberglass pipes are manufactured by filament winding process or contact molding process. The fiberglass pipes are composite pipes that offer resistance against corrosive environments, hydrocarbons, and chemicals.
The fiberglass pipes market is segmented into type, end-user industry, and geography. Based on type, the market is segmented into glass fiber-reinforced plastic (GRP) pipes, glass-reinforced epoxy (GRE) pipes, and others (Hybrid, CFRP-liner, etc.). Based on the end-user industry, the market is segmented into oil & gas, chemicals, sewage, agriculture, and others (Mining, Marine, Pulp and Paper, etc.). The report also covers the market size and forecasts for fiberglass pipes in 16 major countries across the regions. Each segment's market sizing and forecasts are based on value (USD).
| Glass Fiber Reinforced Plastic (GRP) Pipes |
| Glass Reinforced Epoxy (GRE) Pipes |
| Other Types (Hybrid, CFRP-liner, etc.) |
| Oil and Gas |
| Chemicals |
| Sewage |
| Agriculture |
| Other End-user Industry (Mining, Marine, Pulp and Paper, etc.) |
| Asia-Pacific | China |
| India | |
| Japan | |
| South Korea | |
| ASEAN Countries | |
| Rest of Asia-Pacific | |
| North America | United States |
| Canada | |
| Mexico | |
| Europe | Germany |
| United Kingdom | |
| Italy | |
| France | |
| Spain | |
| NORDIC Countries | |
| Rest of Europe | |
| South America | Brazil |
| Argentina | |
| Rest of South America | |
| Middle East and Africa | Saudi Arabia |
| South Africa | |
| Rest of Middle-East and Africa |
| By Type | Glass Fiber Reinforced Plastic (GRP) Pipes | |
| Glass Reinforced Epoxy (GRE) Pipes | ||
| Other Types (Hybrid, CFRP-liner, etc.) | ||
| By End-user Industry | Oil and Gas | |
| Chemicals | ||
| Sewage | ||
| Agriculture | ||
| Other End-user Industry (Mining, Marine, Pulp and Paper, etc.) | ||
| By Geography | Asia-Pacific | China |
| India | ||
| Japan | ||
| South Korea | ||
| ASEAN Countries | ||
| Rest of Asia-Pacific | ||
| North America | United States | |
| Canada | ||
| Mexico | ||
| Europe | Germany | |
| United Kingdom | ||
| Italy | ||
| France | ||
| Spain | ||
| NORDIC Countries | ||
| Rest of Europe | ||
| South America | Brazil | |
| Argentina | ||
| Rest of South America | ||
| Middle East and Africa | Saudi Arabia | |
| South Africa | ||
| Rest of Middle-East and Africa | ||


Key Questions Answered in the Report
What is the current value of the fiberglass pipes market?
The global fiberglass pipes market is valued at USD 3.61 billion in 2026 with a forecast value of USD 4.52 billion by 2031.
Which segment shows the fastest growth through 2031?
Mining, marine, and pulp-and-paper applications are projected to grow at a 4.97% CAGR, outpacing traditional oil-and-gas demand.
Why are GRE pipes gaining share in offshore projects?
GRE’s higher temperature and pressure tolerance makes it suitable for deepwater fields where epoxy’s fatigue resistance justifies its premium price.
How are regulations influencing market adoption?
API, ISO, and CSA standards mandate composite specifications, accelerating replacement of legacy steel systems in water and energy infrastructure.
Which region holds the largest revenue share?
Asia-Pacific leads with 44.42% share in 2025 and maintains robust growth driven by municipal water, desalination, and hydrocarbon investments.
What technological trends shape competitive advantage?
Embedded sensors for leak detection, carbon-neutral manufacturing, and thermoplastic composite pipe innovations distinguish leading vendors.
Page last updated on:


