
Market Overview
| Study Period | 2021 - 2031 |
|---|---|
| Forecast Data Period | 2026 - 2031 |
| Base Year Market Size (2025) | 1.29 gigawatt |
| Market Volume (2026) | 1.62 gigawatt |
| Market Volume (2031) | 5.02 gigawatt |
| Growth Rate (2026 - 2031) | 25.42 % |
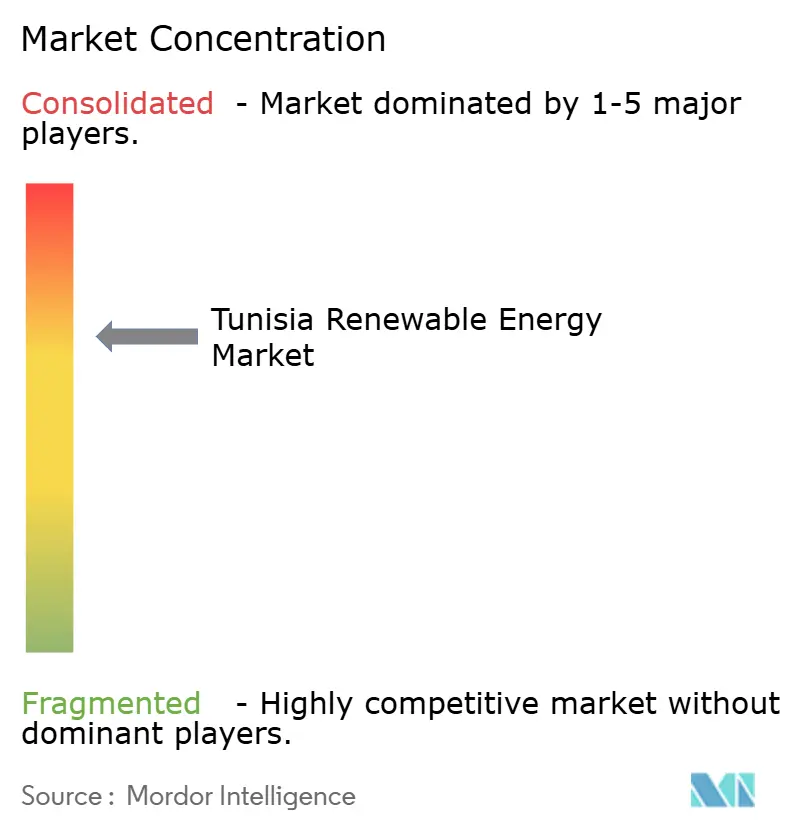
| Market Concentration | Medium |
Major Players *Disclaimer: Major Players sorted in no particular order Image © Mordor Intelligence. Reuse requires attribution under CC BY 4.0. | |
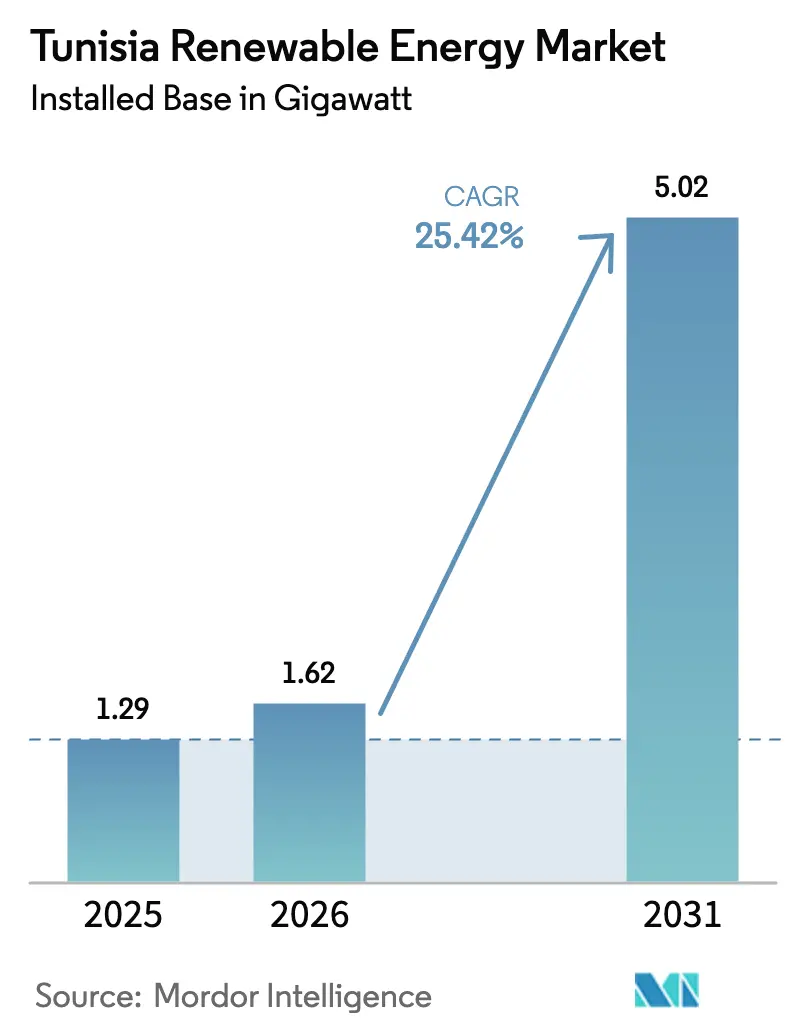
Tunisia Renewable Energy Market Analysis by Mordor Intelligence
Tunisia Renewable Energy Market size in 2026 is estimated at 1.62 gigawatt, growing from 2025 value of 1.29 gigawatt with 2031 projections showing 5.02 gigawatt, growing at 25.42% CAGR over 2026-2031.
Utility-scale auctions are lined up through 2026, along with new incentives for hybrid solar-plus-storage plants, which underpin capacity additions and attract global developers such as Scatec, TotalEnergies, and Chinese engineering consortiums.(1) The policy goal of 30% renewable penetration by 2030 is supported by Law No. 2015-12, which simplified permitting and invited private capital, while multilateral lenders finance grid upgrades that will unlock export opportunities through the 600 MW ELMED interconnector to Italy. Technology choice remains led by solar PV, yet concentrated solar power (CSP) is scaling rapidly because its thermal storage pairs well with Tunisia’s ambition to supply green hydrogen to Europe via the proposed SoutH2 Corridor (totalenergies.com). Rooftop systems for factories and commercial buildings are gaining momentum under dedicated World Bank credit lines, signaling a broader democratization of clean-energy access across the country’s industrial hubs.
Key Report Takeaways
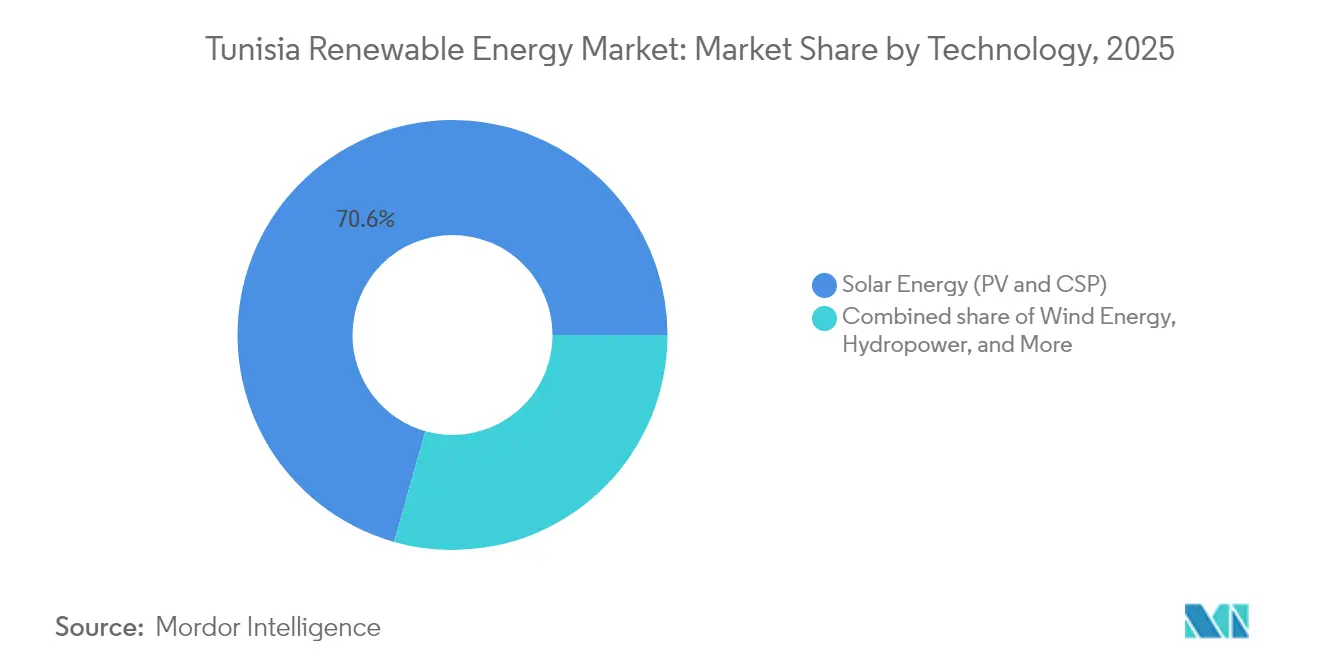
- By technology, solar energy commanded 70.62% share of the Tunisia renewable energy market size in 2025, while onshore wind is projected to post the fastest 34.76% CAGR through 2031.
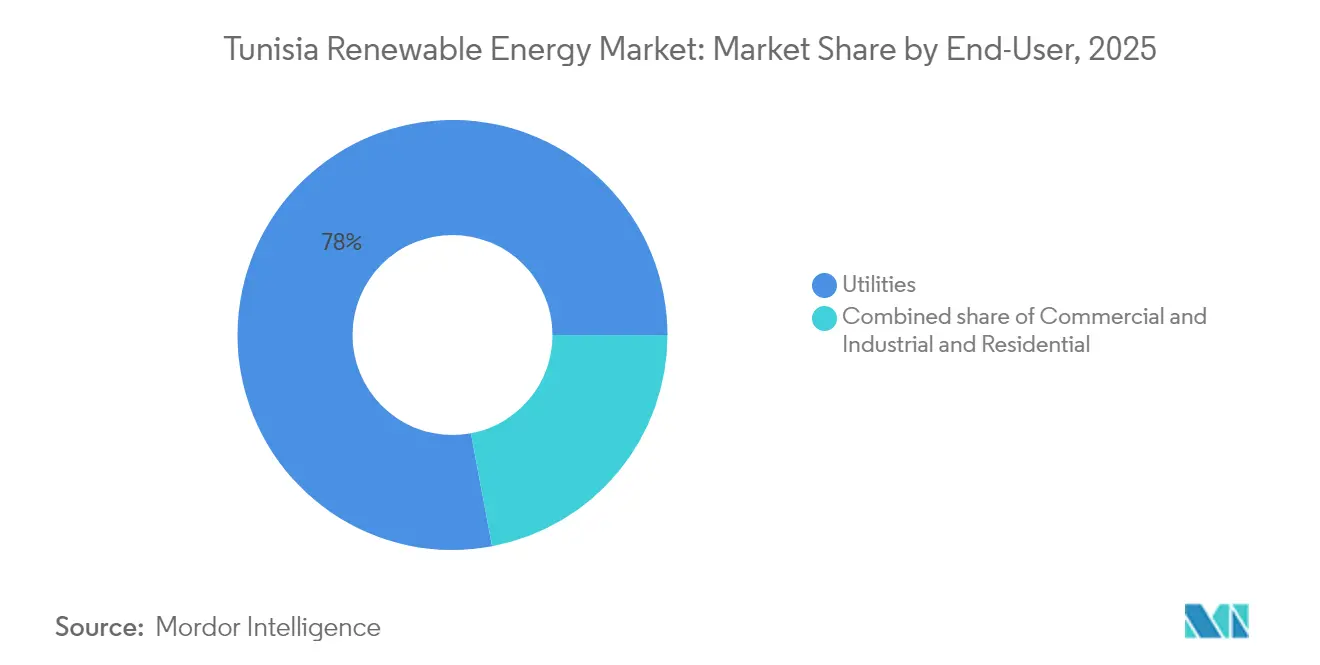
- By end-user, utilities held 77.95% of the Tunisia renewable energy market share in 2025, whereas the commercial-industrial segment is forecast to expand at a 27.14% CAGR thanks to liberalized self-consumption rules.
Note: Market size and forecast figures in this report are generated using Mordor Intelligence’s proprietary estimation framework, updated with the latest available data and insights as of 2026.
Market Trends and Insights
Drivers Impact Analysis of Tunisia Renewable Energy Market*
| Driver | (~) % Impact on CAGR Forecast | Geographic Relevance | Impact Timeline |
|---|---|---|---|
| Utility-scale solar PV auction roll-outs 2024–2026 | 8.50% | Sidi Bouzid, Gafsa, Tataouine, Kairouan | Short term (≤ 2 years) |
| Lower LCOE for hybrid PV + storage plants | 4.20% | Coastal industrial zones | Medium term (2-4 years) |
| EU–Africa HVDC interconnection incentives | 3.80% | Cap Bon to Sicily export corridor | Medium term (2-4 years) |
| Green-hydrogen export memoranda | 5.10% | Gabès, Kébili, Tozeur | Long term (≥ 4 years) |
| World Bank DER finance for C&I rooftops | 2.90% | Greater Tunis and coastal belts | Short term (≤ 2 years) |
| Agrivoltaic water-saving pilots | 1.30% | Interior governorates | Long term (≥ 4 years) |
| Source: Mordor Intelligence | |||
Utility-scale Solar PV Auction Roll-outs 2024-2026
Systematic auctions covering 1,700 MW of new capacity guarantee 20- to 30-year PPAs with sovereign backing, enabling projects such as Qair’s 298 MW plant and Voltalia’s 130 MW facility in Gafsa at tariffs below USD 0.04/kWh.(2) Annual output from awarded capacity is expected to reach 1,000 GWh, avoiding 250,000 t of natural-gas consumption worth USD 125 million and placing the Tunisia renewable energy market on a firm near-term growth path.(3) Irradiation surpassing 2,000 kWh/m² in Tozeur and Sidi Bouzid drives capacity factors close to 25%, yet evacuation hinges on transmission upgrades co-financed by the EUR 113 million Siemens-led smart-grid program.
Lower LCOE for Hybrid (PV + Storage) Plants
Hybrid solar-plus-storage systems now operate at levelized costs below USD 0.06/kWh in high-resource areas, making them cheaper than gas-fired peaking turbines while supplying evening demand peaks. Lithium-ion battery prices declined by roughly 15% in 2024, and developers embed 2- to 4-hour storage to lift capacity factors above 40% and capture premium dispatch payments. Industrial estates around Tunis, Sfax, and Gabès have adopted the model to secure predictable electricity costs, spurring a secondary market for behind-the-meter energy management services.
EU-Africa HVDC Interconnection Incentives
The 600 MW ELMED submarine link, backed by EUR 268 million in concessional financing, will establish a physical export route to Europe and alter domestic merit-order dynamics. Once operational, Tunisian generators can tap higher Northern-Mediterranean wholesale prices, improving returns on large-scale solar and wind farms and reinforcing investor appetite for the Tunisia renewable energy market.
Green-hydrogen Export MoUs with EU Utilities
MoUs between ACWA Power, TotalEnergies, and European offtakers target 600,000 t of green hydrogen per year in the first phases, implying up to 12 GW of new renewable capacity dedicated to electrolysis by 2035. CSP plants with molten-salt storage gain preference because they deliver round-the-clock electricity to electrolyzers, reinforcing technology diversification.
Restraints Impact Analysis of Tunisia Renewable Energy Market*
| Restraint | (~) % Impact on CAGR Forecast | Geographic Relevance | Impact Timeline |
|---|---|---|---|
| Fiscal stress at state utility STEG | –3.7% | Nationwide | Short term (≤ 2 years) |
| Grid congestion in coastal governorates | –2.4% | Tunis, Sfax, Sousse, Bizerte | Medium term (2-4 years) |
| Land-bank bottlenecks for onshore wind | –1.8% | Bizerte, Tataouine, Sidi Bouzid | Medium term (2-4 years) |
| Sovereign-risk premium on IPP financing | –4.1% | Nationwide | Long term (≥ 4 years) |
| Source: Mordor Intelligence | |||
Fiscal Stress at State Utility STEG
STEG’s debt reached TND 4 billion (≈ approximately USD 1.32 billion) in 2024, driving deferred grid upgrades and raising doubts about the bankability of the PPA. Subsidies consumed 5.3% of GDP in 2022, and multilateral guarantees, such as MIGA’s USD 23.5 million cover for the 120 MW Kairouan plant, have become essential. Recapitalization or subsidy reform is needed to restore credit and lower WACC.
Grid Congestion in Coastal Governorates
With 70% of demand on the coast and the best resources inland, transmission shortfalls hinder the commissioning of projects. Studies show that integrating 20% variable renewables requires a 5-8% increase in reserve capacity, yet STEG’s roadmap remains unfunded. Developers increasingly accept lower-irradiance sites near existing substations to sidestep delays, shaving IRRs by up to 100 basis points.
*Our forecasts treat driver/restraint impacts as directional, not additive. The impact forecasts reflect baseline growth, mix effects, and variable interactions.
Tunisia Renewable Energy Market Segment Analysis
By Technology:
Solar Dominance Meets Wind AccelerationSolar held 70.62% of the Tunisia renewable energy market in 2025, anchored by auctions that delivered the lowest tariff globally at 2.9 euro cents per kWh. Utility-scale wins totaling 498 MW in January 2025 keep solar's pipeline robust, and the Tunisia renewable energy market size for solar is forecast to exceed 3.4 GW by 2031. Yet wind's 34.76% CAGR will lift its share from 29.38% to nearly 36%, propelled by 600 MW of tenders and a 75 MW Chenini farm breaking ground in 2025. Floating offshore feasibility studies in the Gulf of Gabès hint at a future diversification path.
Solar's mature developer ecosystem, including Scatec, Voltalia, and Qair, benefits from pre-cleared land, rapid permitting, and proven O&M track records, while TuNur's 4.5 GW CSP export concept remains stalled due to the lack of Italian offtake. Wind advances face land-use complexity; yet, an eventual fast-track permitting regime could cut lead times by a year and support Tunisia's gains in renewable energy market share for wind equipment suppliers. Hybrid PV-plus-storage projects, now in the design stage, will enhance capacity factors and grid stability, reinforcing solar's lead while enabling wind to supply round-the-clock blends that appeal to future hydrogen electrolyzers.

By End-User:
Utility Dominance With C&I and Residential ScalingUtilities controlled 77.95% of installations in 2025 and are projected to sustain a 26.37% CAGR, reflecting STEG’s central dispatch and 20-25 year PPAs that lock in risk-adjusted returns for IPPs. The Tunisian renewable energy market size attributable to utilities could reach 3.9 GW by 2031, as the 1,700 MW December 2024 program is implemented. The C&I segment has 381 MW authorized but only 30 MW commissioned, a gap that TEREG aims to narrow by offering ten-year credit at 5-6% interest, thereby lifting IRRs and accelerating rooftop adoption. Large cement and phosphate processors are installing captive plants to buffer tariff hikes and curtailment risk.
Residential growth stems from the PROSOL Elec scheme, which financed 315 MW across 90,000 homes and secured TND 370 million (≈ approximately USD 121 million) for rebates in 2024-2026. New low-income pilots in Tozeur will showcase agrivoltaic-linked rural electrification. If net-metering credits fall below retail tariffs, middle-income adoption could slow, underscoring the need for a clear, long-term tariff policy to maintain the momentum in the residential renewable energy market share in Tunisia.
Geography Analysis
Southern governorates, such as Gafsa, Tozeur, and Sidi Bouzid, already account for more than 55% of operational solar capacity, taking advantage of DNI levels above 2,000 kWh/m² and land prices that are one-third of those in coastal zones. Voltalia’s 130 MW Gafsa plant and Scatec’s 120 MW Tozeur facility typify the region’s large-scale profile, but both depend on 400 kV lines that route power northwards, underscoring the transmission imperative.
In the north, Sidi Daoud’s 53.6 MW wind farm achieves capacity factors exceeding 25% and supplies power directly into the Tunis bulk supply point; however, terrain limitations curb further expansion. Offshore wind prospects in the Gulf of Hammamet remain exploratory, pending bathymetry studies and clarity on offtake. Central zones, such as Kairouan and Kasserine, are emerging as second-tier solar hubs. China Energy Engineering Group began constructing a 100 MW plant in Kairouan in 2024, highlighting the spread of investment beyond the traditional southern regions.
Coastal governorates face chronic grid congestion, where load density is highest. Smart-grid automation and reactive-power compensation will relieve some pressure, but physical reinforcement of east-west corridors is indispensable. The 600 MW ELMED interconnector, which lands at Cap Bon on the northeast coast, will create new nodal pricing dynamics once exports commence. Interior agricultural areas are testing agrivoltaic arrays that reduce irrigation demand and align with rural development goals.
Regulatory Landscape
Tunisia's renewables framework is anchored by Law No. 2015-12 (May 11, 2015), which defines three routes to market: self-consumption, authorization (projects developed under calls/authorizations), and concession (projects awarded via tenders). Oversight sits with the Ministry of Industry, Mines and Energy, supported by a Technical Commission for private power generation that reviews authorization requests. Implementation is further detailed in Decree No. 2016-1123 (August 24, 2016) and subsequent amendments, which specify procedural and technical requirements for project development.
For utility-scale IPPs selling to the grid, the regime centers on standardized (non-negotiable) PPAs with Société Tunisienne de l’Électricité et du Gaz (STEG). Project progression commonly involves obtaining ministerial approvals, including an Accord de Principe, before moving to full authorization and contracting. Decree-Law No. 68/2022 (October 19, 2022) introduced amendments intended to improve execution efficiency, reinforcing the government's use of tendered and authorized projects as it targets 30% renewables-by-2030.
Competitive Landscape
International developers anchor the Tunisia renewable energy market, yet must partner with domestic firms for permitting, land aggregation, and grid-access negotiations. Scatec collaborates with the Toyota Tsusho Group on a 100 MW project across Sidi Bouzid and Tozeur, pooling EPC skill sets with Japanese supplier credit. TotalEnergies partnered with VERBUND in the H₂ Notos project, which combines onshore wind, CSP, and desalination to feed electrolyzers, illustrating the convergence of electric and hydrogen value chains.
Chinese EPC groups leverage cost efficiency and state-bank backing to compete aggressively in auctions; the 100 MW Kairouan plant led by China Energy Engineering secured a PPA at USD 0.039/kWh, setting a market benchmark. European B-O-O specialists such as Voltalia and Qair differentiate through bankable long-term O&M records and structured finance from DFIs. Domestic integrators focus on C&I rooftops, where local content exceeds 35% in mounting systems and switchgear.
Competition now centers on hybrid plant design and readiness for ancillary services, rather than the lowest generation tariff alone. Developers offering co-located storage or synchronous condensers fetch higher evaluation points in recent tenders. Service niches are forming around asset-performance analytics and cyber-secure SCADA, areas where Tunisian tech start-ups partner with foreign OEMs.
Tunisia Renewable Energy Industry Leaders
-
Société Tunisienne de l’Électricité et du Gaz (STEG)
-
Eni SpA
-
Scatec ASA
-
TotalEnergies SE
-
Nur Energie Ltd
- *Disclaimer: Major Players sorted in no particular order
Tunisia Renewable Energy Market Companies Covered in this Report
- Société Tunisienne de l’Électricité et du Gaz (STEG)
- Eni SpA
- Scatec ASA
- Nur Energie Ltd
- TotalEnergies SE
- Engie SA
- Ansaldo Energia SpA
- Enel Green Power
- AMEA Power
- Qair Energy
- Gamco Energy
- Akuo Energy
- Masdar
- Siemens Gamesa
- Vestas Wind Systems
- Siemens Energy
- Iberdrola SA
- Seeraj Energy
- Carthage Power Company
- Taqa Arabia
Market Opportunities and Future Outlook
Tunisia's tender-led buildout and standardized PPA structure with STEG create clear whitespace for developers and EPCs that can deliver bankable utility-scale solar and wind projects while meeting evolving grid-integration requirements. In 2026, Scatec reached financial close and started construction for the 120 MW Sidi Bouzid II solar plant, and it also secured a 25-year PPA for a 120 MW solar project in Tataouine through a government tender. These actions show that international sponsors continue to mobilize long-tenor contracting and project finance within the existing regulatory regime.
Opportunities are most concentrated in the south and interior governorates, where solar resource quality supports large-scale deployment and where industrial and export-linked demand concepts are taking shape. Eni's operation of the Adam and Tataouine photovoltaic plants points to room for additional corporate-backed and utility-delivered capacity additions. With the 30% renewables-by-2030 target in place, the pipeline continues to span multiple technologies, rewarding bidders, local partners, and suppliers positioned for repeatable execution across solar PV and onshore wind sites.
Recent Industry Developments in Tunisia Renewable Energy Market
- June 2026: Scatec reached financial close and commenced construction on the 120 MW Sidi Bouzid II solar project; expected operations second half of 2027. Scale-up of Tunisian solar capacity and project finance milestone. Signals continued PPA-led growth and lender support for utility-scale renewables in Tunisia
- April 2026: Scatec announced commencement of commercial operation for the 60 MW Tozeur solar plant (retroactive to March 4, 2026). Operational deployment of a funded solar asset in Tunisia. Demonstrates project execution capability and progression of Scatec’s Tunisian pipeline with Aeolus
- April 2026: Parliament of Tunisia approved five concession agreements for solar PV projects across Sidi Bouzid, Gafsa, and Gabès totaling 598 MW and 1.64 billion dinars investment. Regulatory approvals enabling large-scale tenders. Strengthens policy framework and accelerates tender-led capacity additions in 2026 - 2031
Tunisia Renewable Energy Market Report Scope and Research Methodology
Market Definition and Coverage
This market covers renewable power generation in Tunisia measured in installed capacity, counting grid-connected and captive projects that are commissioned and available to produce electricity within the country.
Scope exclusions: It excludes conventional thermal generation, transmission and distribution build-outs, and pure equipment trade that is not linked to a defined project capacity.
Segments Covered in This Report
- By Technology
- Solar Energy (PV and CSP)
- Wind Energy (Onshore and Offshore)
- Hydropower (Small, Large, PSH)
- Bioenergy
- Geothermal
- Ocean Energy (Tidal and Wave)
- By End-User
- Utilities
- Commercial and Industrial
- Residential
Data Sources, Market Sizing, and Validation
Desk Research
Desk research starts by assembling a clean fact base on power demand, the generation mix, and the renewable project pipeline in Tunisia, then mapping those inputs to capacity additions by technology.
Public sources we use include IRENA capacity statistics, IEA electricity indicators, World Bank country energy data, and UN agency publications that cover climate and energy transition progress.
We also review official releases such as energy ministry updates, national utility and regulator communications, and tender or procurement notices that list awarded capacities and commissioning timelines. For feasibility cross-checks, we review company filings and investor presentations from active developers and EPC contractors, and we also use paid subscriptions for company financials and intelligence, patent databases where relevant, and a contracts and tenders database to track award dates and scope. These examples are not exhaustive, and many other public documents and databases were used for data collection, validation, and clarification.
Primary Interviews and Surveys
We interview Tunisia-based developers, utilities, regulators, financiers, distributors, and industrial users. Interviews and surveys test commissioning dates, self-generation activity, tender conversion, utilization, and project costs, helping us resolve gaps in public records. Re-contact is used when responses conflict with reported capacity or project status.
Distribution of primary research fieldwork respondents
| Company type | Respondent position |
|---|---|
| Top tier: 28% | CXOs: 18% |
| Mid tier: 47% | Functional/Unit leaders: 32% |
| Smaller Players: 25% | Managers: 50% |
Market-Sizing & Forecasting
Sizing is built mainly from a top-down reconstruction of Tunisia installed renewable capacity, aligning official capacity series and technology splits to the project pipeline and expected COD timing by year. We then corroborate totals with selective bottom-up checks, such as summing a sampled set of awarded projects, validating typical unit sizes, and using channel checks on module and turbine delivery timing to catch obvious overstatements.
Key inputs in the model include annual net capacity additions by technology (solar PV and CSP, wind, hydro), auction and tender award volumes, expected grid connection readiness, and observed construction and permitting lead times reported by practitioners. We also track retirement and repowering signals for older assets, plus the utility versus C&I share shift that can change how quickly capacity is realized. Forecasts are produced using scenario analysis, where base case build rates are anchored to policy targets and tender calendars, then adjusted through expert consensus on delays, financing conditions, and grid constraints. Where project-level visibility is weak, gaps are handled through conservative cadence rules, meaning capacity is moved forward only when there is an award, financing progress, or a credible construction marker.
Data Validation & Update Cycle
Validation is handled through several checks so the final numbers match what is realistic on the ground for Tunisia. We compare modeled additions against independent signals like official renewable share targets, public commissioning announcements, and technology-level capacity time series, then investigate any large year-to-year jumps before sign-off.
A second analyst reviews assumptions, units, and conversions, and follow-ups are triggered when primary feedback or new tenders create material variance from the prior model run. Reports are refreshed annually, and interim updates are made when large awards, policy changes, or grid connection developments materially shift the expected COD curve. Before delivery, a final pass is completed so clients receive the latest updated view, including any new commissioning or deferral information that became public.
Mordor Intelligence's Tunisia Renewable Energy Market Estimate Compared With Other Published Estimates
Published market sizes for Tunisia renewables can look far apart because some sources report capacity, while others report spending, and the time cut of project status is not always consistent. Differences also show up when one estimate counts only grid-connected utility projects, and another folds in captive assets, repowering, or even planned projects without a firm award.
Oil and gas power assets sit outside Mordor Intelligence's scope here, which keeps the total tied to renewable installed capacity only, and that is a common reason other figures look larger when they use a broader power-market denominator. Other gaps typically come from how quickly auction awards are assumed to convert into COD, whether offshore wind is counted early despite low near-term execution, and how currency timing is handled when a value-based proxy is used instead of GW.
Benchmark comparison
| Source | Market Size | Gaps in Research Methodology |
|---|---|---|
| Mordor Intelligence | USD 1.29 B (2025) | |
| Industry Association A | USD 1.55 B (2025) | Often presented as a broader clean power figure that can include hybrid plants, storage-linked capacity, or pre-COD projects, which inflates the counted capacity versus commissioned-only tracking. |
| Global Consultancy B | USD 1.10 B (2025) | Tends to apply conservative COD conversion from awarded tenders and may exclude captive C&I installations, which reduces near-term installed capacity in the counted market. |
The spread in the table mostly reflects what gets counted as installed and ready to generate, versus what is still awarded or planned, and that difference matters a lot in a fast ramp-up market. By tying the series to project status gates, technology splits, and practical COD timing checks, we keep the estimate repeatable and easier to reconcile with public capacity statistics.
Key Questions Answered in the Report
How large is the Tunisia Renewable Energy Market today?
Installed capacity stood at 1.62 GW in 2026 and is projected to reach 5.02 GW by 2031 at a 25.42% CAGR.
Which technology leads current deployment?
Solar energy accounts for 70.62% of capacity, thanks to favorable irradiance and low auction tariffs.
What role will wind play by 2031?
Onshore wind is expected to grow at 34.76% CAGR, lifting its share to almost one-third of national renewables.
How is Tunisia financing new capacity?
Multilateral support from the World Bank, EBRD, and MIGA lowers risk, while auctions attract private IPPs with 20-25 year PPAs.
Will Tunisia export green hydrogen?
Memoranda with ACWA Power and TotalEnergies envision up to 600,000 t / yr before 2031, subject to pipeline completion and desalinated water availability.
What is the main barrier to faster growth?
STEG's debt burden and resulting grid deferrals increase financing costs and slow project connection timelines.