Europe Juices Market Size and Share
Market Overview
| Study Period | 2021 - 2031 |
|---|---|
| Forecast Data Period | 2026 - 2031 |
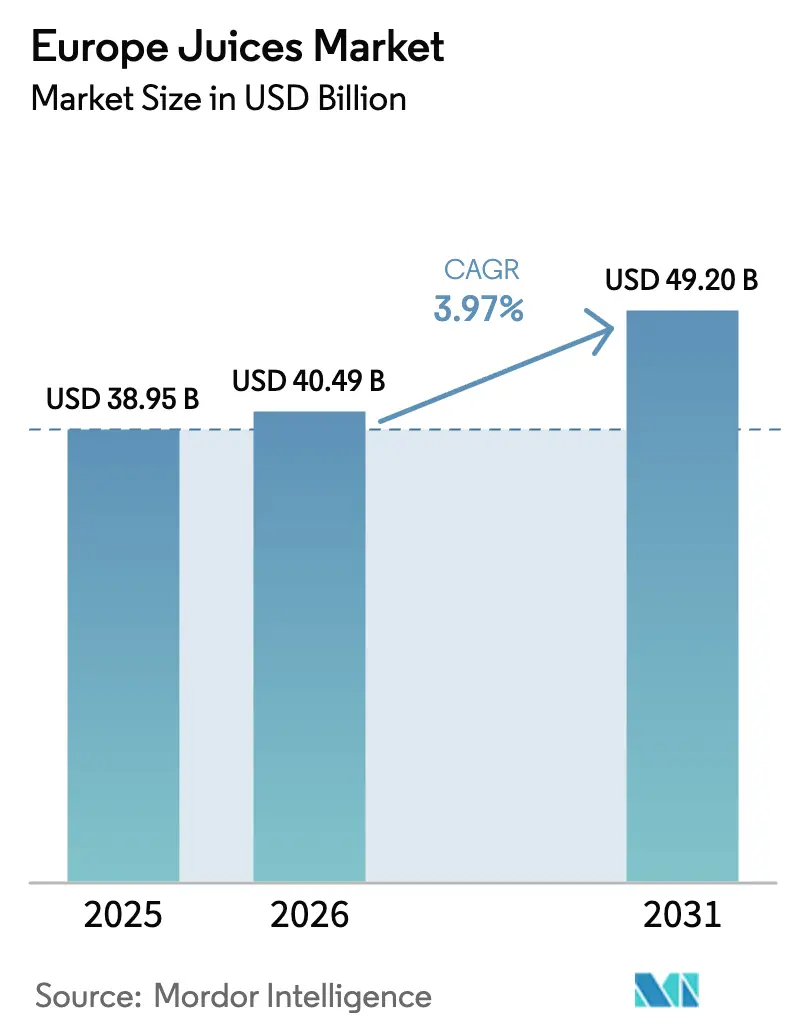
| Base Year Market Size (2025) | USD 38.95 Billion |
| Market Size (2026) | USD 40.49 Billion |
| Market Size (2031) | USD 49.2 Billion |
| Growth Rate (2026 - 2031) | 3.97% CAGR |
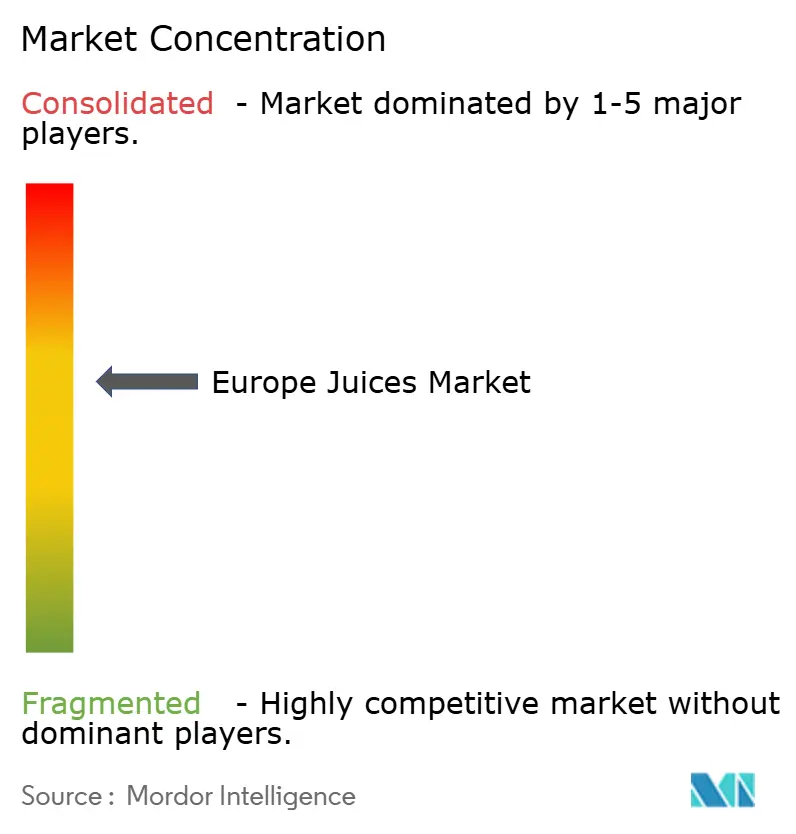
| Market Concentration | Medium |
Major Players *Disclaimer: Major Players sorted in no particular order Image © Mordor Intelligence. Reuse requires attribution under CC BY 4.0. | |
Europe Juices Market Analysis by Mordor Intelligence
Europe juices market size in 2026 is estimated at USD 40.49 billion, growing from 2025 value of USD 38.95 billion with 2031 projections showing USD 49.2 billion, growing at 3.97% CAGR over 2026-2031. The competitive landscape is shaped by trends like lower-sugar reformulation, premium product positioning, and mandates for packaging circularity. Under EU Directive 2024/1438, reduced-sugar juices must cut sugar content by 30%[1]Source: European Commission, “Directive 2024/1438 on Reduced-Sugar Juice,” eur-lex.europa.eu. Meanwhile, Tetra Pak's fermentation technology, set to debut in late 2024, offers processors a way to comply without compromising on taste. Deposit return systems in Germany, the Netherlands, and Ireland are shifting preferences towards glass and cartons with high recycled content. Concurrently, private-labels face pricing pressures as discount retailers broaden their offerings to include organic and 100% juice lines. Climate-induced citrus volatility in Brazil and Southern Europe is prompting supply chains to diversify their fruit bases and secure forward contracts. Innovations are now focusing on hybrid juice-functional formats, upcycled fruit streams, and AI-driven direct-to-consumer subscriptions that tailor nutrient profiles on a large scale.
Key Report Takeaways
- By product type, Juice Drinks (up to 24% juice) led with 44.02% of Europe juices market share in 2025, while 100% Juice is advancing at the fastest 6.51% CAGR through 2031.
- By packaging type, PET bottles held a 37.10% share of the Europe juices market in 2025, while glass bottles are growing at a 6.32% CAGR through 2031.
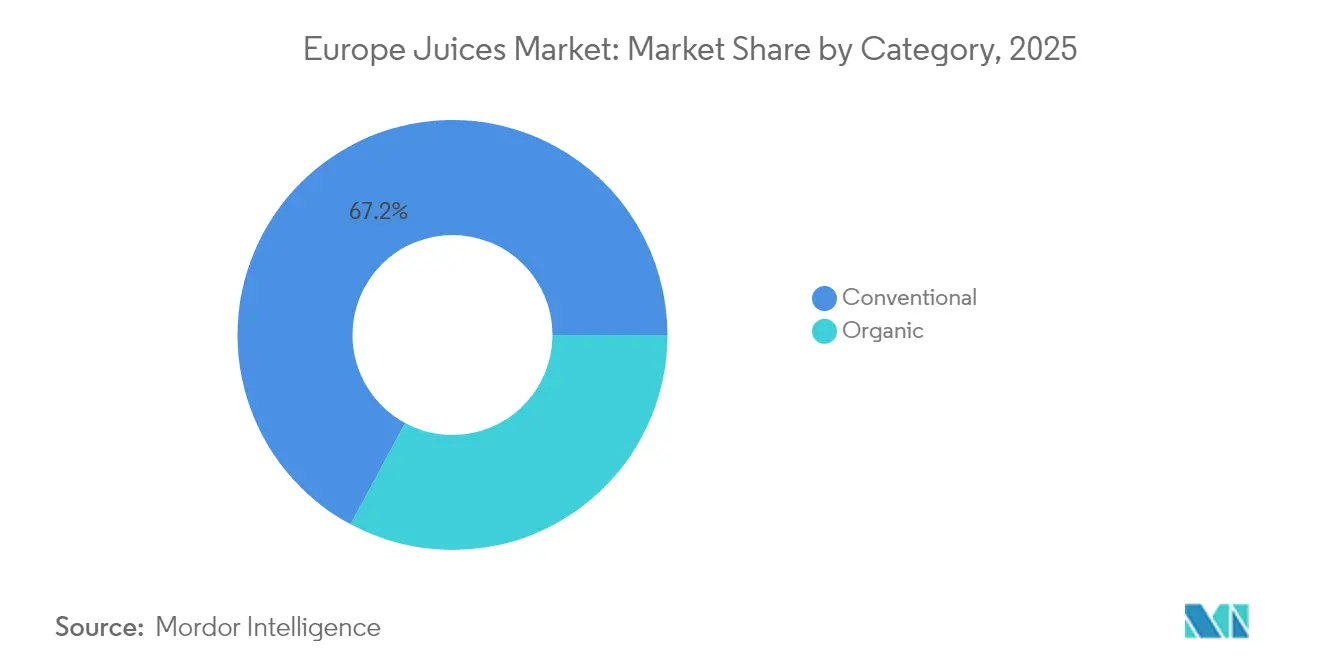
- By category, conventional products accounted for 67.15% of the Europe juices market share in 2025, while organic products are expanding at a 6.95% CAGR through 2031.
- By distribution channel, off-trade captured 72.35% of the Europe juices market in 2025, while on-trade is rebounding at a 7.45% CAGR through 2031.
- By geography, the United Kingdom represented 35.40% of Europe juices market share in 2025, while Germany is the fastest-growing market at a 6.22% CAGR through 2031.
Note: Market size and forecast figures in this report are generated using Mordor Intelligence’s proprietary estimation framework, updated with the latest available data and insights as of 2026.
Europe Juices Market Trends and Insights
Drivers Impact Analysis*
| Driver | (~) % Impact on CAGR Forecast | Geographic Relevance | Impact Timeline |
|---|---|---|---|
| Rising health consciousness and pivot to low-sugar beverages | +1.2% | Global, with the strongest uptake in Germany, the United Kingdom, Netherlands | Medium term (2-4 years) |
| Private-label juice expansion across European discounters and grocers | +0.8% | Spain, Germany, Poland, and the United Kingdom | Short term (≤ 2 years) |
| Sustainable and recyclable beverage-carton adoption | +0.6% | Germany, the Netherlands, the Nordics, expanding to France and Italy | Medium term (2-4 years) |
| AI-enabled personalized nutrition powering D2C functional-juice subscriptions | +0.3% | The United Kingdom, Germany, and France (urban centers) | Long term (≥ 4 years) |
| EU-level reduced-sugar 100%-juice directive catalyzing reformulation | +0.7% | EU27, with accelerated compliance in Germany, France, Netherlands | Short term (≤ 2 years) |
| Up-cycling of fruit side-streams lowers input costs | +0.4% | Spain, Italy, Netherlands (processing hubs) | Medium term (2-4 years) |
| Source: Mordor Intelligence | |||


Rising health consciousness and pivot to low-sugar beverages
Across Europe, consumer demand is shifting beverage portfolios towards reduced free-sugar content. Notably, 100% Juice is projected to grow at a 6.85% CAGR through 2030, even though it holds a smaller share than Juice Drinks in 2024. The European Food Safety Authority (EFSA) has made its stance clear in 2024, advising that free sugars in juices should be "as low as possible"[2]Source: European Food Safety Authority, “Nutrient Profiling Advice 2024,” efsa.europa.eu. This guidance has empowered advocacy groups, such as Foodwatch, to label "no added sugar" claims as misleading, especially when intrinsic fructose levels are high. In response to this regulatory scrutiny, processors are turning to enzymatic and membrane-filtration technologies. These innovations allow for reduced sugar concentrations without sacrificing mouthfeel or shelf life. A testament to this industry shift is Tetra Pak's November 2024 introduction of a fermentation-based sugar reduction solution. This technology permits juice manufacturers to cut sugar content by 20-30% while preserving the sensory profiles that meet consumer sweetness expectations. Germany and the UK are at the forefront of this trend. In these countries, initiatives like soft drinks levies and front-of-pack Nutri-Score labeling have made consumers more vigilant about sugar content. The UK's 2018 soft drinks levy, which imposes a tiered tax based on sugar levels, has already reshaped the carbonated soft drink landscape. Now, it's making waves in the juice-drink sector, with retailers pushing for compliance to prevent shelf delisting.
Private-label juice expansion across European discounters and grocers
In 2024, private-label juice SKUs secured a 39% share of the European juice market's value, marking a 9.4% year-on-year growth. This surge is attributed to discount chains and mainstream grocers broadening their offerings to include 100% juice and organic variants, often priced 20-30% lower than their branded counterparts, as reported by the Private Label Manufacturers Association. Spain tops the list with a 48% penetration, trailed by Germany and the Netherlands. In these countries, Aldi and Lidl have taken a proactive approach, collaborating with contract manufacturers like Refresco Group N.V. to scale up production of their store-brand SKUs. This strategy is tightening the profit margins for established branded players. A testament to this shift is PepsiCo's 2024 sale of its Tropicana and Naked brands for a hefty USD 3.3 billion, signaling a move away from the low-margin juice segment towards more lucrative snacks and functional beverages. Following Spain's lead, Poland is witnessing a surge in its private-label juice value share, climbing 12% in 2024, thanks to Biedronka and Lidl's aggressive expansion of over 200 new stores annually. The UK's affinity for private labels is well-established; major players like Tesco, Sainsbury's, and Asda command a substantial portion of the juice volume. Their significant buyer power compels branded suppliers to either accept reduced wholesale prices or face the risk of delisting. In response to these market dynamics, smaller branded entities are introducing premium sub-brands. These new offerings boast functional enhancements, such as added vitamins, prebiotics, and botanical extracts, allowing them to command price premiums and stand out from the more generic private-label products.
Sustainable and recyclable beverage-carton adoption
As consumers and regulators increasingly prioritize recyclability and carbon footprint over mere convenience, aseptic cartons and glass bottles are capturing a larger market share. Tetra Pak, committing EUR 100 million annually to R&D through 2024, has successfully integrated 90% renewable content into its cartons and achieved a 33% reduction in carbon emissions per liter, using 2019 baselines as a reference. In 2024, negotiations for the EU's Packaging and Packaging Waste Regulation (PPWR) are underway, aiming to enforce mandatory recycled-content thresholds and design-for-recycling criteria. These measures target a phase-out of multi-material laminates and non-detachable closures by 2030. Germany's deposit return system, which encompasses PET and glass beverage bottles, boasted a 60% collection rate in 2024. This success is propelling a 6.62% CAGR for glass bottles, as consumers increasingly view glass as both infinitely recyclable and a premium choice, as highlighted by the German Federal Ministry for the Environment. SIG Combibloc and Elopak are pioneering the commercialization of aseptic cartons. These cartons feature barrier coatings made from bio-based polymers, diminishing the need for aluminum foil and ensuring complete recyclability within paper streams. In a significant move towards sustainability, the Netherlands and Nordic countries are testing carton-to-carton recycling loops. Here, post-consumer aseptic cartons undergo reprocessing into new beverage packaging, effectively closing the material cycle and slashing the demand for virgin fiber by 40%.
EU-level reduced-sugar 100%-juice directive catalyzing reformulation
In 2024, the EU introduced Directive 2024/1438, setting a 30% sugar-reduction target for certain juice categories. The directive also mandates front-of-pack labeling to disclose intrinsic sugar content. While the labeling must be transposable by December 2025, enforcement begins in June 2026. As a result, investments in reformulation are surging, especially in nectars and juice drinks. Producers are now blending lower-sugar fruits, like berries and citrus, with traditionally high-sugar bases such as apple and grape. This strategy allows them to meet the new thresholds without compromising on taste. In a clear nod to the directive's intent, Eckes-Granini acquired a 67% stake in True Fruits, a German smoothie brand, in June 2024. True Fruits is celebrated for its "no added sugar" stance, and the acquisition underscores a shift towards premium-priced, compliant products. France and Germany are poised to enforce the directive stringently. National food authorities in these countries plan to conduct random audits on sugar claims, ready to levy fines for any non-compliance. The directive's reach isn't limited to domestic players. Export-oriented producers in Spain and Italy, like J. García Carrión S.A., face the challenge of reformulating for the EU market. However, they must also maintain distinct SKUs for non-EU channels, which currently lack similar regulations.
Restraints Impact Analysis*
| Restraint | (~) % Impact on CAGR Forecast | Geographic Relevance | Impact Timeline |
|---|---|---|---|
| Stricter sugar front-of-pack labels curbing high-sugar SKUs | -0.5% | EU27, United Kingdom (Nutri-Score adoption accelerating) | Short term (≤ 2 years) |
| Climate-driven citrus-crop volatility in Brazil and Southern Europe | -0.7% | Spain, Italy, Greece (domestic production); global (Brazil imports) | Medium term (2-4 years) |
| Shortage of food-grade recycled PET/board for circular packs | -0.4% | Germany, Netherlands, France (high circular-packaging mandates) | Medium term (2-4 years) |
| High energy prices are squeezing HPP cold-pressed margins | -0.6% | Germany, United Kingdom, Netherlands (premium cold-pressed hubs) | Short term (≤ 2 years) |
| Source: Mordor Intelligence | |||
Climate-driven citrus-crop volatility in Brazil and southern Europe
In 2024, frost damage to citrus groves in São Paulo, Brazil, coupled with recurring droughts in Spain's Valencia region and Italy's Sicily, has led to a 30-40% surge in orange and lemon concentrate prices compared to 2023 averages. This price hike has squeezed margins for juice processors who rely on spot procurement. Brazil, accounting for 70% of global orange juice concentrate exports, sees its production volatility ripple through European supply chains. Here, processors find themselves without alternative sourcing options that match in cost and quality. Spain and Italy, responsible for 60% of the EU's citrus production, are grappling with 15-20% yield declines. These declines stem from extended droughts and heat stress, pushing processors to blend more affordable apple and grape concentrates into their nectar formulations. This blending is a strategy to uphold price points, as noted by the European Commission's Agriculture and Rural Development division. However, this substitution compromises sensory profiles and weakens the premium positioning of products, especially 100% orange juice SKUs, which typically enjoy a 40-50% price premium over nectars. In response to these challenges, forward contracting and vertical integration into citrus farming are gaining traction as risk-mitigation strategies. Notably, Refresco's 2024 acquisitions of Frías Nutrición in Spain and a facility near Berlin underscore a strategic pivot towards regional sourcing and processing redundancy.
High energy prices are squeezing high pressure processing (HPP) cold-pressed margins
High-pressure processing (HPP) stands as the pivotal technology behind cold-pressed juice production. However, it consumes 3-5 times more electricity per liter than thermal pasteurization, rendering cold-pressed SKUs susceptible to fluctuations in energy prices. In 2024, Germany and the UK grappled with a 40-60% surge in electricity prices, driven by constraints in natural gas supply and challenges posed by intermittent renewables. This spike led to a compression of 8-12 percentage points in the margins of cold-pressed juices. In a bid to counteract these challenges, premium brands like Plenish Drinks are entering into long-term power purchase agreements (PPAs) with solar and wind developers. These agreements allow them to secure electricity at rates 30-40% lower than grid prices. However, as highlighted by Renewable Energy World, such PPAs are predominantly accessible to large-volume buyers boasting creditworthy balance sheets. This leaves smaller cold-pressed producers in a lurch. Lacking access to PPAs, they are compelled to raise prices in response to soaring energy costs. This strategy, however, risks alienating consumers who are sensitive to price changes, especially in on-trade channels where they vie with premium smoothies and functional beverages. A notable example of leveraging scale for energy risk hedging is Britvic's 2024 solar PPA, which caters to 75% of its electricity demand in Great Britain.
*Our forecasts treat driver/restraint impacts as directional, not additive. The impact forecasts reflect baseline growth, mix effects, and variable interactions.
Segment Analysis
By Product Type: Reformulation Accelerates 100% Juice Growth
100% Juice is the fastest-growing product type, with a CAGR of 6.51% through 2031, outpacing Juice Drinks (up to 24% juice), which held a 44.02% market share in 2025. Health-conscious consumers are prioritizing "no added sugar" claims as regulatory pressures increase. The EU Directive 2024/1438 mandates a 30% sugar reduction for certain juice categories, driving reformulations in Nectars and Juice Drinks. Processors are blending lower-sugar fruits with high-sugar bases to comply without compromising taste. Tetra Pak's November 2024 launch of a fermentation-based sugar reduction solution enables 20-30% sugar cuts while preserving sensory attributes, boosting 100% Juice SKU introductions in Germany and the Netherlands. Juice Concentrates, the smallest product type by volume, are gaining traction in D2C channels as consumers dilute concentrates at home to control sweetness and reduce packaging waste. Nectars, traditionally popular in Southern Europe, face challenges from Nutri-Score labeling, which assigns lower ratings to products with added sugar. Retailers in France and Spain are reducing shelf space for Nectars in favor of 100% Juice and reformulated Juice Drinks.
Eckes-Granini's June 2024 acquisition of a 67% stake in True Fruits, a German smoothie brand emphasizing "no added sugar," highlights the industry's shift toward regulatory compliance and consumer demand for transparency. Juice Drinks remain the largest product type due to strong private-label penetration and competitive pricing. Spain's 48% private-label share and Poland's 12% year-on-year growth in discount-channel juice sales reflect consumer preference for affordable options during economic uncertainty. However, Juice Drinks' growth is slowing as front-of-pack labeling highlights high sugar content, and EFSA's nutrient profiling advice stigmatizes beverages with over 5 grams of free sugars per 100 milliliters.


By Packaging Type: Glass Bottles Gain Share on Sustainability Perception
Glass Bottles are the fastest-growing packaging type, with a CAGR of 6.32% through 2031, even as PET Bottles hold a 37.10% share in 2025. The expansion of deposit return systems and consumer perception of glass as infinitely recyclable and premium drive this growth. Germany's mandatory deposit scheme, covering PET and glass bottles, achieved a 60% collection rate in 2024, boosting glass adoption among premium juice brands emphasizing recyclability, according to the German Federal Ministry for the Environment. Britvic's February 2024 launch of Ireland's DRS and November 2024 acquisition of a glass-packaging facility near Berlin highlight its strategy to use glass as a differentiator in the competitive juice market. Aseptic Packages, led by Tetra Pak, SIG Combibloc, and Elopak, are adopting bio-based barrier coatings that replace aluminum foil and enable full recyclability in paper streams. This shift aligns with the EU's Packaging and Packaging Waste Regulation (PPWR), which aims to phase out multi-material laminates by 2030, according to the European Commission.
PET Bottles, the largest packaging type, face challenges from food-grade recycled PET (rPET) shortages and consumer concerns about plastic's environmental impact. In 2024, the EU's 60% PET collection rate and 24% average recycled content in beverage bottles fell short of the PPWR's 30% recycled-content mandate for 2030. This gap has created supply-demand imbalances, raising rPET prices 20-30% above virgin PET, as reported by Plastics Recyclers Europe. Refresco's 2024 acquisition of a Berlin-area glass-packaging facility hedges against rPET price volatility and targets the premium-juice market, where glass commands 15-20% price premiums. Metal Cans, the smallest packaging type, are gaining traction in on-trade channels due to portability and fast chilling. Britvic's new can line in Rugby, launched in 2024, caters to HoReCa customers seeking single-serve juice formats.
By Category: Organic Certification Drives Premium Positioning
Organic juices are growing rapidly with a 6.95% CAGR projected through 2031. In 2025, conventional juices held a dominant 67.15% market share. This growth in organic is driven by increased consumer trust, supported by the EU Organic Regulation (EU) 2018/848 and certifications like Germany's Bio-Siegel, which justify 40-60% price premiums. Germany, the global leader in per-capita organic food consumption, reflects this trend in its juice market. Organic juice SKUs, supported by discounters like Aldi and Lidl expanding organic private-label offerings, captured 22% of the value share in 2024, up from 18% in 2022, as per the German Federal Ministry of Food and Agriculture. Similarly, France's AB label and the Netherlands' EKO certification drive organic juice growth, with consumers associating organic with reduced pesticide residues and sustainable farming. However, conventional juice remains dominant due to price sensitivity and limited organic citrus supply. Spain and Italy, which account for 60% of the EU's citrus output, have less than 10% organic-certified acreage, limiting organic orange and lemon juice availability and driving input costs 50-70% higher than conventional, according to the European Commission Agriculture and Rural Development.
Eckes-Granini's acquisition of True Fruits, which sources organic fruits for smoothies, positions the company to capitalize on Germany's organic juice growth and expand into France and the Netherlands. Cold-pressed brands like Plenish Drinks and Suja Life LLC exclusively market organic SKUs, leveraging certifications to command GBP 4-6 per 250-milliliter bottle in UK and German markets. Conventional juices face challenges from front-of-pack labeling and Nutri-Score, which stigmatize high-sugar products regardless of farming methods. This has prompted conventional processors to invest in sugar-reduction technologies to remain competitive.
By Distribution Channel: On-Trade Rebounds as HoReCa Recovers
On-Trade is the fastest-growing distribution channel, with a 7.45% CAGR through 2031, rebounding from pandemic-era closures. Off-Trade holds a dominant 72.35% share in 2025, reflecting the strong presence of supermarkets and hypermarkets. Hotels, restaurants, and cafes (HoReCa) are enhancing breakfast and brunch menus with premium juice offerings. Cold-pressed and organic SKUs, priced at GBP 4-6 per serving, contrast with conventional juice drinks at GBP 1-2. In 2024, Britvic launched a new can line in Rugby to cater to on-trade customers preferring single-serve formats that chill quickly and reduce waste. Refresco's acquisition of Frías Nutrición in Spain strengthens its plant-based drink portfolio, addressing HoReCa demand for dairy alternatives and functional beverages. Off-Trade channels, led by supermarkets, hypermarkets, and discount stores, are expanding private-label juice assortments to attract price-sensitive consumers. Tesco, Sainsbury's, and Asda collectively account for 42% of the UK's juice volume, leveraging buyer power to compress branded-player margins, as noted by the Private Label Manufacturers Association.
Online Retail Stores, a sub-segment of Off-Trade, are growing 9-11% annually. Direct-to-consumer (D2C) juice subscriptions and functional-juice brands bypass traditional retail for higher margins and consumer data. Brands like Plenish Drinks and Suja Life LLC use Shopify and proprietary e-commerce platforms to offer personalized juice cleanses and subscription boxes, employing AI-driven recommendation engines to tailor SKU assortments. Convenience Stores, another Off-Trade sub-segment, are expanding chilled juice selections to capture impulse purchases, with single-serve PET bottles and Aseptic Packages dominating SKU mixes. Other Distribution Channels, including vending machines and workplace cafeterias, are adopting cashless payment systems and IoT-enabled inventory management to reduce stockouts and improve SKU rotation, a trend accelerated by Coca-Cola HBC's 2024 acquisition of BDS Vending in Ireland.
Geography Analysis
In 2025, the United Kingdom held a 35.40% share, driven by strong private-label penetration and the 2018 soft drinks levy, which spurred reformulation in juice drinks and nectars to avoid sugar-based taxation. Tesco, Sainsbury's, and Asda control 42% of UK juice volume, pressuring branded suppliers like PepsiCo and Coca-Cola to accept lower prices or risk delisting, according to the Private Label Manufacturers Association. The UK's voluntary Nutri-Score adoption influences shelf-space allocation, with products scoring D or E losing facings, prompting reformulation toward 100% Juice SKUs with B or C scores. Carlsberg's GBP 3.3 billion acquisition of Britvic in July 2024 highlights consolidation in a flat-volume market reliant on premiumization and functional claims for value growth. Cold-pressed brands like Plenish Drinks are gaining on-trade share in London and Manchester, where HoReCa customers pay 40-60% premiums for organic, HPP-processed SKUs.
Germany, growing at a 6.22% CAGR through 2031, benefits from high per-capita organic food consumption and regulations favoring glass packaging via deposit schemes. Organic juice SKUs, supported by Bio-Siegel certification, rose to 22% value share in 2024, driven by Aldi and Lidl's expanded organic private-label offerings, according to the German Federal Ministry of Food and Agriculture. The deposit return system, with a 60% collection rate in 2024, supports a 6.32% CAGR for glass bottles, seen as premium and recyclable, per the German Federal Ministry for the Environment. Refresco's 2024 acquisitions of Berentzen-Gruppe's Grüneberg site and a Berlin glass-packaging facility reflect confidence in Germany's organic and premium-juice market. Eckes-Granini's June 2024 acquisition of a 67% stake in True Fruits positions it for organic-juice growth and expansion into France and the Netherlands.
In France, Spain, and Italy, climate volatility and regulations are reshaping supply chains and reformulation. France's AB organic label and Nutri-Score drive 100% Juice growth, while Spain's 48% private-label penetration reflects price sensitivity and discount-channel dominance. J. García Carrión S.A. competes with Don Simón SKUs priced 10-15% below multinational brands, leveraging vertical integration. Italy's Sicily region, supplying 40% of EU lemon concentrate, saw 15-20% yield declines in 2024 due to droughts, raising costs and squeezing margins, per the European Commission Agriculture and Rural Development. Russia's import substitution policies favor domestic juice production, while Amsterdam startups lead cold-pressed innovation with HPP-processed functional juices. Poland's private-label juice share rose in 2024, driven by Biedronka and Lidl's 200+ annual store openings. Nordic markets pioneer aseptic carton recycling, with carton-to-carton loops cutting virgin-fiber demand by 40%.
Competitive Landscape
The European Juices Market exhibits moderate fragmentation, with multinational beverage giants, regional juice specialists, and contract manufacturers competing across various price tiers and distribution channels. The Coca-Cola Co. and PepsiCo Inc. leverage their global distribution networks and brand equity, but private-label expansion has pressured their juice margins. European discount chains like Aldi and Lidl have increased their private-label juice market share to 39%, a 9.4% year-on-year rise, by offering 100% juice products at prices 20-30% lower than branded alternatives, according to the Private Label Manufacturers Association. PepsiCo's USD 3.3 billion divestiture of Tropicana and Naked brands in 2024 reflects a strategic pivot away from low-margin juice categories toward higher-return snacks and functional beverages. Similarly, Coca-Cola's February 2025 launch of Simply Pop prebiotic soda highlights its focus on hybrid formats that combine juice with functional ingredients to achieve premium pricing. Regional players such as Eckes-Granini Group, Refresco Group N.V., and J. García Carrión S.A. are pursuing mergers and acquisitions to achieve scale economies in procurement and co-packing. Refresco's 2024 acquisitions, including Berentzen-Gruppe's Grüneberg site and Frías Nutrición in Spain, exemplify its strategy of vertical integration and geographic diversification.
White-space opportunities in the market include upcycled fruit by-products, AI-driven personalized nutrition subscriptions, and hybrid juice formats incorporating plant-based proteins or prebiotics. Cold-pressed juice brands like Plenish Drinks and Suja Life LLC are targeting premium on-trade and direct-to-consumer channels, where functional claims can command 40-60% price premiums. Packaging innovators such as SIG Combibloc and Elopak are introducing aseptic cartons with bio-based barrier coatings, enabling full recyclability in paper streams. These advancements address regulatory pressures from the EU's Packaging and Packaging Waste Regulation (PPWR), which mandates the phase-out of multi-material laminates by 2030, as noted by the European Commission. Tetra Pak's November 2024 launch of a fermentation-based sugar reduction solution, which reduces sugar content by 20-30% while preserving sensory attributes, demonstrates technology-driven differentiation. This innovation helps processors comply with the EU Directive 2024/1438's 30% sugar-reduction requirement without compromising taste.
Emerging disruptors in the market include direct-to-consumer functional juice brands that utilize AI-driven recommendation engines to tailor product assortments based on purchase history and dietary preferences. By bypassing traditional retail channels, these brands capture higher margins and valuable consumer data. Additionally, cold-pressed specialists and packaging innovators are driving differentiation through functional claims and sustainable solutions. As the market evolves, players are increasingly focusing on technology, sustainability, and personalized nutrition to meet consumer demands and regulatory requirements, ensuring competitiveness in a dynamic landscape.
Europe Juices Industry Leaders
Eckes-Granini Group GmbH
The Coca-Cola Co.
PepsiCo Inc.
Refresco Group N.V.
J. García Carrión S.A.
- *Disclaimer: Major Players sorted in no particular order

Recent Industry Developments
- November 2024: Refresco Group N.V. acquired a production facility near Berlin specializing in glass packaging, expanding its capacity to serve premium juice brands that position recyclability as a core value proposition. The acquisition complements Refresco's August 2024 acquisition of Berentzen-Gruppe's Grüneberg site in Germany.
- August 2024: Refresco Group N.V. acquired Berentzen-Gruppe's Grüneberg production site in Germany, adding 200 million liters of annual juice and juice-drink capacity to serve Central European markets. The acquisition strengthens Refresco's position as Europe's largest contract manufacturer of soft drinks and juices.
- June 2024: Eckes-Granini Group acquired a 67% majority stake in True Fruits, a German smoothie brand known for "no added sugar" positioning and organic fruit sourcing. The acquisition positions Eckes-Granini to capture organic-juice growth in Germany and expand into France and the Netherlands.


Europe Juices Market Report Scope
100% Juice, Juice Drinks (up to 24% Juice), Juice concentrates, Nectars (25-99% Juice) are covered as segments by Soft Drink Type. Aseptic packages, Disposable Cups, Glass Bottles, Metal Can, PET Bottles are covered as segments by Packaging Type. Off-trade, On-trade are covered as segments by Distribution Channel. Belgium, France, Germany, Italy, Netherlands, Russia, Spain, Turkey, United Kingdom are covered as segments by Country.| 100% Juice |
| Juice Drinks (up to 24% Juice) |
| Juice Concentrates |
| Nectars |
| Aseptic packages |
| Glass Bottles |
| Metal Can |
| PET Bottles |
| Conventional |
| Organic |
| On-Trade | |
| Off-Trade | Supermarket/Hypermarket |
| Online Retail Store | |
| Convenience Store | |
| Other Distribution Channels |
| United Kingdom |
| Germany |
| France |
| Italy |
| Spain |
| Netherlands |
| Poland |
| Rest of Europe |
| Product Type | 100% Juice | |
| Juice Drinks (up to 24% Juice) | ||
| Juice Concentrates | ||
| Nectars | ||
| Packaging Type | Aseptic packages | |
| Glass Bottles | ||
| Metal Can | ||
| PET Bottles | ||
| Category | Conventional | |
| Organic | ||
| Distribution Channel | On-Trade | |
| Off-Trade | Supermarket/Hypermarket | |
| Online Retail Store | ||
| Convenience Store | ||
| Other Distribution Channels | ||
| Geography | United Kingdom | |
| Germany | ||
| France | ||
| Italy | ||
| Spain | ||
| Netherlands | ||
| Poland | ||
| Rest of Europe | ||


Market Definition
- Carbonated Soft Drinks (CSDs) - Carbonated soft drinks (CSDs) refer to non-alcoholic beverages that are carbonated and typically flavored, containing dissolved carbon dioxide to create effervescence. These beverages commonly include cola, lemon-lime, orange, and various fruit-flavored sodas. Marketed in cans, bottles, or fountain dispense.
- Juices - We have considered packaged juices which encompass non-alcoholic beverages derived from fruits, vegetables, or a combination thereof, processed and sealed in various packaging formats such as bottles, cartons, or pouches. Excluding fresh juices, this market segment involves commercially prepared and preserved juices, often with added preservatives and flavors.
- Ready-to-Drink (RTD) Tea and RTD Coffee - Ready-to-Drink (RTD) tea and RTD coffee are pre-packaged, non-alcoholic beverages that are brewed and prepared for consumption without further dilution. RTD tea typically includes various tea varieties, infused with flavors and sweeteners, and comes in bottles, cans, or cartons. Similarly, RTD coffee involves pre-brewed coffee formulations, often mixed with milk, sugar, or flavorings, and is conveniently packaged for on-the-go consumption.
- Energy Drinks - Energy drinks are non-alcoholic beverages formulated to provide a quick boost of energy and alertness. Whereas, sports drinks are beverages designed to hydrate and replenish electrolytes, particularly after physical exertion, exercise, or intense activity
| Keyword | Definition |
|---|---|
| Carbonated Soft Drinks | Carbonated soft drinks (CSDs) are a combination of carbonated water and flavouring, sweetened by sugar or a non-sugar sweeteners. |
| Standard Cola | Standard Cola is defined as the original flavor of cola soda. |
| Diet Cola | A cola-based soft drink containing no or low amounts of sugar |
| Fruit Flavored Carbonates | A carbonated beverage prepared from fruit juice/fruit flavor with carbonated water and containing sugar, dextrose, invert sugar or liquid glucose either singly or in combination. It may contain peel oil and fruit essences. |
| Juice | Juice is a drink made from the extraction or pressing of the natural liquid contained in fruit and vegetables. |
| 100% Juice | Fruit/vegetable juice made from fruit in the form of its juice with no water added to make up the volume. It is not permitted to add sugars, sweeteners, preservatives, flavourings or colourings to fruit juice. |
| Juice Drinks (up to 24% Juice) | Fruit/vegetable juice drinks with up to 24% fruits/vegetable extract. |
| Nectars (25-99% Juice) | Juices that can have between 25 and 99% of fruit, with the minimum legal limits defined depending on the type of fruit |
| Juice concentrates | Juice Concentrates are those form of juices when most of this liquid is removed resulting in a thick, syrupy product known as juice concentrate. |
| RTD Coffee | Packaged coffee beverages that are sold in a prepared form and are ready for consumption at the time of purchase. |
| Iced Coffee | An iced coffee is a cold version of coffee, usually a combination of hot espresso and milk with ice added to it. |
| Cold Brew Coffee | Cold brew also called cold water extraction or cold pressing is made by steeping ground coffee in room-temperature water for several hours. |
| RTD Tea | Ready-to-drink (RTD) tea is a packaged tea product ready for immediate consumption without brewing or preparation |
| Iced Tea | Ice tea or iced tea is a drink made from tea without milk but with sugar and sometimes fruit flavourings, drunk cold. |
| Green Tea | Green tea is a tea beverage which promotes mental alertness, relieving digestive symptoms and promoting weight loss. |
| Herbal Tea | Herbal tea beverages are made from the infusion or decoction of herbs, spices, or other plant material in hot water. |
| Energy Drink | A type of drink containing stimulant compounds, usually caffeine, which is marketed as providing mental and physical stimulation. They may or may not be carbonated and may also contain sugar, other sweeteners, or herbal extracts, among numerous possible ingredients. |
| Sugar-free or Low-calories Energy Drinks | Sugar-free or Low-calories Energy Drinks are sugar-free, artificially sweetened energy drinks with few or no calories. |
| Traditional Energy Drink | Traditional Energy Drinks are functional soft drinks containing ingredients designed to boost the consumer's energy. |
| Natural/Oraganic Energy Drinks | Natural/Organic energy drinks are energy drinks free of artificial sweeteners and synthetic colorings. Instead, they contain naturally derived ingredients such as green tea, yerba mate, and botanical extracts. |
| Energy Shots | A small but highly concentrated energy drink that contains large amounts of caffeine and/or other stimulants. The quantity is comparatively smaller compared to energy drinks. |
| Sports Drink | Sports drinks are beverages designed specifically for the rapid supply of fluid, carbohydrates, and electrolytes before, during or after exercise. |
| Isotonic | Isotonic drinks contain similar concentrations of salt and sugar as in the human body, and are designed to quickly replace fluids lost during exercise but with an increase of carbohydrate. |
| Hypertonic | Hypertonic drinks have a higher concentration of salt and sugar than the human body. They are best drunk after exercise as it is important to replace glycogen levels quickly after exercise. |
| Hypotonic | Hypotonic drinks are designed to quickly replace fluids lost during exercise. They have very low carbohydrate content and a lower concentration of salt and sugar than the human body. |
| Electrolyte-Enhanced Water | Electrolyte water is water infused with electrically-charged minerals, such as sodium, potassium, calcium, and magnesium. |
| Protein-based Sport Drinks | Protein-based sports drinks are those sports drinks which has added protein in it that will improve performance and reduce muscle protein breakdown. |
| On-Trade | The on-trade refers to places that sell beverages for immediate consumption on the premises like bars, restaurants, and pubs |
| Off-Trade | Off-trade usually means places like liquor stores, supermarkets and other places where you don't consume the beverage right away. |
| Convenience Store | A retail business that provides the public with a convenient location to quickly purchase a wide variety of consumable products and services, generally food and gasoline. |
| Specialty store | A specialty store is a shop/store that carries a deep assortment of brands, styles, or models within a relatively narrow category of goods |
| Online Retail | Online retail is a type of eCommerce whereby a business sells goods or services directly to consumers from a website. |
| Aseptic Packaging | Aseptic packaging refers to the filling of a cold, commercially sterile product under sterile conditions into a presterilized container and closure under sterile conditions to form a seal that effectively excludes microorganisms. These includes tetra packs, cartons, pouches etc. |
| PET Bottle | PET bottle means a bottle made of polyethylene terephthalate. |
| Metal Cans | Metal containers made of aluminum or tin- plated or zinc-plated steel, which are commonly used for packaging food, beverages or other products. |
| Disposable Cups | Disposable Cup means a cup or other container designed for single use to serve beverages, such as water, cold drinks, hot drinks and alcoholic beverages. |
| Gen Z | A way of referring to the group of people who were born in the late 1990s and early 2000s. |
| Millenial | Anyone born between 1981 and 1996 (ages 23 to 38 in 2019) is considered a Millennial |
| Taurine | Taurine is an amino acid that supports immune health and nervous system function. |
| Bars & Pubs | It is a drinking establishment licensed to serve alcoholic drinks for consumption on the premises. |
| Café | It is a foodservice establishment serving refreshments (mainly coffee) and light meals. |
| On the go | It means doing / dealing with while busily engaged with something and not diverting plans in order to accommodate. |
| Internet Penetration | The Internet Penetration Rate corresponds to the percentage of the total population of a given country or region that uses the Internet. |
| Vending Machine | A machine that dispenses small articles such as food, drinks, or cigarettes when a coin or token is inserted |
| Discount store | A discount store or discounter offers a retail format in which products are sold at prices that are in principle lower than an actual or supposed "full retail price". Discounters rely on bulk purchasing and efficient distribution to keep down costs. |
| Clean Label | Clean label on the beverage market are drinks that are made from few ingredients of natural origin and are not or only slightly processed. |
| Caffeine | An alkaloid compound which is a stimulant of the central nervous system. It is mainly used recreationally, as a mild cognitive enhancer to increase alertness and attentional performance. |
| Extreme sport | Action sports, adventure sports or extreme sports are activities perceived as involving a high degree of risk. |
| High-intensity interval training | It incorporates several rounds that alternate between several minutes of high intensity movements to significantly increase the heart rate to at least 80% of one's maximum heart rate, followed by short periods of lower intensity movements. |
| Shelf life | The length of time for which an item remains usable, fit for consumption, or saleable. |
| Cream Soda | Cream soda is a sweet soft drink. Generally flavored with vanilla and based on the taste of an ice cream float |
| Root Beer | Root beer is a sweet North American soft drink traditionally made using the root bark of the sassafras tree Sassafras albidum or the vine of Smilax ornata as the primary flavor. Root beer is typically, but not exclusively, non-alcoholic, caffeine-free, sweet, and carbonated. |
| Vanilla Soda | A carbonated soft drink flavoured with vanilla. |
| Dairy-Free | A product that does not contain any milk or milk products from cows, sheep or goats. |
| Caffeine-Free Energy Drinks | Caffeine-free energy drinks rely on other ingredients to boost the energy. Popular choices include amino acids, B vitamins, and electrolytes. |


Research Methodology
Mordor Intelligence follows a four-step methodology in all our reports.
- Step-1: IDENTIFY KEY VARIABLES: In order to build a robust forecasting methodology, the variables and factors identified in Step 1 are tested against available historical market numbers. Through an iterative process, the variables required for market forecast are set, and the model is built on the basis of these variables.
- Step-2: Build a Market Model: Market-size estimations for the forecast years are in nominal terms. Inflation is not a part of the pricing, and the average selling price (ASP) is kept constant throughout the forecast period for each country.
- Step-3: Validate and Finalize: In this important step, all market numbers, variables, and analyst calls are validated through an extensive network of primary research experts from the market studied. The respondents are selected across levels and functions to generate a holistic picture of the market studied.
- Step-4: Research Outputs: Syndicated reports, custom consulting assignments, databases & subscription platforms


