Europe Herbicide Market Size and Share
Market Overview
| Study Period | 2018 - 2031 |
|---|---|
| Forecast Data Period | 2026 - 2031 |
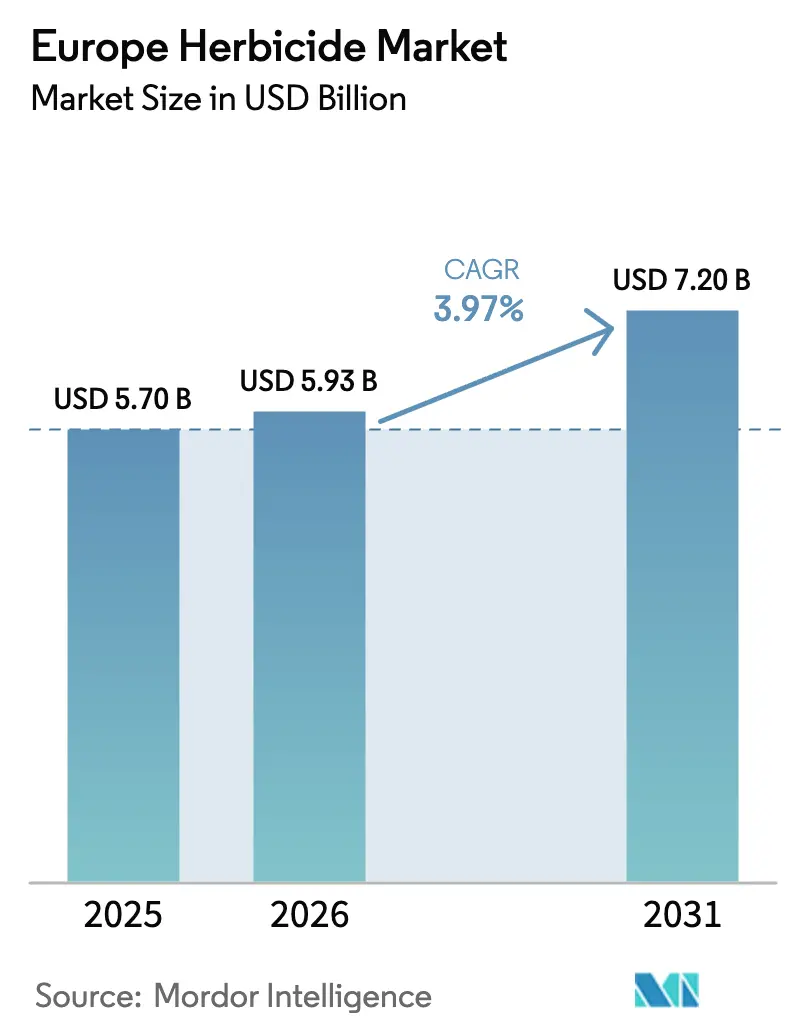
| Base Year Market Size (2025) | USD 5.70 Billion |
| Market Size (2026) | USD 5.93 Billion |
| Market Size (2031) | USD 7.2 Billion |
| Growth Rate (2026 - 2031) | 3.97% CAGR |
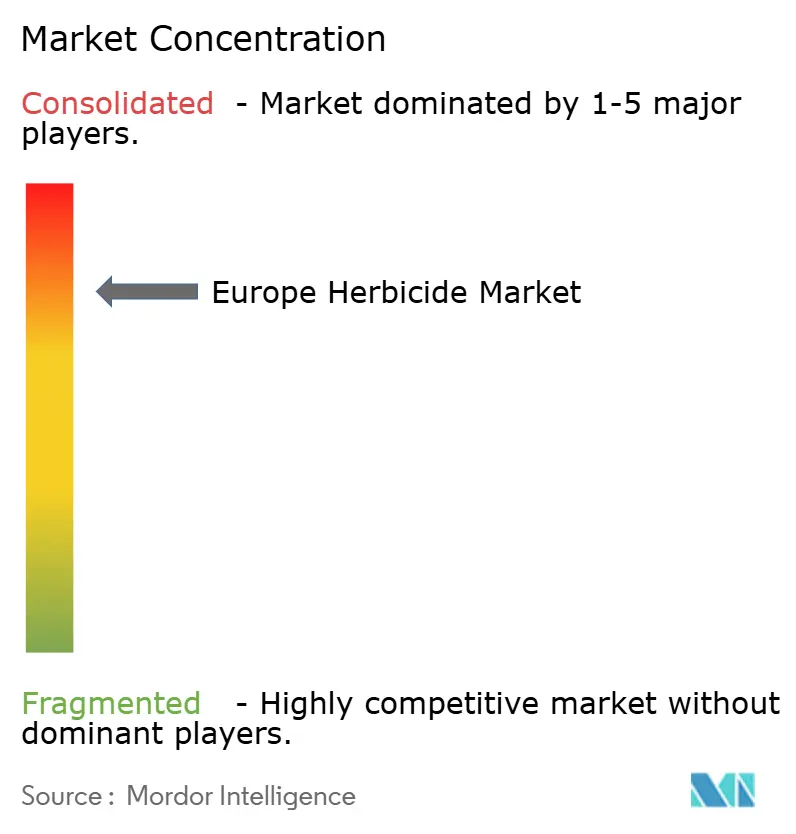
| Market Concentration | High |
Major Players *Disclaimer: Major Players sorted in no particular order Image © Mordor Intelligence. Reuse requires attribution under CC BY 4.0. | |
Europe Herbicide Market Analysis by Mordor Intelligence
The Europe herbicide market size was valued at USD 5.70 billion in 2025 and estimated to grow from USD 5.93 billion in 2026 to reach USD 7.2 billion by 2031, at a CAGR of 3.97% during the forecast period (2026-2031). Robust demand for pre-emergent products in conservation tillage, rising grain cultivation for feed and biofuel, and escalating herbicide-resistant weeds jointly sustain topline growth even as the European Union tightens active-ingredient approvals. Precision spraying systems that combine AI-driven weed mapping with variable-rate technology are re-shaping purchase criteria by emphasizing efficacy per gram rather than total volume applied. Meanwhile, France, Germany, and the Netherlands anchor regional adoption of herbicide-tolerant sugar beet and pilot oilseed rape, reinforcing crop-specific herbicide programs that command premium pricing. Supply chain initiatives to localize precursor manufacturing and mitigate Chinese dependency are gaining urgency after 2024 price spikes, fostering capital investment in Belgium and Germany.
Key Report Takeaways
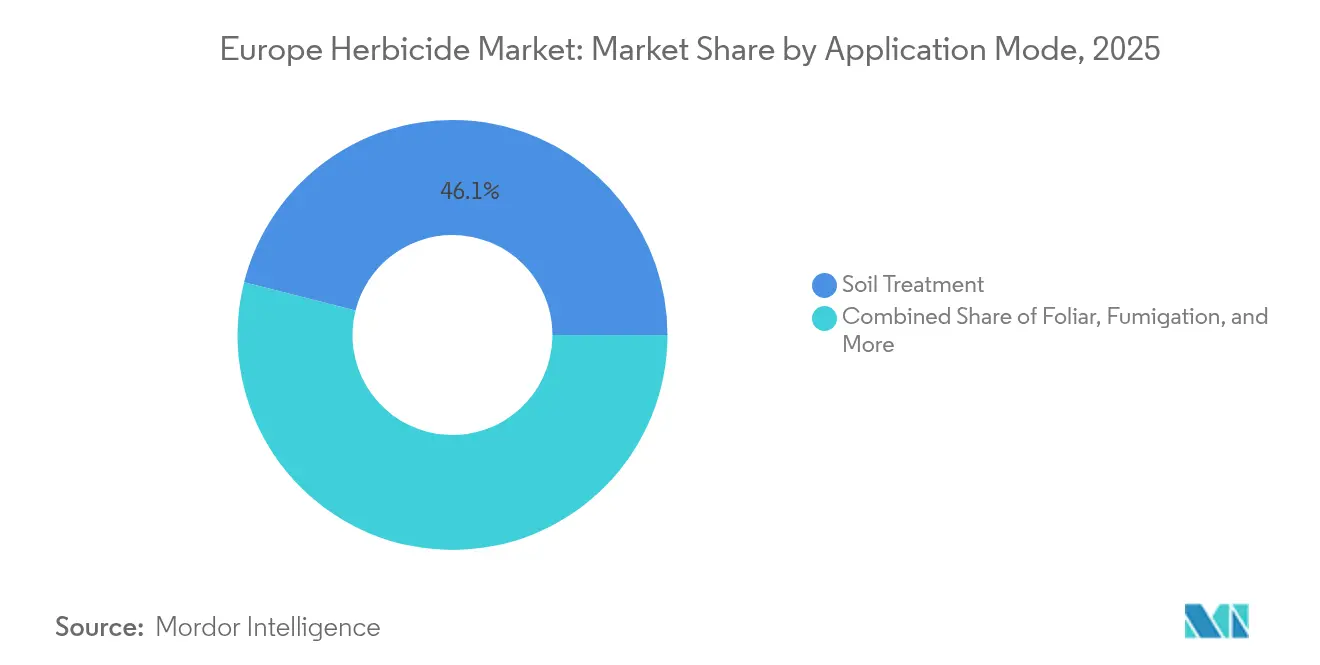
- By application mode, soil treatment commanded 46.05% of the Europe herbicide market share in 2025 while expanding at a 4.08% CAGR through 2031.
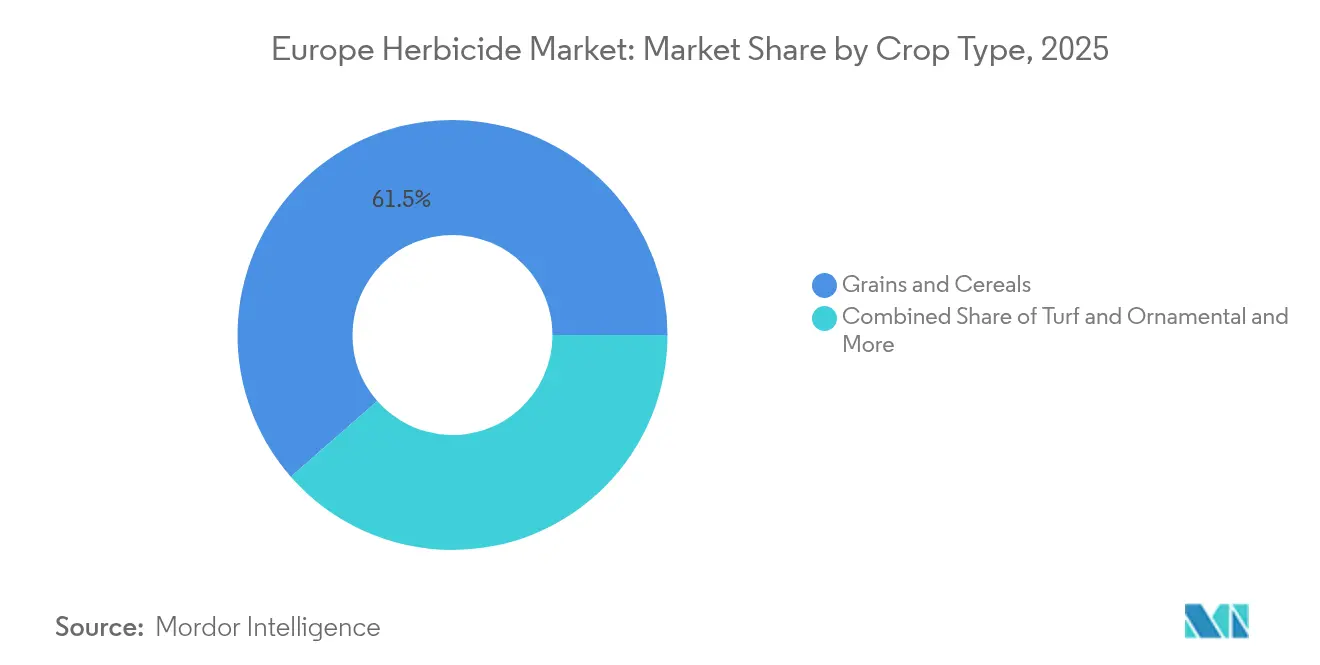
- By crop type, grains and cereals accounted for 61.45% of the Europe herbicide market size in 2025, whereas turf and ornamental applications record the fastest 4.26% CAGR to 2031.
- By geography, France led with 22.05% revenue share of the Europe herbicide market in 2025, and the country is projected to advance at 5.65% CAGR through 2031.
Note: Market size and forecast figures in this report are generated using Mordor Intelligence’s proprietary estimation framework, updated with the latest available data and insights as of 2026.
Europe Herbicide Market Trends and Insights
Drivers Impact Analysis*
| Driver | (~) % Impact on CAGR Forecast | Geographic Relevance | Impact Timeline |
|---|---|---|---|
| Herbicide-resistant weeds escalating repeat applications | +1.2% | Europe-wide, concentrated in France, Germany, and the United Kingdom | Medium term (2-4 years) |
| Expansion of conservation tillage and no-till acreage | +0.8% | Northern Europe, expanding to the Mediterranean | Long term (≥4 years) |
| Growth in grain and cereal production for feed and biofuel | +0.6% | France, Germany, Poland, Ukraine | Medium term (2-4 years) |
| Adoption of herbicide-tolerant seeds in select European states | +0.4% | France, the Netherlands, and Germany | Long term (≥4 years) |
| AI-driven weed-mapping enabling precision spraying | +0.3% | Western Europe, pilot programs in Eastern Europe | Short term (≤2 years) |
| Carbon-credit linked low-tillage incentives boost demand | +0.2% | European member states with carbon trading schemes | Medium term (2-4 years) |
| Source: Mordor Intelligence | |||


Herbicide-Resistant Weeds Escalating Repeat Applications
Herbicide resistance has evolved from an isolated concern to a systemic threat across European agriculture, with blackgrass resistance to multiple modes of action now documented in over 80% of United Kingdom winter wheat fields. The European Weed Research Society estimates resistance-related yield losses exceed EUR 1.2 billion (USD 1.3 billion) annually, forcing growers to adopt sequential application strategies that increase herbicide consumption per hectare [1]Source: European Weed Research Society, “Herbicide Resistance in European Agriculture: Economic Impact Assessment,” EWRS Annual Report, ewrs.org. This resistance pressure particularly affects glyphosate-dependent systems, where Palmer amaranth and rigid ryegrass have developed cross-resistance to multiple chemistries. French agricultural cooperatives report 35% increases in herbicide application frequency since 2022, as single-pass weed control becomes increasingly unreliable.
Expansion of Conservation Tillage and No-Till Acreage
Conservation agriculture practices have gained substantial momentum across Europe, with no-till acreage expanding 15% annually since 2023 as farmers seek to reduce fuel costs and improve soil health metrics required for European sustainability certifications. The European Conservation Agriculture Federation documents that reduced tillage systems increase pre-emergent herbicide dependency by 40-60% compared to conventional cultivation, as mechanical weed control options diminish. This shift proves particularly pronounced in Germany and France, where carbon credit programs incentivize soil carbon sequestration through minimal disturbance farming. The trend creates sustained demand for residual herbicides with extended soil activity, driving premiumization toward formulations with enhanced persistence and spectrum.
Growth in Grain and Cereal Production for Feed and Biofuel
European grain production has intensified to meet dual demands from livestock feed and renewable energy mandates, with the European Renewable Energy Directive requiring 14% biofuel content in transport fuels by 2030. Cereals acreage dedicated to bioethanol production expanded 8% in 2024, concentrated in France and Germany, where distillation capacity increased following energy security concerns. This production intensification drives herbicide consumption through higher plant densities and extended growing seasons that increase weed pressure windows. Feed grain demand remains robust as European livestock production recovers from 2022-2023 disruptions, with corn and wheat prices stabilizing above EUR 200 (USD 216) per metric ton, justifying intensive weed management investments.
Adoption of Herbicide-Tolerant Seeds in Select European States
Herbicide-tolerant crop varieties have gained regulatory approval in specific European markets, with France authorizing glyphosate-tolerant sugar beet cultivation in 2024 following emergency derogations for virus yellows control. The French National Institute for Agricultural Research estimates that herbicide-tolerant sugar beet adoption could reach 40% of national acreage by 2026, creating dedicated demand for selective herbicide applications. Netherlands and Germany maintain pilot programs for herbicide-tolerant oilseed rape, though commercial approvals remain limited by European genetically modified organisms (GMOs) regulations. This selective adoption pattern creates geographic pockets of intensive herbicide use, particularly benefiting selective formulations that complement crop tolerance traits.
Restraints Impact Analysis*
| Restraint | (~) % Impact on CAGR Forecast | Geographic Relevance | Impact Timeline |
|---|---|---|---|
| Tightening European active-ingredient approvals and glyphosate risk | -0.9% | European-wide, particularly affecting Germany, France | Short term (≤2 years) |
| Expansion of certified organic farmland | -0.6% | Northern and Western Europe, Mediterranean regions | Long term (≥4 years) |
| Grower shift to mechanical weeding in resistant hotspots | -0.4% | United Kingdom, Denmark, Netherlands | Medium term (2-4 years) |
| Volatile Chinese precursor supply inflates costs | -0.3% | Europe-wide supply chain impact | Short term (≤2 years) |
| Source: Mordor Intelligence | |||
Tightening European Active-Ingredient Approvals and Glyphosate Risk
The European Food Safety Authority's increasingly stringent evaluation protocols have resulted in the withdrawal of 23 herbicide active ingredients since 2022, creating supply constraints that limit grower options and increase dependency on remaining approved chemistries. EFSA's 2024 decision to restrict metribuzin use in potatoes eliminated a key tool for Solanaceae weed control, forcing growers toward more expensive alternative programs that often prove less effective [2]Source: European Food Safety Authority, “Glyphosate Assessment Continues: EFSA and ECHA Conclude Peer Review,” EFSA News, efsa.europa.eu . The glyphosate renewal controversy continues despite the 10-year approval extension, with Germany and France maintaining national restrictions that create regulatory uncertainty affecting long-term investment decisions. This approval bottleneck particularly impacts specialty herbicides for minor crops, where limited market size cannot justify the EUR 10-15 million (USD 10.8-16.2 million) required for modern registration dossiers.
Expansion of Certified Organic Farmland
Organic agriculture continues expanding across Europe, with certified organic acreage reaching 16.9 million hectares in 2024, representing 9.1% of total agricultural land and growing at 4.2% annually. The EU Farm to Fork Strategy targets 25% organic farmland by 2030, supported by Common Agricultural Policy subsidies that provide EUR 200-400 (USD 216-432) per hectare premiums for organic conversion. This transition directly reduces herbicide demand as organic certification prohibits synthetic chemical inputs, with each converted hectare eliminating approximately 2.5 kilograms of active ingredient consumption annually. The trend proves particularly pronounced in Germany, Austria, and Denmark, where organic market premiums exceed 30% for major crops, creating economic incentives for chemical-free production systems.
*Our forecasts treat driver/restraint impacts as directional, not additive. The impact forecasts reflect baseline growth, mix effects, and variable interactions.
Segment Analysis
By Application Mode: Soil Applications Drive Market Leadership
Soil treatment commands 46.05% market share in 2025, reflecting European agriculture's shift toward conservation tillage practices that rely heavily on pre-emergent herbicide applications for effective weed management. This dominance stems from the mode's compatibility with no-till systems that have expanded 15% annually since 2023, as farmers seek to reduce fuel costs and qualify for Europe carbon sequestration incentives . The soil treatment segment also projects the fastest growth at 4.08% CAGR through 2031, driven by increasing adoption of precision application technologies that optimize herbicide placement and persistence.
Soil treatment's popularity stems from its ability to control weeds during their vulnerable pre-emergent phases, providing long-lasting protection throughout the growing season. The method's effectiveness in delivering herbicides directly to the soil, where weed seeds germinate, makes it particularly valuable for farmers seeking comprehensive weed control solutions. Additionally, soil treatment helps in establishing a protective barrier against weed emergence, contributing to improved crop yields and reduced competition for nutrients.


By Crop Type: Cereals Dominance Faces Diversification Pressure
Grains and cereals represent 61.45% of European herbicide consumption in 2025, reflecting the region's position as a major wheat, barley, and corn producer where herbicide-resistant weeds impose annual losses exceeding EUR 1.2 billion (USD 1.3 billion). This segment benefits from dual demand drivers, including livestock feed requirements and biofuel mandates that support production intensification, regardless of food market volatility.
The fastest-growing segment, turf and ornamental applications, expands at a 4.26% CAGR through 2031, driven by urbanization trends and professional landscaping requirements that justify premium herbicide formulations. The European Food Safety Authority's tightening approval standards disproportionately impact specialty crops where limited market size cannot justify expensive registration dossiers, potentially constraining growth in higher-value segments.
Geography Analysis
France led the Europe herbicide market in 2025 with a 22.05% revenue share thanks to broad cereal acreage, early no-till adoption, and national approval for glyphosate-tolerant sugar beet that widened selective spraying programs. The country is also forecast to grow at a 5.65% CAGR to 2031 as bioethanol targets lift maize and wheat plantings and carbon credits offset chemical costs. Germany ranks second despite tight regulations; high machinery innovation drives precision spraying that cuts wastage yet increases spend on premium products.
Italy and Spain focus on vineyards and olives that require season-long weed suppression under Mediterranean drought stress, favoring residual soil treatments. The United Kingdom grapples with pervasive blackgrass resistance that spurs integration of mechanical weeding robots alongside chemical programs, redefining overall herbicide strategies. Eastern states such as Poland and the Czech Republic offer upside through mechanization and Common Agricultural Policy alignment, moving from sub-optimal generic sprays toward branded formulations compatible with modern equipment.
The Netherlands showcases the highest precision farming penetration, with 40% of holdings using GPS-linked sprayers that reduce off-target drift and support strict environmental thresholds. Regulatory divergence across member states complicates portfolio management for multinational suppliers, compelling localized product lines that meet country-specific maximum residue limits. Collectively, geography-driven nuances ensure that the Europe herbicide market remains heterogeneous, demanding agile supply chains and adaptive marketing strategies.
Competitive Landscape
The European herbicide market exhibits a high level of consolidation, dominated by well-established global agrochemical conglomerates with diverse product portfolios. These major players, including Bayer AG, Syngenta Group, BASF SE, Nufarm Ltd., and Corteva Agriscience, are leveraging their extensive research capabilities, established distribution networks, and strong brand recognition to maintain their market positions. The market structure is characterized by the presence of both integrated agricultural solution providers and specialized crop protection chemicals companies, with global leaders maintaining significant advantages through their broad product offerings and technological expertise.
Merger and acquisition activities have played a crucial role in shaping the competitive landscape, with several significant consolidations strengthening the position of market leaders. Companies are strategically acquiring regional players and technology firms to expand their geographical presence and enhance their technological capabilities. These M&A activities have resulted in improved operational efficiencies, expanded product portfolios, and strengthened market positions for the acquiring companies, while also leading to increased market concentration.
For incumbent companies to maintain and increase their market share, focusing on sustainable product development and technological innovation is crucial. Market leaders are investing in developing eco-friendly formulations and improving product efficiency to address growing environmental concerns. Companies are also strengthening their position through strategic partnerships with agricultural biotech firms and research institutions, while expanding their digital agriculture capabilities to provide integrated solutions to farmers.
Europe Herbicide Industry Leaders
Bayer AG
Syngenta Group
BASF SE
Nufarm Ltd.
Corteva Agriscience
- *Disclaimer: Major Players sorted in no particular order

Recent Industry Developments
- December 2023: ADAMA introduced its most advanced cross-spectrum herbicide called Kampai for the grain business. The new product provides the broadest application window for broadleaf and narrow-leaf weed control for cereal crops.
- January 2023: Bayer formed a new partnership with Oerth Bio to enhance crop protection technology and create more eco-friendly crop protection solutions.
- November 2022: Syngenta launched the new A.I.R. TM technology, which is the most powerful herbicide tolerance system for sunflower agriculture that helps farmers in Europe overcome the difficulties associated with weed management.


Europe Herbicide Market Report Scope
Chemigation, Foliar, Fumigation, Soil Treatment are covered as segments by Application Mode. Commercial Crops, Fruits & Vegetables, Grains & Cereals, Pulses & Oilseeds, Turf & Ornamental are covered as segments by Crop Type. France, Germany, Italy, Netherlands, Russia, Spain, Ukraine, United Kingdom are covered as segments by Country.| Chemigation |
| Foliar |
| Fumigation |
| Soil Treatment |
| Commercial Crops |
| Fruits & Vegetables |
| Grains & Cereals |
| Pulses & Oilseeds |
| Turf & Ornamental |
| Germany |
| France |
| Spain |
| Russia |
| Italy |
| United Kingdom |
| Netherlands |
| Ukraine |
| Rest of Europe |
| Application Mode | Chemigation |
| Foliar | |
| Fumigation | |
| Soil Treatment | |
| Crop Type | Commercial Crops |
| Fruits & Vegetables | |
| Grains & Cereals | |
| Pulses & Oilseeds | |
| Turf & Ornamental | |
| Geography | Germany |
| France | |
| Spain | |
| Russia | |
| Italy | |
| United Kingdom | |
| Netherlands | |
| Ukraine | |
| Rest of Europe |


Market Definition
- Function - Herbicides are chemicals used to control or prevent weeds from preventing crop growth and yield loss.
- Application Mode - Foliar, Seed Treatment, Soil Treatment, Chemigation, and Fumigation are the different type of application modes through which crop protection chemicals are applied to the crops.
- Crop Type - This represents the consumption of crop protection chemicals by Cereals, Pulses, Oilseeds, Fruits, Vegetables, Turf, and Ornamental crops.
| Keyword | Definition |
|---|---|
| IWM | Integrated weed management (IWM) is an approach to incorporate multiple weed control techniques throughout the growing season to give producers the best opportunity to control problematic weeds. |
| Host | Hosts are the plants that form relationships with beneficial microorganisms and help them colonize. |
| Pathogen | A disease-causing organism. |
| Herbigation | Herbigation is an effective method of applying herbicides through irrigation systems. |
| Maximum residue levels (MRL) | Maximum Residue Limit (MRL) is the maximum allowed limit of pesticide residue in food or feed obtained from plants and animals. |
| IoT | The Internet of Things (IoT) is a network of interconnected devices that connect and exchange data with other IoT devices and the cloud. |
| Herbicide-tolerant varieties (HTVs) | Herbicide-tolerant varieties are plant species that have been genetically engineered to be resistant to herbicides used on crops. |
| Chemigation | Chemigation is a method of applying pesticides to crops through an irrigation system. |
| Crop Protection | Crop protection is a method of protecting crop yields from different pests, including insects, weeds, plant diseases, and others that cause damage to agricultural crops. |
| Seed Treatment | Seed treatment helps to disinfect seeds or seedlings from seed-borne or soil-borne pests. Crop protection chemicals, such as fungicides, insecticides, or nematicides, are commonly used for seed treatment. |
| Fumigation | Fumigation is the application of crop protection chemicals in gaseous form to control pests. |
| Bait | A bait is a food or other material used to lure a pest and kill it through various methods, including poisoning. |
| Contact Fungicide | Contact pesticides prevent crop contamination and combat fungal pathogens. They act on pests (fungi) only when they come in contact with the pests. |
| Systemic Fungicide | A systemic fungicide is a compound taken up by a plant and then translocated within the plant, thus protecting the plant from attack by pathogens. |
| Mass Drug Administration (MDA) | Mass drug administration is the strategy to control or eliminate many neglected tropical diseases. |
| Mollusks | Mollusks are pests that feed on crops, causing crop damage and yield loss. Mollusks include octopi, squid, snails, and slugs. |
| Pre-emergence Herbicide | Preemergence herbicides are a form of chemical weed control that prevents germinated weed seedlings from becoming established. |
| Post-emergence Herbicide | Postemergence herbicides are applied to the agricultural field to control weeds after emergence (germination) of seeds or seedlings. |
| Active Ingredients | Active ingredients are the chemicals in pesticide products that kill, control, or repel pests. |
| United States Department of Agriculture (USDA) | The Department of Agriculture provides leadership on food, agriculture, natural resources, and related issues. |
| Weed Science Society of America (WSSA) | The WSSA, a non-profit professional society, promotes research, education, and extension outreach activities related to weeds. |
| Suspension concentrate | Suspension concentrate (SC) is one of the formulations of crop protection chemicals with solid active ingredients dispersed in water. |
| Wettable powder | A wettable powder (WP) is a powder formulation that forms a suspension when mixed with water prior to spraying. |
| Emulsifiable concentrate | Emulsifiable concentrate (EC) is a concentrated liquid formulation of pesticide that needs to be diluted with water to create a spray solution. |
| Plant-parasitic nematodes | Parasitic Nematodes feed on the roots of crops, causing damage to the roots. These damages allow for easy plant infestation by soil-borne pathogens, which results in crop or yield loss. |
| Australian Weeds Strategy (AWS) | The Australian Weeds Strategy, owned by the Environment and Invasives Committee, provides national guidance on weed management. |
| Weed Science Society of Japan (WSSJ) | WSSJ aims to contribute to the prevention of weed damage and the utilization of weed value by providing the chance for research presentation and information exchange. |


Research Methodology
Mordor Intelligence follows a four-step methodology in all our reports.
- Step-1: Identify Key Variables: In order to build a robust forecasting methodology, the variables and factors identified in Step-1 are tested against available historical market numbers. Through an iterative process, the variables required for market forecast are set and the model is built on the basis of these variables.
- Step-2: Build a Market Model: Market-size estimations for the forecast years are in nominal terms. Inflation is not a part of the pricing, and the average selling price (ASP) is kept constant throughout the forecast period.
- Step-3: Validate and Finalize: In this important step, all market numbers, variables and analyst calls are validated through an extensive network of primary research experts from the market studied. The respondents are selected across levels and functions to generate a holistic picture of the market studied.
- Step-4: Research Outputs: Syndicated Reports, Custom Consulting Assignments, Databases & Subscription Platforms


