Africa Herbicide Market Size and Share
Market Overview
| Study Period | 2018 - 2031 |
|---|---|
| Forecast Data Period | 2026 - 2031 |
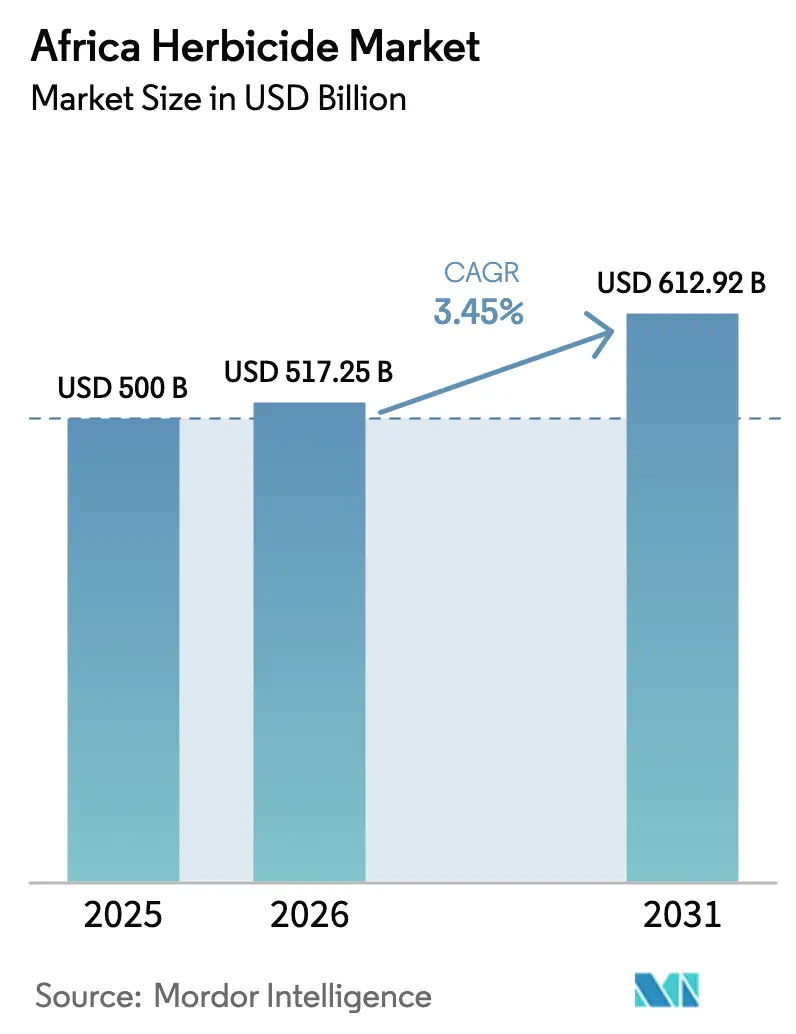
| Base Year Market Size (2025) | USD 500 Billion |
| Market Size (2026) | USD 517.25 Billion |
| Market Size (2031) | USD 612.92 Billion |
| Growth Rate (2026 - 2031) | 3.45% CAGR |
| Market Concentration | Medium |
Major Players *Disclaimer: Major Players sorted in no particular order Image © Mordor Intelligence. Reuse requires attribution under CC BY 4.0. | |
Africa Herbicide Market Analysis by Mordor Intelligence
Africa herbicide market size in 2026 is estimated at USD 517.25 million, growing from 2025 value of USD 500 million with 2031 projections showing USD 612.92 million, growing at 3.45% CAGR over 2026-2031. Demand growth is shaped by the continent’s push for higher farm productivity, widening adoption of conservation-tillage systems, and the need to comply with progressively stricter residue limits set by regional and export-destination regulators. Soil treatment uses lead to current demand because season-long pre-emergence control lowers in-season labor and machinery costs for smallholders. Grains and cereals drive volume, yet export-oriented horticulture is steering a pivot toward newer Europe-approved active ingredients. Competitive intensity remains moderate as the top five suppliers command modest share of revenue, letting them exploit scale advantages while still leaving space for price-driven generics to expand. The gradual roll-out of drone-based spray services is another notable catalyst because it gives sub-hectare farmers timely field coverage at that rival manual weeding.
Key Report Takeaways
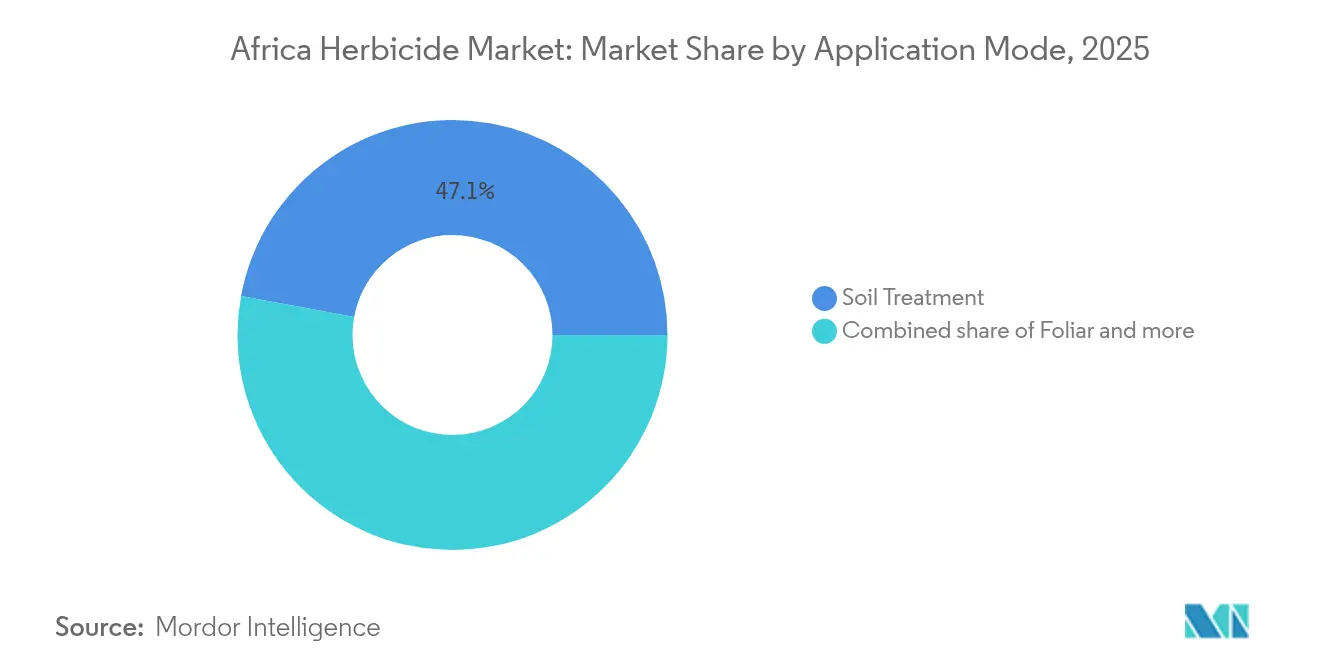
- By application mode, soil treatment captured 47.10% of the Africa herbicide market share in 2025 while also recording the highest projected CAGR at 3.75% through 2031.
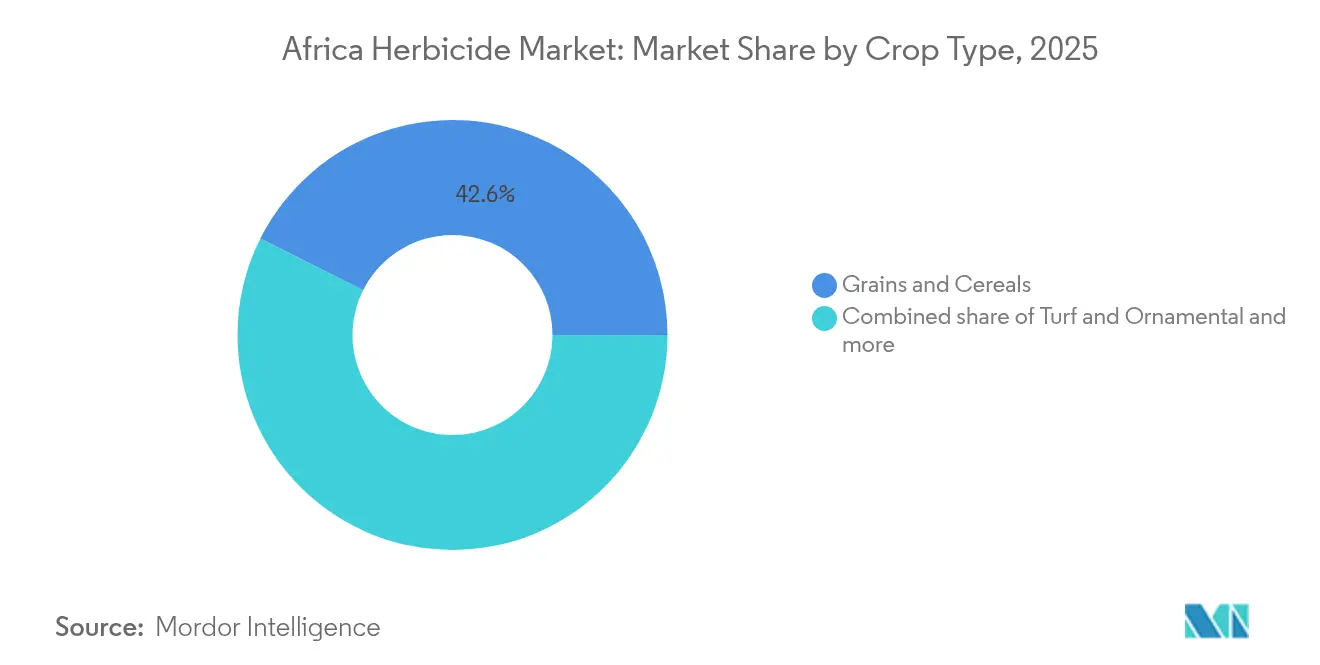
- By crop type, grains and cereals held 42.60% of the Africa herbicide market size in 2025, Turf and Ornamental is forecast to expand at a 3.85% CAGR between 2026 and 2031.
- By geography, South Africa accounted for 12.35% revenue in 2025 and is advancing at a 6.15% CAGR to 2031, the fastest among tracked countries.
Note: Market size and forecast figures in this report are generated using Mordor Intelligence’s proprietary estimation framework, updated with the latest available data and insights as of 2026.
Africa Herbicide Market Trends and Insights
Drivers Impact Analysis*
| Driver | (~) % Impact on CAGR Forecast | Geographic Relevance | Impact Timeline |
|---|---|---|---|
| Rising food-security pressure and need for higher yields | +0.8% | Most of Sub-Saharan Africa | Long term (≥ 4 years) |
| Adoption of herbicide-tolerant genetically modified crops | +0.6% | South Africa, Kenya, and Nigeria | Medium term (2-4 years) |
| Conservation-tillage expansion driving soil-active herbicides | +0.5% | South Africa, Kenya,and Ghana | Medium term (2-4 years) |
| Switch to Europe-approved actives for export-oriented horticulture | +0.4% | South Africa, Kenya, Morocco, and Côte d’Ivoire | Short term (≤ 2 years) |
| Rapid rise of drone-based spray service providers | +0.3% | Kenya, South Africa, and Nigeria | Short term (≤ 2 years) |
| Local generic active-ingredient manufacturing capacity growth | +0.2% | Nigeria, Egypt, and South Africa | Long term (≥ 4 years) |
| Source: Mordor Intelligence | |||


Rising Food-Security Pressure and Need for Higher Yields
Population growth and shrinking arable land per capita are accelerating herbicide adoption across Africa's agricultural systems. The continent's population is projected to double by 2050 while climate variability reduces reliable growing seasons, creating an imperative for yield intensification that favors chemical weed control over labor-intensive manual methods. This demographic pressure intersects with urbanization trends that draw agricultural labor to cities, making herbicides essential for maintaining crop productivity with fewer farm workers. Export market opportunities for African agricultural commodities further incentivize farmers to adopt herbicide technologies that ensure consistent quality and timing of harvests. The food security mandate becomes particularly acute in conflict-affected regions where agricultural disruption threatens regional stability, positioning herbicides as strategic inputs for maintaining agricultural resilience.
Adoption of Herbicide-Tolerant Genetically Modified Crops
Genetically modified crop expansion in Southern and Eastern Africa is creating dedicated herbicide demand channels that bypass traditional product competition dynamics. South Africa's established HB4 soybean and maize cultivation, with regulatory approvals extending to Brazil, Paraguay, and the United States, demonstrates how trait-herbicide integration can lock in market share for specific active ingredients. Kenya's pending regulatory review of genetically modified crop cultivation and Nigeria's advancing biotechnology framework suggest that herbicide-tolerant traits will expand beyond South Africa's current dominance. This technological shift enables farmers to apply broad-spectrum herbicides over the crop canopy without phytotoxicity concerns, simplifying weed management while reducing labor costs. The trait-herbicide bundling also creates switching costs that enhance customer retention for seed-chemical integrated suppliers.
Conservation-Tillage Expansion Driving Soil-Active Herbicides
No-till and reduced-tillage adoption across Africa's grain production systems is reshaping herbicide demand toward pre-emergence soil-active chemistries. Conservation agriculture programs supported by FAO and national extension services promote soil health benefits that require herbicides to replace mechanical weed control traditionally provided by tillage operations. Drought resilience becomes a critical driver as conservation tillage preserves soil moisture, making herbicide-enabled no-till systems attractive in water-stressed regions. The technology transfer occurs through farmer field schools and demonstration plots that showcase the yield advantages of integrated soil-herbicide management. Higher upfront herbicide costs compared to tillage create adoption barriers for resource-constrained smallholders, requiring innovative financing mechanisms or subsidized access programs.
Switch to Europe-Approved Actives for Export-Oriented Horticulture
Export market access requirements are forcing African growers to abandon locally registered herbicides in favor of Europe-approved active ingredients with established maximum residue limits. This regulatory arbitrage creates premium pricing opportunities for multinational suppliers with comprehensive Europe dossiers while disadvantaging generic manufacturers focused on domestic markets. Horticulture exporters in Kenya, South Africa, and Morocco face immediate compliance pressures as Europe importers increasingly require documentation of pesticide application records and residue testing certificates. The shift accelerates the adoption of newer chemistry platforms with favorable toxicological profiles, even at higher per-hectare costs, because export price premiums justify the input investment.
Restraints Impact Analysis*
| Restraint | (~) % Impact on CAGR Forecast | Geographic Relevance | Impact Timeline |
|---|---|---|---|
| Tightening toxic-active regulations (e.g., paraquat phase-outs) | -0.4% | Kenya, South Africa, ECOWAS ( Economic Community of West African States) | Short term (≤ 2 years) |
| Escalating herbicide-resistant weed populations | -0.3% | South Africa, Kenya, and Nigeria | Medium term (2-4 years) |
| Sub-hectare farm fragmentation limiting application scale | -0.2% | Most of Sub-Saharan Africa | Long term (≥ 4 years) |
| Proliferation of counterfeit and illegal herbicide products | -0.2% | West and East Africa trade corridors | Medium term (2-4 years) |
| Source: Mordor Intelligence | |||
Tightening Toxic-Active Regulations
Regulatory restrictions on hazardous herbicide actives are constraining product availability while increasing compliance costs for manufacturers and distributors. Kenya's November 2024 ban on open-field use of thiamethoxam and abamectin, followed by the May 2025 prohibition of 77 highly hazardous pesticide products, including diuron, establishes a regulatory precedent that neighboring markets. South Africa's implementation of Prior Informed Consent Procedure Regulations in October 2024, with penalties up to ZAR 10 million (USD 0.55 million) for non-compliance, demonstrates the financial risks associated with regulatory violations [1]Source: GPC Gateway, “South Africa Strengthens Chemical Trade Regulations,” gpcgateway.com. The regulatory tightening forces manufacturers to reformulate products or seek derogations for continued restricted use, as evidenced by ADAMA's January 2025 applications for linuron and emamectin benzoate in South Africa.
Escalating Herbicide-Resistant Weed Populations
Glyphosate-resistant weeds, including Conyza and Amaranthus species, are spreading across African cropping systems, forcing farmers to adopt more expensive herbicide rotation strategies. This biological pressure increases per-hectare input costs while reducing the efficacy of single-mode-of-action products that previously provided reliable weed control. The resistance evolution accelerates in intensive cropping systems where repeated glyphosate applications create selection pressure for resistant biotypes. Farmers respond by tank-mixing multiple herbicides or switching to pre-emergence soil-active products, increasing total herbicide expenditure per growing season.
*Our forecasts treat driver/restraint impacts as directional, not additive. The impact forecasts reflect baseline growth, mix effects, and variable interactions.
Segment Analysis
By Application Mode: Soil Treatment Dominates Pre-Emergence Control
Soil treatment applications lead the Africa herbicide market with a 47.10% share in 2025, reflecting the agronomic shift toward conservation agriculture and no-till farming systems across the continent. This segment also demonstrates the fastest growth at 3.75% CAGR through 2031, driven by drought resilience benefits and labor cost advantages over mechanical cultivation. Pre-emergence soil-active herbicides provide season-long weed control that reduces the need for multiple post-emergence applications, making them particularly attractive for resource-constrained farmers. The technology adoption accelerates through farmer field schools and demonstration plots supported by international development organizations promoting climate-smart agriculture practices.
This segment enables effective weed control in the early growth stages by creating a chemical barrier in the soil that prevents weed seed germination. The segment's prominence can be attributed to its proactive approach in targeting weed species during their initial growth phases, particularly in intensive agricultural practices and no-tillage systems. Soil treatment herbicides are particularly effective in controlling deep-rooted weeds, with products like tebuthiuron demonstrating strong results in industrial crops. The segment is projected to maintain its market leadership while growing at driven by increasing adoption among farmers who recognize its benefits in minimizing the need for additional herbicide applications and achieving cost savings in crop production.


By Crop Type: Grains Drive Volume While Specialty Crops Command Premiums
Grains and cereals command 42.60% market share in 2025, reflecting their dominance in African agricultural systems and the scale economies that support herbicide adoption in staple crop production. Maize, wheat, and rice cultivation across diverse agroecological zones creates consistent demand for broad-spectrum herbicides that control grass and broadleaf weeds without crop injury. The segment's dominance is further reinforced by the critical challenge of weed control in grain cultivation, where weeds can cause potential yield losses of up to 34% in cereal crops. Farmers increasingly rely on systemic herbicides as their primary method of weed control, particularly in maize cultivation, where various weed species, especially Striga spp., can cause up to 100% yield losses under highly infested conditions. The adoption of monoculture practices and herbicide-resistant cultivars has further intensified the use of herbicides in grain and cereal production across Africa.
The Turf and Ornamental segment is projected to experience the highest growth rate of approximately 3.85% CAGR through 2031. This accelerated growth is attributed to the increasing demand for herbicides in maintaining aesthetic landscapes and controlling weeds in ornamental plant cultivation. The segment's growth is particularly driven by the rising adoption of selective herbicides for efficient weed control in turf management, ensuring the maintenance of beautiful landscapes and healthy growth of ornamental plants. The effectiveness of both pre-emergent and post-emergent herbicides in controlling perennial grasses and various weed species has made them increasingly popular in this segment. The sector's expansion is further supported by the development of selective herbicides that can target specific weed species without harming desired ornamental plants, promoting healthy growth and maintaining vibrant appearances in landscaping applications.
Geography Analysis
South Africa maintains market leadership with a 12.35% share in 2025 while demonstrating the fastest regional growth at a 6.15% CAGR through 2031, reflecting its advanced agricultural infrastructure and established regulatory framework that facilitates herbicide adoption. The country's commercial farming sector drives demand for sophisticated herbicide technologies, including pre-emergence soil actives and herbicide-tolerant GM crop systems. Regulatory harmonization with international standards, evidenced by the January 2025 implementation of Prior Informed Consent procedures aligned with the Rotterdam Convention, positions South Africa as a gateway market for multinational suppliers seeking African expansion.
The rest of Africa encompasses diverse markets with varying agricultural development levels and regulatory maturity. Nigeria represents the largest population and agricultural potential but faces infrastructure constraints and currency volatility that complicate herbicide supply chains. Kenya's proactive regulatory stance, including the May 2025 ban of 77 hazardous pesticide products, signals alignment with international safety standards while creating opportunities for suppliers of alternative chemistries . The regional dynamics reflect broader trends toward agricultural modernization and food security investments supported by international development organizations. integECOWAS (Economic Community of West African States) and SADC (Southern African Development Community) regional initiatives facilitate cross-border trade while promoting regulatory harmonization that reduces market entry barriers for established suppliers. The African Continental Free Trade Area implementation creates opportunities for regional supply chain optimization while the African Union's Food Safety Agency statute adopted in March 2025 establishes continental frameworks for pesticide regulation and trade facilitation .
Competitive Landscape
The Africa herbicide market exhibits moderate concentration, with the top players including Syngenta Group, Corteva Agriscience, Bayer AG, BASF SE, and FMC Corporation. These companies maintain their market positions through comprehensive product portfolios spanning various crop protection chemical solutions, including selective and non-selective herbicides. The market structure shows moderate consolidation, with the top players accounting for a significant portion of the market share while maintaining strong competition among themselves. These companies have established manufacturing facilities and research centers across strategic locations in Africa to better serve local market needs and ensure product availability.
The market has witnessed several strategic acquisitions and mergers aimed at expanding product portfolios and strengthening regional presence. Major players have acquired local companies and assets to enhance their distribution capabilities and gain access to new markets within Africa. These consolidation activities have helped companies achieve economies of scale, improve operational efficiency, and expand their customer base. The trend of strategic partnerships between global players and local distributors has been instrumental in improving market reach and providing better technical support to farmers.
The regulatory influence of national pesticide boards and emerging continental frameworks like the African Union's Food Safety Agency statute will increasingly shape competitive dynamics by standardizing approval processes and residue limits across regional markets. Technology adoption, particularly drone-based application services and digital advisory platforms, represents a key battleground where companies can differentiate their offerings.
Africa Herbicide Industry Leaders
Syngenta Group
Corteva Agriscience
Bayer AG
BASF SE
FMC Corporation
- *Disclaimer: Major Players sorted in no particular order

Recent Industry Developments
- February 2025: UPL Corp Southern Africa successfully launched its latest herbicide, Winger 850 WG, at a grand event held in Cape Town. The new product is a residual, soil-applied, pre-emergent herbicide designed for broad-spectrum grass weed control, featuring 850g of Pyroxasulfone (Isoxazoline) as its active ingredient.
- January 2023: Bayer formed a new partnership with Oerth Bio to enhance crop protection technology and create more eco-friendly crop protection solutions.
- August 2022: BASF and Corteva Agriscience collaborated to provide soybean farmers with the weed control of the future. By working together, BASF and Corteva aim to satisfy farmers' demand for specialized weed control solutions that are distinct from those that are currently available or being developed.


Africa Herbicide Market Report Scope
Chemigation, Foliar, Fumigation, Soil Treatment are covered as segments by Application Mode. Commercial Crops, Fruits & Vegetables, Grains & Cereals, Pulses & Oilseeds, Turf & Ornamental are covered as segments by Crop Type. South Africa are covered as segments by Country.| Chemigation |
| Foliar |
| Fumigation |
| Soil Treatment |
| Commercial Crops |
| Fruits and Vegetables |
| Grains and Cereals |
| Pulses and Oilseeds |
| Turf and Ornamental |
| South Africa |
| Rest of Africa |
| Application Mode | Chemigation |
| Foliar | |
| Fumigation | |
| Soil Treatment | |
| Crop Type | Commercial Crops |
| Fruits and Vegetables | |
| Grains and Cereals | |
| Pulses and Oilseeds | |
| Turf and Ornamental | |
| Country | South Africa |
| Rest of Africa |


Market Definition
- Function - Herbicides are chemicals used to control or prevent weeds from preventing crop growth and yield loss.
- Application Mode - Foliar, Seed Treatment, Soil Treatment, Chemigation, and Fumigation are the different type of application modes through which crop protection chemicals are applied to the crops.
- Crop Type - This represents the consumption of crop protection chemicals by Cereals, Pulses, Oilseeds, Fruits, Vegetables, Turf, and Ornamental crops.
| Keyword | Definition |
|---|---|
| IWM | Integrated weed management (IWM) is an approach to incorporate multiple weed control techniques throughout the growing season to give producers the best opportunity to control problematic weeds. |
| Host | Hosts are the plants that form relationships with beneficial microorganisms and help them colonize. |
| Pathogen | A disease-causing organism. |
| Herbigation | Herbigation is an effective method of applying herbicides through irrigation systems. |
| Maximum residue levels (MRL) | Maximum Residue Limit (MRL) is the maximum allowed limit of pesticide residue in food or feed obtained from plants and animals. |
| IoT | The Internet of Things (IoT) is a network of interconnected devices that connect and exchange data with other IoT devices and the cloud. |
| Herbicide-tolerant varieties (HTVs) | Herbicide-tolerant varieties are plant species that have been genetically engineered to be resistant to herbicides used on crops. |
| Chemigation | Chemigation is a method of applying pesticides to crops through an irrigation system. |
| Crop Protection | Crop protection is a method of protecting crop yields from different pests, including insects, weeds, plant diseases, and others that cause damage to agricultural crops. |
| Seed Treatment | Seed treatment helps to disinfect seeds or seedlings from seed-borne or soil-borne pests. Crop protection chemicals, such as fungicides, insecticides, or nematicides, are commonly used for seed treatment. |
| Fumigation | Fumigation is the application of crop protection chemicals in gaseous form to control pests. |
| Bait | A bait is a food or other material used to lure a pest and kill it through various methods, including poisoning. |
| Contact Fungicide | Contact pesticides prevent crop contamination and combat fungal pathogens. They act on pests (fungi) only when they come in contact with the pests. |
| Systemic Fungicide | A systemic fungicide is a compound taken up by a plant and then translocated within the plant, thus protecting the plant from attack by pathogens. |
| Mass Drug Administration (MDA) | Mass drug administration is the strategy to control or eliminate many neglected tropical diseases. |
| Mollusks | Mollusks are pests that feed on crops, causing crop damage and yield loss. Mollusks include octopi, squid, snails, and slugs. |
| Pre-emergence Herbicide | Preemergence herbicides are a form of chemical weed control that prevents germinated weed seedlings from becoming established. |
| Post-emergence Herbicide | Postemergence herbicides are applied to the agricultural field to control weeds after emergence (germination) of seeds or seedlings. |
| Active Ingredients | Active ingredients are the chemicals in pesticide products that kill, control, or repel pests. |
| United States Department of Agriculture (USDA) | The Department of Agriculture provides leadership on food, agriculture, natural resources, and related issues. |
| Weed Science Society of America (WSSA) | The WSSA, a non-profit professional society, promotes research, education, and extension outreach activities related to weeds. |
| Suspension concentrate | Suspension concentrate (SC) is one of the formulations of crop protection chemicals with solid active ingredients dispersed in water. |
| Wettable powder | A wettable powder (WP) is a powder formulation that forms a suspension when mixed with water prior to spraying. |
| Emulsifiable concentrate | Emulsifiable concentrate (EC) is a concentrated liquid formulation of pesticide that needs to be diluted with water to create a spray solution. |
| Plant-parasitic nematodes | Parasitic Nematodes feed on the roots of crops, causing damage to the roots. These damages allow for easy plant infestation by soil-borne pathogens, which results in crop or yield loss. |
| Australian Weeds Strategy (AWS) | The Australian Weeds Strategy, owned by the Environment and Invasives Committee, provides national guidance on weed management. |
| Weed Science Society of Japan (WSSJ) | WSSJ aims to contribute to the prevention of weed damage and the utilization of weed value by providing the chance for research presentation and information exchange. |


Research Methodology
Mordor Intelligence follows a four-step methodology in all our reports.
- Step-1: Identify Key Variables: In order to build a robust forecasting methodology, the variables and factors identified in Step-1 are tested against available historical market numbers. Through an iterative process, the variables required for market forecast are set and the model is built on the basis of these variables.
- Step-2: Build a Market Model: Market-size estimations for the forecast years are in nominal terms. Inflation is not a part of the pricing, and the average selling price (ASP) is kept constant throughout the forecast period.
- Step-3: Validate and Finalize: In this important step, all market numbers, variables and analyst calls are validated through an extensive network of primary research experts from the market studied. The respondents are selected across levels and functions to generate a holistic picture of the market studied.
- Step-4: Research Outputs: Syndicated Reports, Custom Consulting Assignments, Databases & Subscription Platforms


