Europe Foodservice Market Size and Share
Market Overview
| Study Period | 2021 - 2031 |
|---|---|
| Forecast Data Period | 2026 - 2031 |
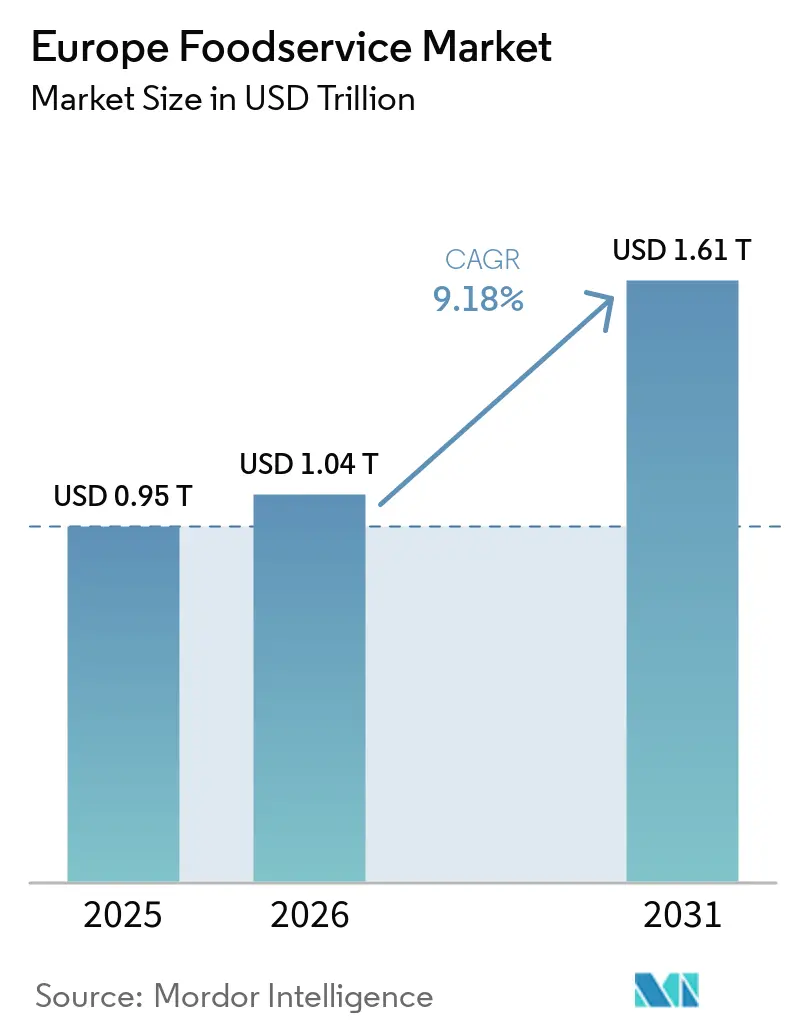
| Base Year Market Size (2025) | USD 0.95 Trillion |
| Market Size (2026) | USD 1.04 Trillion |
| Market Size (2031) | USD 1.61 Trillion |
| Growth Rate (2026 - 2031) | 9.18% CAGR |
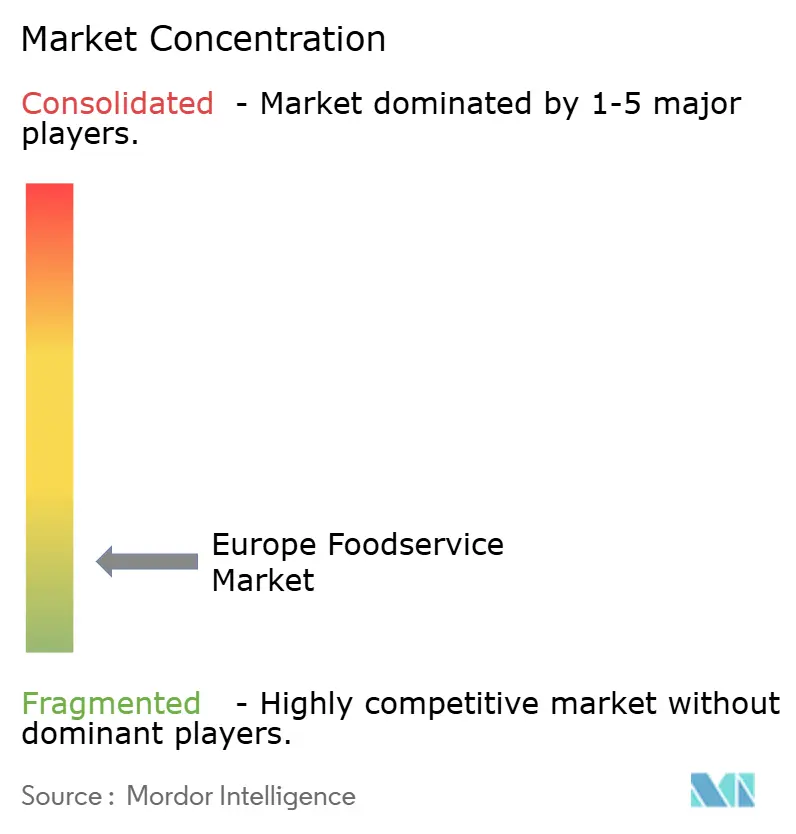
| Market Concentration | Low |
Major Players *Disclaimer: Major Players sorted in no particular order Image © Mordor Intelligence. Reuse requires attribution under CC BY 4.0. | |
Europe Foodservice Market Analysis by Mordor Intelligence
Europe Foodservice Market size market size in 2026 is estimated at USD 1.04 trillion, growing from 2025 value of USD 0.95 trillion with 2031 projections showing USD 1.61 trillion, growing at 9.18% CAGR over 2026-2031. The market demonstrates robust expansion due to consumers increasingly seeking convenient dining solutions that align with their busy lifestyles. The harmonization of regulations across the European Union has created a more unified operating environment, while restaurants and food establishments continuously innovate their menus to incorporate sustainable practices and health-focused offerings. Foodservice businesses that have successfully implemented user-friendly digital ordering platforms, established transparent ingredient sourcing practices, and developed diverse menu options for the growing flexitarian consumer base are experiencing substantial growth opportunities. This shift reflects a fundamental change in consumer behavior towards convenient, on-the-go dining solutions. The competitive landscape remains intense as standardized food safety regulations make cross-border expansion more accessible for larger operators. However, these same regulations increase operational compliance costs for smaller establishments, ultimately driving market consolidation within the European foodservice industry.
Key Report Takeaways
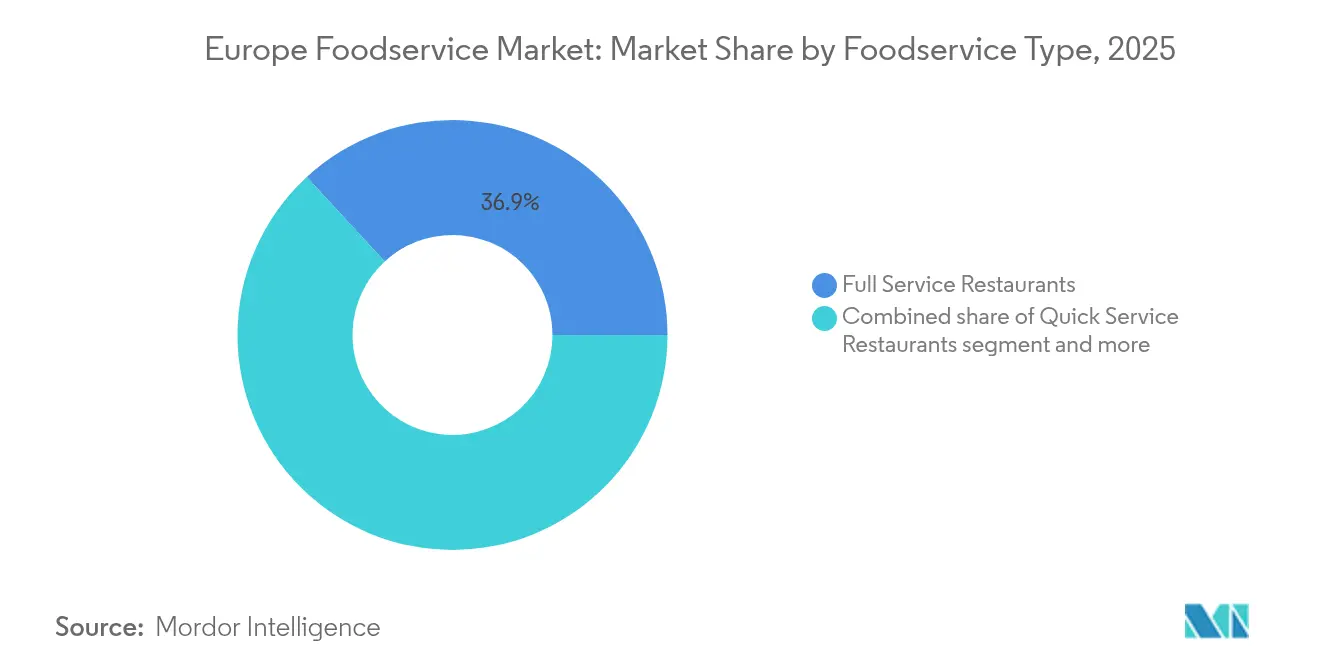
- By foodservice type, Full Service Restaurants led with 36.85% of Europe Foodservice Market share in 2025, while Cloud Kitchens posted the fastest 16.62% CAGR through 2031.
- By outlet, Independent Outlets captured 67.10% of the Europe Foodservice Market size in 2025, but Chained Outlets are expanding at a 10.12% CAGR, signaling steady consolidation.
- By location, Standalone venues represented 73.40% of current spending, yet Travel locations are forecast to advance at 10.22% CAGR through 2031 as mobility rebounds.
- By service type, Dine-in retained 52.15% of revenue in 2025, whereas Delivery is growing at 10.74% CAGR, underscoring a structural preference for convenience.
- By country, Spain commanded 17.32% of consumption in 2025 and Netherlands is the growth leader with 15.35% CAGR, buoyed by seamless digital infrastructure and plant-based enthusiasm.
Note: Market size and forecast figures in this report are generated using Mordor Intelligence’s proprietary estimation framework, updated with the latest available data and insights as of 2026.
Europe Foodservice Market Trends and Insights
Drivers Impact Analysis*
| Driver | (~)% Impact on CAGR Forecast | Geographic Relevance | Impact Timeline |
|---|---|---|---|
| Increased demand for convenience and ready-to-eat meals | +2.1% | Global, with strongest uptake in Netherlands, Germany, United Kingdom | Short term (≤ 2 years) |
| Surge in health consciousness and demand for healthy menu options | +1.8% | EU core markets, spillover to Eastern Europe | Medium term (2-4 years) |
| Popularity of sustainable and locally sourced ingredients | +1.4% | Nordic countries, Germany, France, expanding to Southern Europe | Long term (≥ 4 years) |
| Rise in plant-based, vegan, and vegetarian menu choices | +1.6% | Netherlands, Germany, United Kingdom, with growing adoption in Italy, Spain | Medium term (2-4 years) |
| Growing popularity of ethnic and international cuisines | +1.2% | Major metropolitan areas across Europe, strongest in multicultural cities | Short term (≤ 2 years) |
| Demand for allergen transparency and ingredient traceability | +0.9% | EU-wide due to regulatory harmonization, particularly Germany, France | Long term (≥ 4 years) |
| Source: Mordor Intelligence | |||


Increased Demand for Convenience and Ready-to-Eat Meals
European consumers increasingly seek efficient dining solutions that align with modern urban lifestyles and hybrid work arrangements established in the post-pandemic environment. The rapid expansion of grab-and-go concepts across major European cities demonstrates strong market acceptance, with Germany emerging as a frontrunner through digital meal solutions combining nutritional information with swift service delivery [1]Source: Federal Ministry of Food and Agriculture Germany, “Digital Food Service Trends 2024,” BMEL.DE. Quick-service establishments have evolved by incorporating premium ingredients and professionally crafted menus to distinguish themselves from conventional fast food offerings, establishing a distinct market segment that commands higher transaction values while maintaining operational efficiency. Cloud Kitchen operators have capitalized on this transformation by optimizing their facilities for delivery operations without sacrificing food quality or presentation standards. The emphasis on convenience encompasses reliable pricing structures, quality consistency, and streamlined digital ordering platforms that enhance the overall customer experience.
Surge in Health Consciousness and Demand for Healthy Menu Options
Menu reformulation across European foodservice focuses on health-oriented offerings, as operators implement nutritional analysis systems and use wellness-certified ingredients to meet the demand for functional foods. The European Food Safety Authority's 2024 nutrition labeling requirements have increased transparency, requiring restaurants to display caloric content, allergen information, and nutritional benefits in their menus [2]Source: European Food Safety Authority, “Food Safety and Hygiene Regulations,” EFSA.EUROPA.EU. The Nordic markets have expanded their protein options to include insect-based ingredients, while Mediterranean operators focus on traditional healthy ingredients such as olive oil, legumes, and whole grains. The café segment, particularly in the Netherlands and Denmark, has experienced substantial growth in functional beverages and adaptogenic ingredients, with consumers demonstrating willingness to accept higher prices for products offering health benefits. This market development creates significant business opportunities for foodservice operators who can successfully combine nutritional value with appealing taste profiles in their menu offerings.
Popularity of Sustainable and Locally Sourced Ingredients
The European foodservice industry is undergoing a significant transformation as businesses restructure their supply chains to meet rigorous sustainability requirements. Companies are implementing comprehensive strategies to reduce their carbon footprints while responding to growing consumer expectations for environmental stewardship. The European Green Deal's farm-to-fork strategy has become a fundamental driver of procurement decisions across restaurant segments. Restaurants are establishing meaningful partnerships with local suppliers, which not only reduces transportation costs but also enables them to share authentic stories about their ingredients' origins [3]Source: European Commission, “Farm-to-Fork Strategy,” EC.EUROPA.EU. Restaurants are building competitive advantages through well-planned seasonal menu rotations that celebrate regional specialties. By developing direct relationships with farmers, businesses are successfully reducing ingredient costs and eliminating intermediary distribution expenses. The implementation of carbon footprint labeling programs in France and Germany has revealed that consumers actively support and are prepared to pay premium prices for environmentally responsible menu options. This market behavior creates valuable opportunities for restaurants investing in transparent supply chain systems. Businesses are realizing tangible benefits through comprehensive waste management strategies. Their composting programs and partnerships with food redistribution organizations are generating measurable cost savings while strengthening brand reputation among environmentally conscious consumers throughout European markets.
Rise in Plant-Based, Vegan, and Vegetarian Menu Choices
Plant-based menu offerings are expanding beyond dietary accommodations to appeal to flexitarian consumers seeking variety and health benefits. The Netherlands leads European plant-based adoption, with restaurants featuring dedicated vegan sections in 2024. Traditional meat-focused markets like Germany have recorded significant growth in plant-based menu items. Protein innovation has evolved beyond conventional substitutes to include fermented alternatives, legume-based preparations, and new plant proteins that deliver authentic textures and flavors. Restaurants positioning plant-based options as premium offerings achieve higher margins compared to standard menu items, as successful operators present vegan dishes as culinary specialties rather than dietary alternatives. Operators who develop plant-based culinary expertise and establish relationships with innovative protein producers gain competitive advantages in the market.
Restraints Impact Analysis*
| Restraint | (~)% Impact on CAGR Forecast | Geographic Relevance | Impact Timeline |
|---|---|---|---|
| Stringent and evolving food safety and hygiene regulations | -1.3% | EU-wide, with stricter enforcement in Germany, France, Netherlands | Long term (≥ 4 years) |
| Allergens, labeling, and nutrition compliance burdens | -0.8% | EU harmonized markets, particularly affecting smaller operators | Medium term (2-4 years) |
| Variability in local food laws, health codes, and licensing | -0.6% | Multi-market operators across EU member states | Medium term (2-4 years) |
| Complexity of cross-border regulations within Europe | -0.5% | Chain operators expanding across EU borders | Long term (≥ 4 years) |
| Source: Mordor Intelligence | |||
Stringent and Evolving Food Safety and Hygiene Regulations
The European Union's increasingly stringent food safety standards and sophisticated enforcement mechanisms have led to higher regulatory compliance costs, particularly affecting smaller operators. The Hazard Analysis and Critical Control Points (HACCP) framework requires extensive documentation and monitoring systems, resulting in annual compliance costs of EUR 15,000-25,000 for independent restaurants. The 2024 digital traceability requirements now mandate electronic systems for ingredient sourcing, temperature monitoring, and staff training documentation, creating operational challenges for traditional establishments using paper-based systems. While cross-border harmonization efforts reduce regulatory complexity for businesses operating across multiple markets, the uniform standards often exceed local requirements and increase operational costs for all participants. These regulatory requirements accelerate market consolidation as smaller operators face difficulties managing compliance investments, while larger chains benefit from economies of scale by implementing standardized systems across multiple locations.
Allergens, Labeling, and Nutrition Compliance Burdens
The European Union's comprehensive allergen disclosure regulations require food service operators to implement robust ingredient tracking systems and conduct thorough staff training programs. Non-compliance results in substantial financial penalties across major European markets, particularly in Germany and France. Independent operators must allocate resources to invest in nutritional analysis software platforms, establish dedicated allergen-free preparation zones, and provide specialized staff training to maintain compliance while ensuring food quality standards. The insurance landscape for operators catering to allergen-sensitive customers underwent notable changes in 2024, with premiums increasing as insurers respond to heightened litigation exposure from cross-contamination incidents. This regulatory environment creates an uneven playing field where chain operators leverage their scale to distribute compliance investments across their network, while independent establishments face mounting pressure on their operational margins due to these fixed regulatory requirements.
*Our forecasts treat driver/restraint impacts as directional, not additive. The impact forecasts reflect baseline growth, mix effects, and variable interactions.
Segment Analysis
By Foodservice Type: Cloud Kitchens Reshape Delivery Economics
Cloud kitchens are experiencing rapid growth with a 16.62% CAGR through 2031, fundamentally transforming the restaurant industry landscape. These delivery-focused operations have successfully reduced overhead costs by eliminating traditional dining areas while substantially improving kitchen productivity. Full-service restaurants currently maintain the dominant market share at 36.85% in 2025 but continue to face mounting operational challenges from escalating labor costs and real estate expenses. In contrast, cloud kitchen models circumvent these challenges through their streamlined operational structure. Quick-service restaurants maintain their strong market position through established brand presence and standardized operations, while cafes and bars continue to attract customers through irreplaceable in-person social experiences that digital platforms cannot replicate.
Cloud kitchen facilities have revolutionized market entry strategies by enabling operators to launch multiple virtual restaurant brands simultaneously. This approach minimizes market entry risk while allowing continuous refinement of menus based on comprehensive delivery performance data. European regulatory bodies have responded to this evolution by classifying cloud kitchens as a separate operational category, implementing specific licensing and inspection requirements distinct from traditional restaurant regulations. The European Food Safety Authority's 2024 guidelines for delivery-only operations have introduced comprehensive standards for temperature control and packaging. These regulations have created significant advantages for professional cloud kitchen operators while establishing substantial barriers to entry for informal delivery services, ensuring higher quality standards across the industry.


By Outlet: Chain Consolidation Accelerates Market Share Gains
Independent outlets currently dominate the market with a 67.10% share in 2025, while chained outlets demonstrate strong growth potential with a 10.12% CAGR through 2031. The chained outlets' success stems from their ability to implement centralized procurement systems, deliver standardized training programs, and invest in technology that reduces operational costs while maintaining consistent service quality across multiple locations.
Independent operators continue to excel in areas such as menu flexibility, deep local market knowledge, and authentic dining experiences that resonate with customers seeking unique culinary experiences. However, these operators face mounting pressures from increasing compliance requirements, rising ingredient costs, and workforce shortages that impact their operations more severely due to their limited scale. This market dynamic has led independent operators to adopt focused strategies that leverage their strengths in local sourcing, chef-driven menus, and community connections - areas where large chains typically find it difficult to compete effectively.
By Locations: Travel Segment Recovery Drives Growth Acceleration
The market landscape shows standalone locations holding a substantial 73.40% market share in 2025, with traditional street-front restaurants and independent establishments forming the backbone of local dining. The travel segment demonstrates remarkable potential with a projected 10.22% CAGR through 2031, as dining establishments in airports, train stations, and highway service areas regain momentum. While retail locations face challenges from e-commerce growth, they are transforming their approach through innovative dining experiences. Similarly, lodging locations benefit from renewed business travel, and leisure locations capitalize on the resurgence of tourism activities.
The transformation in the travel segment reflects more than just recovery from pandemic disruptions - it represents a fundamental shift in how operators approach transport hub dining. Concession operators now focus on elevating the dining experience by introducing premium food concepts that match the quality of standalone restaurants. This evolution includes strategic partnerships with renowned chefs and an emphasis on authentic local cuisine, effectively bringing regional food culture to travelers.

By Service Type: Delivery Growth Transforms Restaurant Operations
The restaurant industry continues to see dine-in service as its cornerstone, maintaining a 52.15% market share in 2025. This demonstrates how customers value the traditional restaurant experience, from the atmosphere to personal service and thoughtfully presented dishes. Meanwhile, the delivery segment is experiencing substantial growth, with an expected CAGR of 10.74% through 2031, as consumers embrace the convenience of home dining. Takeaway service bridges the gap between these options, offering customers the flexibility to pick up their meals without incurring delivery fees or concerns about food temperature during transport.
These diverse service channels have prompted restaurants to adapt their operations comprehensively. Businesses now manage multiple service streams by optimizing their kitchen workflows, packaging methods, and staff deployment. For successful delivery operations, restaurants focus on adapting their menus for transport durability, implementing effective packaging solutions, and reconfiguring kitchen spaces to handle both in-house dining and delivery orders efficiently. Each service type requires its own strategic approach, considering the specific operational needs and customer expectations of the channel.
Geography Analysis
The European foodservice market presents a complex tapestry of regional variations, where cultural heritage, regulatory frameworks, and economic maturity create distinct market conditions. The Spain foodservice market maintains its leadership position in Europe with a 17.32% share in 2025, supported by tourism recovery and a deeply rooted dining culture. The market environment in Spain supports a diverse range of establishments, from traditional tapas bars to contemporary dining concepts. In mature markets like Germany and France, consumers demonstrate sophisticated preferences, demanding high-quality ingredients and transparent nutritional information. These markets also emphasize sustainable sourcing practices, reflecting broader European environmental consciousness. The United Kingdom's foodservice sector continues to demonstrate resilience post-Brexit, adapting to new regulatory requirements while benefiting from its diverse urban populations and well-established multicultural dining landscape.
The Netherlands stands out as a particularly dynamic market, projecting a remarkable 15.35% CAGR through 2031. This growth trajectory is underpinned by sophisticated digital infrastructure that facilitates efficient online ordering and delivery operations. Dutch consumers show progressive attitudes toward plant-based dining options, while government initiatives actively support sustainable food system development. In the Nordic region, countries like Sweden set industry standards through their commitment to sustainability initiatives and widespread adoption of digital payment systems. These practices not only streamline operations but also align with consumer expectations for environmental responsibility. Italy's foodservice market successfully navigates the balance between preserving culinary traditions and embracing modern dining trends, creating opportunities for businesses that can authentically blend innovation with respected food customs.
Eastern European markets within the EU demonstrate accelerated growth patterns, driven by rapid economic development and increasing urbanization. While these markets continue to align their regulatory frameworks with Western European standards, this transition creates both opportunities and compliance considerations for operators. Countries like Poland experience significant market expansion, fueled by rising consumer purchasing power and evolving dining preferences, particularly among urban young professionals. The diverse nature of European markets requires foodservice operators to implement carefully tailored strategies that respect local cultural nuances while leveraging operational efficiencies in procurement, technology implementation, and business practices across various regulatory environments and cultural contexts.
Competitive Landscape
The European foodservice market's highly fragmented nature presents significant opportunities for businesses looking to consolidate operations and implement technology-driven standardization. This fragmentation particularly affects independent operators who face mounting operational pressures. Multinational chains maintain their market position by utilizing economies of scale across procurement, compliance systems, and technology investments, while independent operators struggle with increasing ingredient costs, complex regulatory requirements, and persistent labor shortages that impact their daily operations.
Companies in the market are adapting their strategies to meet evolving consumer demands through integrated omnichannel operations, enhanced sustainability practices, and health-conscious menu development. These initiatives align with European consumer preferences while enabling businesses to achieve operational efficiencies through centralized systems. The market has witnessed the emergence of innovative business models, including cloud kitchen aggregators that optimize delivery operations, plant-based restaurant chains catering to changing dietary preferences, and technology-enabled franchise concepts that reshape traditional restaurant categories through modern customer engagement approaches.
The implementation of digital transformation initiatives enables foodservice operators to gather valuable customer insights, refine menu offerings based on actual consumption data, and develop effective loyalty programs that boost customer retention while reducing acquisition expenses. Under the European Food Safety Authority's updated guidelines, operators who make early investments in comprehensive traceability systems, allergen management protocols, and sustainability certifications gain significant competitive advantages. These regulatory compliance requirements create barriers to entry for smaller competitors who often lack the necessary capital to implement such comprehensive systems.
Europe Foodservice Industry Leaders
AmRest Holdings SE
Avolta
Compass Group PLC
Coop Gruppe Genossenschaft
The Coca-Cola Company
- *Disclaimer: Major Players sorted in no particular order

Recent Industry Developments
- September 2025: Dave's Hot Chicken, a prominent US fast food chain, has formed a strategic exclusive partnership with hospitality company Azzurri Group to expand its presence in the European market through the establishment of a minimum of 180 restaurant locations.
- July 2025: Compass Group PLC announced the acquisition of Vermaat Groep B.V. at an enterprise value of EUR 1.5 billion. Vermaat operates as a premium food services provider in Europe, specializing in customized on-site food concepts, delivery solutions, and retail services. The acquisition of this multi-sector platform positions Compass Group for expanded growth opportunities across European markets.
- May 2024: McDonald's Germany expanded its menu offerings through a strategic partnership with musicians Bill and Tom Kaulitz. The collaboration brings two plant-based options to German consumers: the McPlant Burger and McPlant Nuggets, packaged as signature meal combinations that reflect the artists' preferences.


Europe Foodservice Market Report Scope
Cafes & Bars, Cloud Kitchen, Full Service Restaurants, Quick Service Restaurants are covered as segments by Foodservice Type. Chained Outlets, Independent Outlets are covered as segments by Outlet. Leisure, Lodging, Retail, Standalone, Travel are covered as segments by Location. France, Germany, Italy, Netherlands, Russia, Spain, Switzerland, Turkey, United Kingdom are covered as segments by Country.| Café and Bars | By Cuisine | Bars & Pubs |
| Café | ||
| Juice/Smoothie/Desserts Bars | ||
| Specialist Coffee and Tea Shops | ||
| Cloud Kitchen | ||
| Full Service Restaurants | By Cuisine | Asian |
| European | ||
| Latin American | ||
| Middle Eastern | ||
| North American | ||
| Other FSR Cuisines | ||
| Quick Service Restaurants | By Cuisine | Bakeries |
| Burger | ||
| Ice Cream | ||
| Meat-based Cuisines | ||
| Pizza | ||
| Other QSR Cuisines |
| Chained Outlets |
| Independent Outlets |
| Leisure |
| Lodging |
| Retail |
| Sandalone |
| Travel |
| Dine-in |
| Takeaway |
| Delivery |
| Germany |
| United Kingdom |
| Italy |
| France |
| Spain |
| Netherlands |
| Poland |
| Belgium |
| Sweden |
| Rest of Europe |
| By Foodservice Type | Café and Bars | By Cuisine | Bars & Pubs |
| Café | |||
| Juice/Smoothie/Desserts Bars | |||
| Specialist Coffee and Tea Shops | |||
| Cloud Kitchen | |||
| Full Service Restaurants | By Cuisine | Asian | |
| European | |||
| Latin American | |||
| Middle Eastern | |||
| North American | |||
| Other FSR Cuisines | |||
| Quick Service Restaurants | By Cuisine | Bakeries | |
| Burger | |||
| Ice Cream | |||
| Meat-based Cuisines | |||
| Pizza | |||
| Other QSR Cuisines | |||
| By Outlet | Chained Outlets | ||
| Independent Outlets | |||
| By Locations | Leisure | ||
| Lodging | |||
| Retail | |||
| Sandalone | |||
| Travel | |||
| By Service Type | Dine-in | ||
| Takeaway | |||
| Delivery | |||
| By Country | Germany | ||
| United Kingdom | |||
| Italy | |||
| France | |||
| Spain | |||
| Netherlands | |||
| Poland | |||
| Belgium | |||
| Sweden | |||
| Rest of Europe | |||


Market Definition
- FULL-SERVICE RESTAURANTS - A foodservice establishment where customers are seated at a table, give their order to a server and are served food at a table.
- QUICK SERVICE RESTAURANTS - A foodservice establishment that provides customers convenience, speed, and food offerings at lower prices. Customers usually help themselves and carry their own food to their tables.
- CAFES & BARS - A type of foodservice business that include bars and pubs that are licensed to serve alcoholic drinks for consumption, cafes that serve refreshments and light food items, as well as specialty tea and coffee shops, dessert bars, smoothie bars, and juice bars.
- CLOUD KITCHEN - A foodservice business that utilizes a commercial kitchen for the purpose of preparing food for delivery or takeout only, with no dine-in customers.
| Keyword | Definition |
|---|---|
| Albacore Tuna | It is one of the smallest species of tuna found in the six distinct stocks known globally in the Atlantic, Pacific, and Indian oceans, as well as the Mediterranean Sea. |
| Angus beef | It is beef derived from a specific breed of cattle indigenous to Scotland. It requires certification from the American Angus Association to receive the "Certified Angus Beef" quality mark. |
| Asian cuisine | It includes full-service offerings in restaurants that serve cuisines from cultures such as Chinese, Indian, Korean, Japanese, Bengali, Southeast Asian, etc. |
| Average Order Value | It is the average value of all orders made by the customers at a foodservice establishment. |
| Bacon | It is salted or smoked meat that comes from the back or sides of a pig. |
| Bars & Pubs | It is a drinking establishment that is licensed to serve alcoholic drinks for consumption on the premises. |
| Black Angus | It is beef derived from a black-hided breed of cows that don't have horns. |
| BRC | British Retail Consortium |
| Burger | It is a sandwich consisting of one or more cooked beef patties, placed inside a sliced bread roll or bun roll. |
| Café | It is a foodservice establishment serving various refreshments (mainly coffee) and light meals. |
| Cafes & Bars | It is a type of foodservice business that include bars and pubs that are licensed to serve alcoholic drinks for consumption, cafes that serve refreshments and light food items, as well as specialty tea and coffee shops, dessert bars, smoothie bars, and juice bars. |
| Cappuccino | It is an Italian coffee drink that is traditionally prepared with equal parts double espresso, steamed milk, and steamed milk foam. |
| CFIA | Canadian Food Inspection Agency |
| Chained Outlet | It refers to a foodservice establishment that shares brands, operates in several locations, has central management, and standardized business practices. |
| Chicken Tender | It refers to chicken meat prepared from the pectoralis minor muscles of a chicken bird. |
| Cloud Kitchen | It is a foodservice business that utilizes a commercial kitchen for the purpose of preparing food for delivery or takeout only, with no dine-in customers. |
| Cocktail | It is an alcoholic mixed drink made with either a single spirit or a combination of spirits, mixed with other ingredients such as juices, flavored syrups, tonic water, shrubs, and bitters. |
| Edamame | It is a Japanese dish prepared with soybeans (harvested before they ripen or harden) and cooked in its pod. |
| EFSA | European Food Safety Authority |
| ERS | Economic Research Service of the USDA |
| Espresso | It is a concentrated form of coffee, served in shots. |
| European cuisine | It includes full-service offerings in restaurants that serve cuisines from cultures such as Italian, French, German, English, Dutch, Danish, etc. |
| FDA | Food and Drug Administration |
| Fillet Mignon | It is a cut of meat taken from the smaller end of the tenderloin. |
| Flank Steak | It is a cut of beef steak taken from the flank, which lies forward of the rear quarter of a cow. |
| Foodservice | It refers to the part of the food industry which includes businesses, institutions, and companies which prepare meals outside the home. It includes restaurants, school and hospital cafeterias, catering operations, and many other formats. |
| Franks | Also known as frankfurter or Würstchen, it is a type of highly seasoned smoked sausage popular in Austria and Germany. |
| FSANZ | Food Standards Australia New Zealand |
| FSIS | Food Safety and Inspection Service |
| FSSAI | Food Safety and Standards Authority of India |
| Full service restaurant | It refers to a foodservice establishment where customers are seated at a table, give their order to a server, and are served food at a table. |
| Ghost Kitchen | It refers to a cloud kitchen. |
| GLA | Gross Leasable Area |
| Gluten | It is a family of proteins found in grains, including wheat, rye, spelt, and barley. |
| Grain-fed beef | It is beef derived from cattle that have been fed a diet supplemented with soy and corn and other additives. Grain-fed cows can also be given antibiotics and growth hormones to fatten them up more quickly. |
| Grass-fed beef | It is beef derived from cattle that have only been fed grass as feed. |
| Ham | It refers to the pork meat taken from the leg of a pig. |
| HoReCa | Hotels, Restaurants and Cafes |
| Independent Outlet | It refers to a foodservice establishment that operates with a single outlet or is structured as a small chain with no more than three locations. |
| Juice | It is a drink made from the extraction or pressing of the natural liquid contained in fruit and vegetables. |
| Latin American | It includes full-service offerings in restaurants that serve cuisines from cultures such as Mexican, Brazilian, Argentinian, Colombian, etc. |
| Latte | It is a milk-based coffee that is made up of one or two shots of espresso, steamed milk, and a thin layer of frothed milk. |
| Leisure | It refers to foodservice offered as a part of a recreation business, such as sports arenas, zoos, movie theaters, and museums. |
| Lodging | It refers to foodservice offerings at hotels, motels, guesthouses, holiday homes, etc. |
| Macchiato | It is an espresso coffee drink with a small amount of milk, usually foamed. |
| Meat-based cuisines | This inlcudes food items like fried chicken, steak, ribs, etc. where meat is the primary ingredient for the dish. |
| Middle Eastern cuisine | It includes full-service offerings in restaurants that serve cuisines from cultures such as Arabic, Lebanese, Iranian, Israeli, etc. |
| Mocktail | It is an non-alcoholic mixed drink. |
| Mortadella | It is a large Italian sausage or luncheon meat made of finely hashed or ground heat-cured pork, which incorporates at least 15% small cubes of pork fat. |
| North American | It includes full-service offerings in restaurants that serve cuisines from cultures such as American, Canadian, Caribbean, etc. |
| Pastrami | It refers to a highly seasoned smoked beef, typically served in thin slices. |
| PDO | Protected Designation of Origin: It is the name of a geographical region or specific area that is recognized by official rules to produce certain foods with special characteristics related to location. |
| Pepperoni | It is an American variety of spicy salami made from cured meat. |
| Pizza | It is a dish made typically of flattened bread dough spread with a savory mixture usually including tomatoes and cheese and often other toppings and baked. |
| Primal cuts | It refers to the major sections of the carcass. |
| Quick service restaurant | It refers to a foodservice establishment that provides customers convenience, speed, and food offerings at lower prices. Customers usually help themselves and carry their own food to their tables. |
| Retail | It refers to a foodservice outlet inside a mall. shopping complex or a commercial real estate building, where there are other businesses operating as well. |
| Salami | It is a cured sausage consisting of fermented and air-dried meat. |
| Saturated fat | It is a type of fat in which the fatty acid chains have all single bonds. It is generally considered unhealthy. |
| Sausage | It is a meat product made of finely chopped and seasoned meat, which may be fresh, smoked, or pickled and which is then usually stuffed into a casing. |
| Scallop | It is an edible shellfish that is a mollusk with a ribbed shell in two parts. |
| Seitan | It is a plant-based meat substitute made out of wheat gluten. |
| Self-service kiosk | It refers to a self-order point-of-sale (POS) system through which customers place and pay for their own orders at kiosks, enabling totally contactless and frictionless service. |
| Smoothie | It is a beverage made by placing all the ingredients in a container and processing them together, without removing the pulp. |
| Specialty coffee & tea shops | It refers to a foodservice establishment that serves only various types of tea or coffee. |
| Standalone | It refers to a restaurants that have an independent infrastructure setup and not connected to any other business. |
| Sushi | It is a Japanese dish of prepared vinegared rice, usually with some sugar and salt, accompanied by a variety of ingredients, such as seafood—often raw—and vegetables. |
| Travel | It refers to foodservice offerings such as airplane food, dining on long-distance trains, and foodservice on cruise ships. |
| Virtual Kitchen | It refers to a cloud kitchen. |
| Wagyu Beef | It is beef derived from any of four strains of a breed of black or red Japanese cattle that are valued for their highly marbled meat. |


Research Methodology
Mordor Intelligence follows a four-step methodology in all our reports.
- Step-1: Identify Key Variables: In order to build a robust forecasting methodology, the variables and factors identified in Step 1 are tested against available historical market numbers. Through an iterative process, the variables required for the market forecast are set, and the model is built on the basis of these variables.
- Step-2: Build a Market Model: Market size estimations for the forecast years are in nominal terms. Inflation is considered for average order value, and it is forecasted as per predicted inflation rates in the countries.
- Step-3: Validate and Finalize: In this important step, all market numbers, variables, and analyst calls are validated through an extensive network of primary research experts from the market studied. The respondents are selected across levels and functions to generate a holistic picture of the market studied.
- Step-4: Research Outputs: Syndicated Reports, Custom Consulting Assignments, Databases & Subscription Platforms


