Market Overview
| Study Period | 2017 - 2030 |
|---|---|
| Forecast Data Period | 2025 - 2030 |
| Historical Data Period | 2017 - 2023 |
| Market Size (2025) | USD 661.90 Million |
| Market Size (2030) | USD 832.80 Million |
| Growth Rate (2025 - 2030) | 4.70% CAGR |
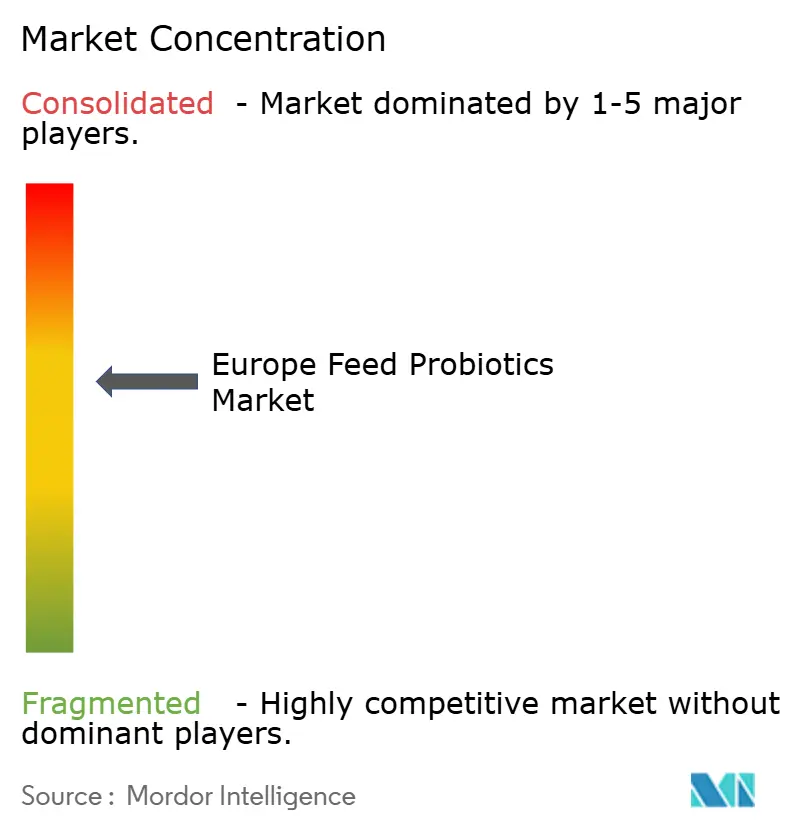
| Market Concentration | Medium |
Major Players *Disclaimer: Major Players sorted in no particular order Image © Mordor Intelligence. Reuse requires attribution under CC BY 4.0. | |

Europe Feed Probiotics Market Analysis by Mordor Intelligence
The Europe feed probiotics market size stands at USD 661.9 million in 2025 and is forecast to reach USD 832.8 million by 2030, translating to a 4.70% CAGR over the period. Demand accelerates as livestock producers migrate from antibiotic-dependent regimes to microbiome-centered nutrition, spurred by strict European Union regulations, large-scale farm consolidation, and retailer mandates for antibiotic-free protein. Technology investments in microencapsulation and AI-guided strain optimization are widening product differentiation, while freeze-drying bottlenecks in Eastern Europe sustain premium pricing for stabilized formulations. Competitive intensity remains moderate because the top five suppliers control a significant share of the Europe feed probiotics market, yet niche players still capture value through species-specific solutions that fit regional livestock systems. Spain, Germany, and France anchor overall volumes, but the United Kingdom sets the growth pace thanks to post-Brexit regulatory streamlining.
Key Report Takeaways
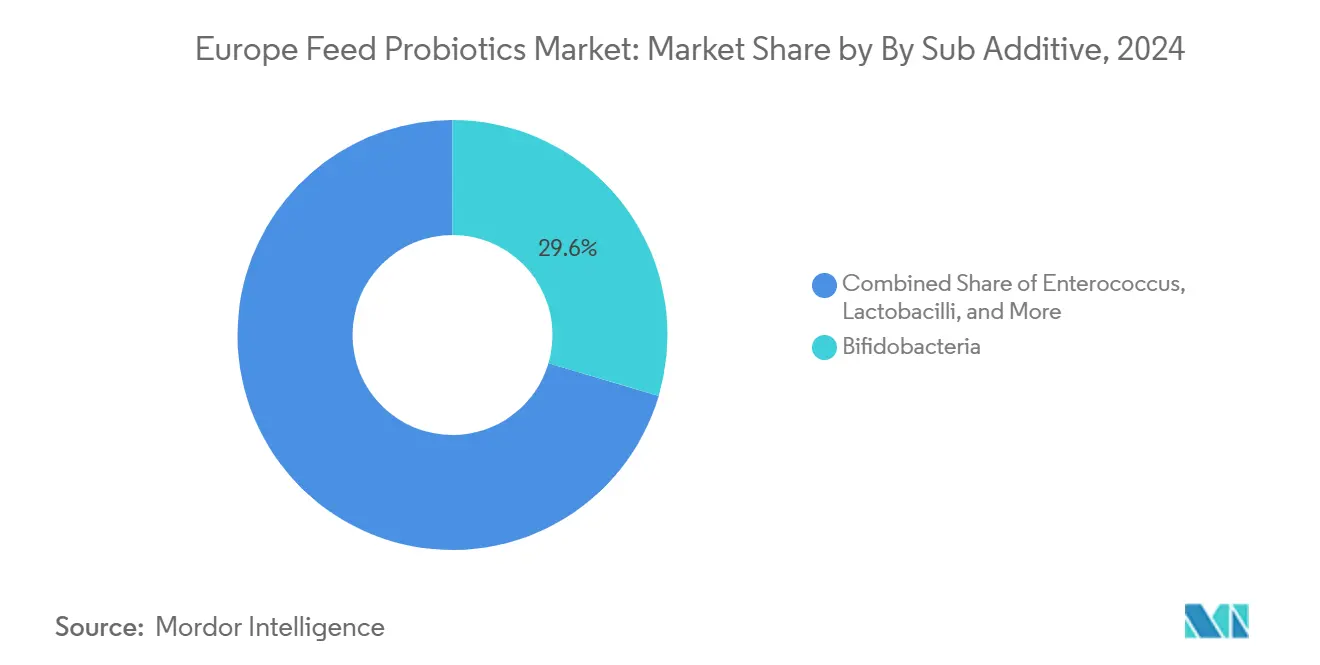
- By sub-additive, Bifidobacteria led with 29.6% of the European feed probiotics market share in 2024, whereas Enterococcus is projected to post the fastest 4.20% CAGR through 2030.
- By animal, poultry accounted for a 36.00% share of the European feed probiotics market size in 2024, while Swine is advancing at a 5.1% CAGR to 2030.
- By geography, Spain captured 15.64% of the European feed probiotics market in 2024, and the United Kingdom is forecast to expand at a 5.42% CAGR between 2025 and 2030.
Europe Feed Probiotics Market Trends and Insights
Drivers Impact Analysis*
| Driver | (~) % Impact on CAGR Forecast | Geographic Relevance | Impact Timeline |
|---|---|---|---|
| EU (European Union) ban on antibiotic growth promoters | +1.20% | Germany, Netherlands, and EU-wide | Medium term (2-4 years) |
| Demand for antibiotic-free animal protein | +1.00% | Western Europe | Long term (≥ 4 years) |
| Favorable EU feed additive approvals | +0.80% | EU-wide, accelerated in the United Kingdom | Short term (≤ 2 years) |
| Consolidation of commercial livestock farms | +0.60% | Central and Eastern Europe, Spain | Medium term (2-4 years) |
| Post-Brexit accelerated UK probiotic clearances | +0.40% | United Kingdom, spillover to Ireland | Short term (≤ 2 years) |
| AI-driven strain optimization in aquaculture | +0.30% | Nordic countries, Netherlands, and Scotland | Long term (≥ 4 years) |
| Source: Mordor Intelligence | |||


EU ban on antibiotic growth promoters
The statutory prohibition on antibiotic growth promoters reshaped production economics across all livestock species, obliging farmers to adopt biologically derived alternatives that stabilize gut flora [1]Source: European Food Safety Authority, “Feed Additives – Probiotics,” efsa.europa.eu. Early-adopting poultry integrators in Germany and the Netherlands reported 15-20% gains in feed conversion when shifting to multi-strain probiotic programs. Consistent enforcement by inspection agencies further deters illicit antibiotic use and cements probiotics as the primary functional replacement. Lactobacilli and Bifidobacteria benefit most because their safety dossiers and mode-of-action data already meet EFSA (European Food Safety Authority) criteria. Equipment vendors see stronger demand for on-farm dosing systems calibrated to probiotic viability thresholds, and suppliers leverage regulatory clarity to lock in long-term contracts with vertically integrated meat processors.
Demand for antibiotic-free animal protein
Retail chains, including Carrefour and Tesco, adopted zero-tolerance residue policies in 2024, pushing probiotics into mainstream feed formulations. Private-label antibiotic-free meat now commands 12-15% shelf premiums, rewarding producers that certify herds under stringent residue testing. Consumer advocacy campaigns amplify awareness of antimicrobial resistance, encouraging policymakers to extend surveillance to smallholder operations. Consequently, organic and premium livestock enterprises in France and Italy scale up probiotic inclusion rates to reinforce brand positioning. Feed mills add dedicated production lines for heat-sensitive strains, while cold-chain logistics firms expand capacity to handle higher throughputs of stabilized products. The cumulative pull effect solidifies a robust long-term market floor.
Favorable EU feed additive approvals
EFSA cleared 12 new probiotic strains in 2024, up from eight the prior year, shortening dossier review cycles, especially for multi-species combinations. The United Kingdom’s post-Brexit regime cut approval lead times from 18 to eight months, quickly attracting multinational formulators. Lower compliance costs encourage small innovators to submit niche strains tailored to aquaculture or ruminant segments. Patent filings climbed 40% year-over-year as firms race to secure intellectual property ahead of wider commercial roll-outs. Rapid authorizations also allow feed mills to conduct large-scale commercial trials sooner, accelerating customer validation and uptake across Spain and the Netherlands. This regulatory tailwind underpins incremental revenue growth for suppliers over the next two years.
Consolidation of commercial livestock farms
Average farm size in Poland, Hungary and Spain grew 8% annually as operators pursued scale efficiencies. Bigger units install precision feeding technologies capable of metering probiotics by growth phase and health status, delivering clear ROI metrics. Spanish poultry giants deploy real-time gut microbiome analytics that recommend daily strain adjustments, fostering supplier partnerships around customized blends. Mergers reduce the customer headcount but lift order volumes, enabling tier-one manufacturers to negotiate multi-year supply contracts. Equipment service packages bundled with probiotic sales deepen switching costs and protect market share. Over the medium term, farm consolidation raises the Europe feed probiotics market’s average selling price through increased adoption of high-end, encapsulated products.
Restraints Impact Analysis*
| Restraint | (~) % Impact on CAGR Forecast | Geographic Relevance | Impact Timeline |
|---|---|---|---|
| High encapsulation and stabilization cost | -0.70% | Price-sensitive Eastern Europe | Medium term (2-4 years) |
| Efficacy variability in on-farm conditions | -0.50% | Rural areas lacking technical support | Long term (≥ 4 years) |
| Freeze-drying capacity bottlenecks Eastern Europe | -0.30% | Poland, Czech Republic, and Hungary | Short term (≤ 2 years) |
| Farmer skepticism after coccidiostat interactions | -0.20% | Traditional farming regions, and Southern Europe | Medium term (2-4 years) |
| Source: Mordor Intelligence | |||
High encapsulation and stabilization cost
Microencapsulated probiotics cost 40-60% more than conventional additives because freeze-drying, spray-coating and airtight packaging drive manufacturing expenses to USD 8–12 per kg versus USD 3–5 for standard products [2]Source: Financial Times Reporters, “Feed Additives Manufacturing Costs Analysis,” ft.com. Romanian and Bulgarian producers often bypass premium formulations, limiting penetration in value-driven segments. Exchange-rate volatility further inflates imported input prices, straining farm budgets already squeezed by feed grain inflation. Suppliers respond by investing in fluid-bed coating lines that promise lower energy use, while some contract toll-drying services in Germany to bypass regional capacity shortfalls. Over time, scale economies and technology transfer could soften price differentials, but cost remains a meaningful brake on overall adoption.
Efficacy variability in on-farm conditions
Field trials reveal 20-30% swing in probiotic performance under real-world conditions due to water quality, ambient temperature, and concurrent drug regimes [3]Source: John D. Richards, “Probiotic Efficacy in Livestock Production Systems,” Journal of Animal Science, jas.oup.com . Family-owned farms in Southern Europe lack microbiome testing tools needed to fine-tune dosing, breeding skepticism about product consistency. Regional veterinary advisers often have limited training on strain-specific application guidelines, amplifying misuse or underdosing risks. Suppliers invest in mobile technical teams and digital extension platforms to close the knowledge gap, yet service coverage remains uneven. Consequently, perceived performance uncertainty diminishes repeat purchases in marginal areas and modestly drags on the European feed probiotics market’s CAGR.
*Our forecasts treat driver/restraint impacts as directional, not additive. The impact forecasts reflect baseline growth, mix effects, and variable interactions.
Segment Analysis
By Sub Additive: Diversification Anchors Growth
Bifidobacteria retained 29.6% of the European feed probiotics market in 2024, reflecting their proven gut-health benefits in poultry and ruminants. Enterococcus, though smaller, is projected to post a 4.20% CAGR, supported by new EFSA approvals for aquaculture strains that thrive in marine salinity. The European feed probiotics market size for Enterococcus products could rise markedly as Scottish and Norwegian salmon farms scale recirculating systems that require targeted water-borne supplementation. Lactobacilli dominate broiler diets owing to established efficacy and broad supply availability, but Pediococcus is catching up in swine operations through weaning-stress formulas. Streptococcus thermophilus finds niche demand in organic dairy herds, and “other probiotics” capture specialized multi-species cocktails. Competitive positioning now hinges on strain purity, cell viability, and carrier technology rather than price alone.
Amid broader livestock consolidation, suppliers craft species-specific blends that consider gut pH and enzymatic secretions unique to each animal. Multi-strain consortia increasingly pair Bifidobacteria with Pediococcus to enhance short-chain fatty-acid production, boosting feed efficiency in high-density broiler houses. Product messaging also stresses environmental credentials, highlighting reduced nitrogen excretion when probiotics improve nutrient absorption. These dynamics underpin premiumization and lift the overall value pool of the European feed probiotics market.


By Animal: Aquaculture Surges Ahead
Poultry provided 36.00% of the European feed probiotics market size in 2024, driven by broiler volume and retailer pressure to eliminate antibiotic residues. Yet Swine is on track for the fastest 5.1% CAGR as EU sustainable policies accelerate the shift toward functional additives that curb pathogen outbreaks [4]Source: European Aquaculture Society, “Sustainable Aquaculture Development,” aquaeas.eu . Swine formulations focus on post-weaning intestinal stabilization, while niche demand emerges among rabbit and equine sectors seeking natural gut modulators. Ruminant adoption grows steadily, with dairy cooperatives in Germany mandating probiotic supplementation to raise milk yield and reduce methane.
The differentiation of probiotic portfolios by animal category shapes procurement strategies at integrated feed companies. Dedicated aquaculture feed plants add sterile dosing chambers to protect strain viability, whereas poultry mills emphasize high-temperature tolerance. Such infrastructure upgrades widen entry barriers for late entrants and consolidate incremental gains for incumbents within the European feed probiotics market.

Geography Analysis
Spain commanded 15.64% of the European feed probiotics market in 2024 on the back of its leading poultry output and modernization grants that subsidize sustainable feed technologies. German dairy cooperatives anchor ruminant volume, while French producers leverage organic certifications to price their probiotic-enhanced meat and milk products at a premium. The Netherlands boasts intensive poultry and aquaculture clusters that serve as test beds for AI-optimized strain combinations. The United Kingdom’s forecast 5.42% CAGR showcases how fast-track approvals and nutrition R&D funding are catalyzing uptake.
The Netherlands, despite its modest landmass, punches above its weight with high-technology farms integrating precision nutrition platforms. Wageningen University pilots digital twins of poultry gut microbiota, enabling iterative refinement of multi-strain products in near-real time. The United Kingdom’s growth momentum rests on regulatory agility and public innovation grants that de-risk on-farm trials, especially within Scotland’s salmon aquaculture.
Eastern Europe accelerates adoption as operators in Poland and the Czech Republic modernize facilities, although price sensitivity tempers demand for high-end encapsulated products. Russia and Turkey maintain latent demand tied to domestic livestock expansion, yet currency volatility and import restrictions pose planning challenges for suppliers distributing across the broader European feed probiotics market.
Competitive Landscape
The European feed probiotics market shows moderate consolidation: the top five players, Evonik Industries, DSM-Firmenich, Cargill, Lallemand Animal Nutrition, and Novonesis, account for the maximum collective share. Evonik leads through its broad strain library and German manufacturing footprint. DSM-Firmenich follows, recently bolstered by its AquaBiome acquisition that adds marine strains and a Norwegian plant. Vertical integration is rising as suppliers partner with feed mills to secure captive volumes. Cargill’s in-house production lines for poultry diets embody this shift.
Technological differentiation is sharpening competitive edges. Patent filings, tallying 127 in 2024, pivot toward microencapsulation, precision fermentation, and AI-driven strain discovery. Lallemand’s new R&D center in Toulouse targets ruminant-specific innovations, while Novonesis collaborates with Marine Harvest to test custom salmon formulas that boost feed conversion by 12%.
Mid-tier firms chase white-space segments such as small ruminants and organic operations, banking on agile product-development cycles. Although the regulatory system favors incumbents with dossier depth, the United Kingdom’s expedited pathway offers smaller innovators a quicker route to commercialization within the European feed probiotics market.
Europe Feed Probiotics Industry Leaders
Adisseo
Evonik Industries AG
Cargill, Incorporated.
dsm-firmenich AG
International Flavors and Fragrances Inc. (Danisco Animal Nutrition)
- *Disclaimer: Major Players sorted in no particular order

Recent Industry Developments
- September 2024: Lallemand's R&D expansion in Toulouse represents an investment in probiotic development for the European feed market. The 800-square-meter facility enhancement improves bioprocess innovation capabilities and accelerates the development of anaerobic strains, which are essential for strict anaerobic probiotics used in European livestock nutrition.
- October 2022: The partnership between Evonik and BASF allowed Evonik certain non-exclusive licensing rights to OpteinicsTM, a digital solution to improve comprehension and reduce the environmental impact of the animal protein and feed industries.


Europe Feed Probiotics Market Report Scope
Bifidobacteria, Enterococcus, Lactobacilli, Pediococcus, Streptococcus are covered as segments by Sub Additive. Aquaculture, Poultry, Ruminants, Swine are covered as segments by Animal. France, Germany, Italy, Netherlands, Russia, Spain, Turkey, United Kingdom are covered as segments by Country.Sub Additive
| Bifidobacteria |
| Enterococcus |
| Lactobacilli |
| Pediococcus |
| Streptococcus |
| Other Probiotics |
Animal
| Aquaculture | Fish |
| Shrimp | |
| Other Aquaculture Species | |
| Poultry | Broiler |
| Layer | |
| Other Poultry Birds | |
| Ruminants | Beef Cattle |
| Dairy Cattle | |
| Other Ruminants | |
| Swine | |
| Other Animals |
Geography
| France |
| Germany |
| Italy |
| Netherlands |
| Russia |
| Spain |
| Turkey |
| United Kingdom |
| Rest of Europe |
| Sub Additive | Bifidobacteria | |
| Enterococcus | ||
| Lactobacilli | ||
| Pediococcus | ||
| Streptococcus | ||
| Other Probiotics | ||
| Animal | Aquaculture | Fish |
| Shrimp | ||
| Other Aquaculture Species | ||
| Poultry | Broiler | |
| Layer | ||
| Other Poultry Birds | ||
| Ruminants | Beef Cattle | |
| Dairy Cattle | ||
| Other Ruminants | ||
| Swine | ||
| Other Animals | ||
| Geography | France | |
| Germany | ||
| Italy | ||
| Netherlands | ||
| Russia | ||
| Spain | ||
| Turkey | ||
| United Kingdom | ||
| Rest of Europe | ||


Market Definition
- FUNCTIONS - For the study, feed additives are considered to be commercially manufactured products that are used to enhance characteristics such as weight gain, feed conversion ratio, and feed intake when fed in appropriate proportions.
- RESELLERS - Companies engaged in reselling feed additives without value addition have been excluded from the market scope, to avoid double counting.
- END CONSUMERS - Compound feed manufacturers are considered to be end-consumers in the market studied. The scope excludes farmers buying feed additives to be used directly as supplements or premixes.
- INTERNAL COMPANY CONSUMPTION - Companies engaged in the production of compound feed as well as the manufacturing of feed additives are part of the study. However, while estimating the market sizes, the internal consumption of feed additives by such companies has been excluded.
| Keyword | Definition |
|---|---|
| Feed additives | Feed additives are products used in animal nutrition for purposes of improving the quality of feed and the quality of food from animal origin, or to improve the animals’ performance and health. |
| Probiotics | Probiotics are microorganisms introduced into the body for their beneficial qualities. (It maintains or restores beneficial bacteria to the gut). |
| Antibiotics | Antibiotic is a drug that is specifically used to inhibit the growth of bacteria. |
| Prebiotics | A non-digestible food ingredient that promotes the growth of beneficial microorganisms in the intestines. |
| Antioxidants | Antioxidants are compounds that inhibit oxidation, a chemical reaction that produces free radicals. |
| Phytogenics | Phytogenics are a group of natural and non-antibiotic growth promoters derived from herbs, spices, essential oils, and oleoresins. |
| Vitamins | Vitamins are organic compounds, which are required for normal growth and maintenance of the body. |
| Metabolism | A chemical process that occurs within a living organism in order to maintain life. |
| Amino acids | Amino acids are the building blocks of proteins and play an important role in metabolic pathways. |
| Enzymes | Enzyme is a substance that acts as a catalyst to bring about a specific biochemical reaction. |
| Anti-microbial resistance | The ability of a microorganism to resist the effects of an antimicrobial agent. |
| Anti-microbial | Destroying or inhibiting the growth of microorganisms. |
| Osmotic balance | It is a process of maintaining salt and water balance across membranes within the body's fluids. |
| Bacteriocin | Bacteriocins are the toxins produced by bacteria to inhibit the growth of similar or closely related bacterial strains. |
| Biohydrogenation | It is a process that occurs in the rumen of an animal in which bacteria convert unsaturated fatty acids (USFA) to saturated fatty acids (SFA). |
| Oxidative rancidity | It is a reaction of fatty acids with oxygen, which generally causes unpleasant odors in animals. To prevent these, antioxidants were added. |
| Mycotoxicosis | Any condition or disease caused by fungal toxins, mainly due to contamination of animal feed with mycotoxins. |
| Mycotoxins | Mycotoxins are toxin compounds that are naturally produced by certain types of molds (fungi). |
| Feed Probiotics | Microbial feed supplements positively affect gastrointestinal microbial balance. |
| Probiotic yeast | Feed yeast (single-cell fungi) and other fungi used as probiotics. |
| Feed enzymes | They are used to supplement digestive enzymes in an animal’s stomach to break down food. Enzymes also ensure that meat and egg production is improved. |
| Mycotoxin detoxifiers | They are used to prevent fungal growth and to stop any harmful mold from being absorbed in the gut and blood. |
| Feed antibiotics | They are used both for the prevention and treatment of diseases but also for rapid growth and development. |
| Feed antioxidants | They are used to protect the deterioration of other feed nutrients in the feed such as fats, vitamins, pigments, and flavoring agents, thus providing nutrient security to the animals. |
| Feed phytogenics | Phytogenics are natural substances, added to livestock feed to promote growth, aid in digestion, and act as anti-microbial agents. |
| Feed vitamins | They are used to maintain the normal physiological function and normal growth and development of animals. |
| Feed flavors and sweetners | These flavors and sweeteners help to mask tastes and odors during changes in additives or medications and make them ideal for animal diets undergoing transition. |
| Feed acidifiers | Animal feed acidifiers are organic acids incorporated into the feed for nutritional or preservative purposes. Acidifiers enhance congestion and microbiological balance in the alimentary and digestive tracts of livestock. |
| Feed minerals | Feed minerals play an important role in the regular dietary requirements of animal feed. |
| Feed binders | Feed binders are the binding agents used in the manufacture of safe animal feed products. It enhances the taste of food and prolongs the storage period of the feed. |
| Key Terms | Abbreviation |
| LSDV | Lumpy Skin Disease Virus |
| ASF | African Swine Fever |
| GPA | Growth Promoter Antibiotics |
| NSP | Non-Starch Polysaccharides |
| PUFA | Polyunsaturated Fatty Acid |
| Afs | Aflatoxins |
| AGP | Antibiotic Growth Promoters |
| FAO | The Food And Agriculture Organization of the United Nations |
| USDA | The United States Department of Agriculture |


Research Methodology
Mordor Intelligence follows a four-step methodology in all our reports.
- Step-1: IDENTIFY KEY VARIABLES: In order to build a robust forecasting methodology, the variables and factors identified in Step-1 are tested against available historical market numbers. Through an iterative process, the variables required for market forecast are set and the model is built on the basis of these variables.
- Step-2: Build a Market Model: Market-size estimations for the forecast years are in nominal terms. Inflation is not a part of the pricing, and the average selling price (ASP) is kept constant throughout the forecast period.
- Step-3: Validate and Finalize: In this important step, all market numbers, variables and analyst calls are validated through an extensive network of primary research experts from the market studied. The respondents are selected across levels and functions to generate a holistic picture of the market studied.
- Step-4: Research Outputs: Syndicated Reports, Custom Consulting Assignments, Databases & Subscription Platforms


