United States Feed Probiotics Market Size and Share
Market Overview
| Study Period | 2018 - 2031 |
|---|---|
| Forecast Data Period | 2026 - 2031 |
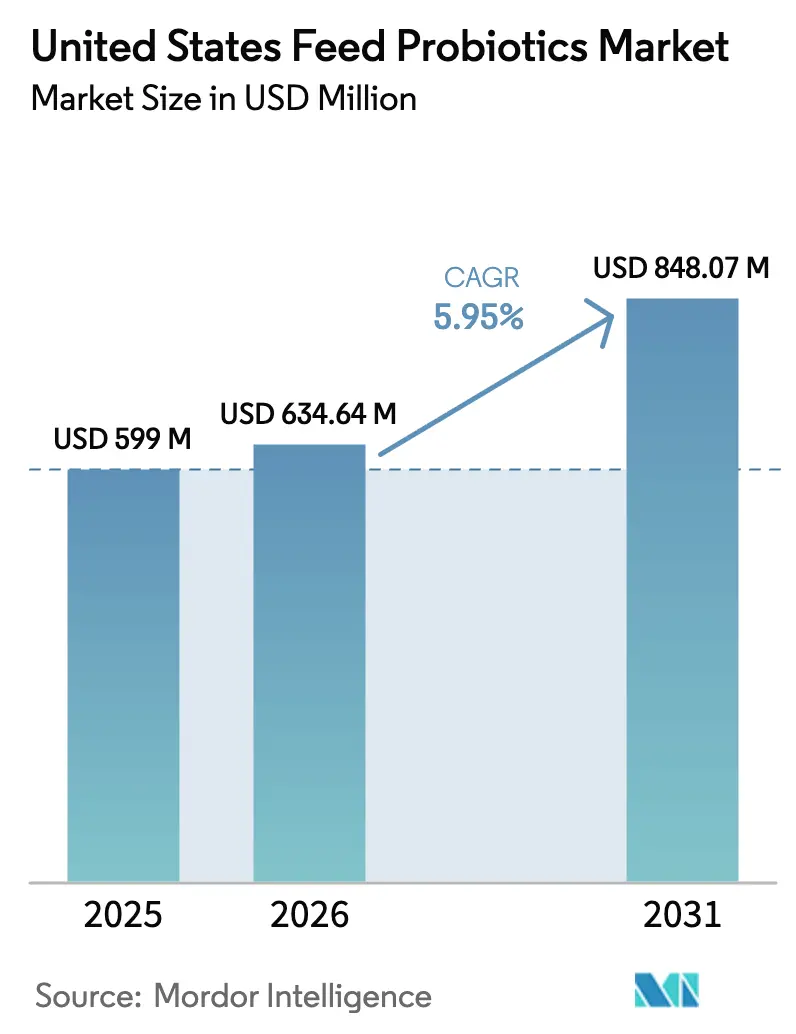
| Base Year Market Size (2025) | USD 599.0 Million |
| Market Size (2026) | USD 634.64 Million |
| Market Size (2031) | USD 848.07 Million |
| Growth Rate (2026 - 2031) | 5.95% CAGR |
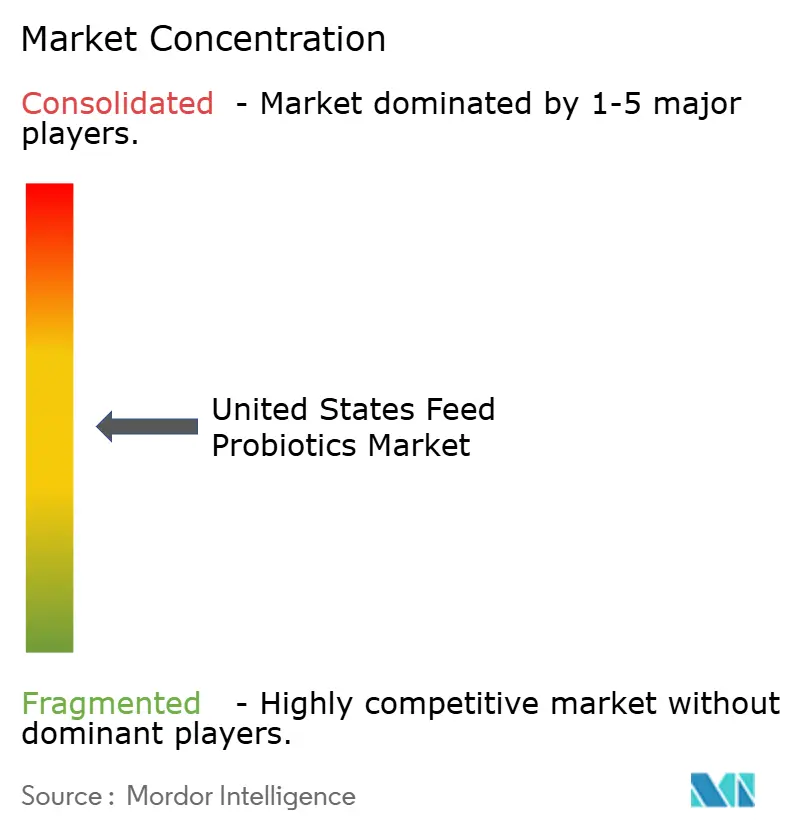
| Market Concentration | Medium |
Major Players *Disclaimer: Major Players sorted in no particular order Image © Mordor Intelligence. Reuse requires attribution under CC BY 4.0. | |
United States Feed Probiotics Market Analysis by Mordor Intelligence
The feed probiotics market size in the United States was valued at USD 599.0 million in 2025 and estimated to grow from USD 634.64 million in 2026 to reach USD 848.07 million by 2031, at a CAGR of 5.95% during the forecast period (2026-2031). The projected gains follow the livestock sector’s continued transition away from antibiotic growth promoters after the Food and Drug Administration (FDA) implemented the Veterinary Feed Directive, which tightened access to medically important antibiotics [1]FDA Center for Veterinary Medicine, “Veterinary Feed Directive (VFD),” fda.gov. Vertically integrated poultry operations adopted standardized probiotic programs early, while carbon-credit incentives are accelerating use in ruminant diets. Product development is shifting toward strain-specific formulations and synbiotic blends that match precise production objectives. At the same time, domestic manufacturing bottlenecks in freeze-drying capacity and spore heat instability during pelleting elevate the value of suppliers with advanced process engineering capabilities. Moderate market concentration leaves room for niche innovators that can supply proprietary strains or delivery technologies.
Key Report Takeaways
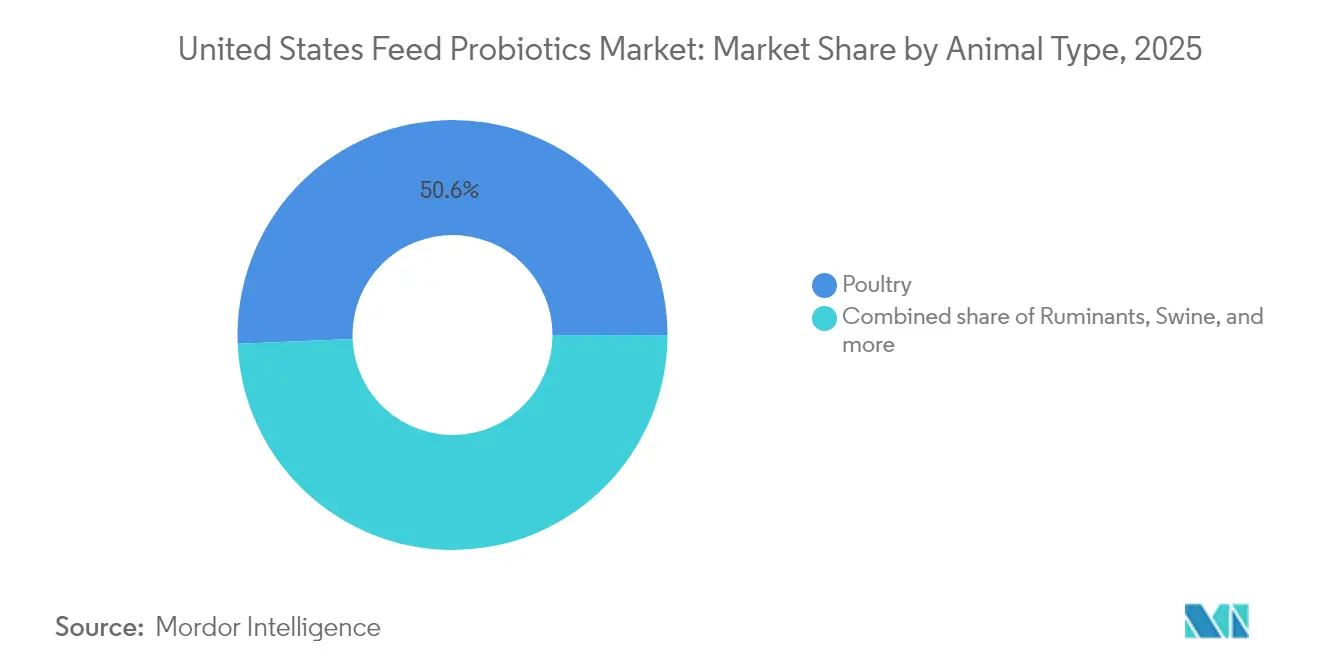
- By animal, poultry accounted for 50.65% of feed probiotics market share in 2025, while ruminants are set to post the fastest 6.78% CAGR through 2031.
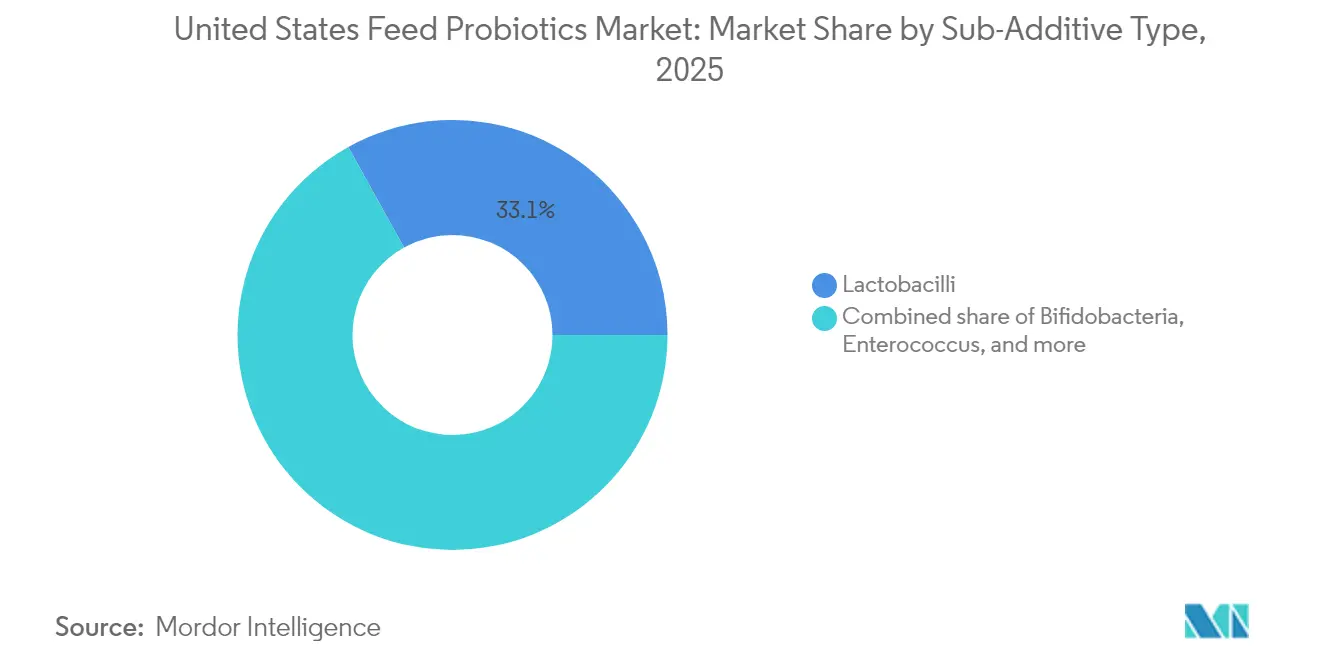
- By sub-additive, Lactobacilli held 33.05% of feed probiotics market size in 2025 and Bifidobacteria are projected to record a 6.74% CAGR to 2031.
Note: Market size and forecast figures in this report are generated using Mordor Intelligence’s proprietary estimation framework, updated with the latest available data and insights as of 2026.
United States Feed Probiotics Market Trends and Insights
Drivers Impact Analysis*
| Driver | (~) % Impact on CAGR Forecast | Geographic Relevance | Impact Timeline |
|---|---|---|---|
| Ban on antibiotic growth promoters | +1.8% | Nationwide, with heavy influence in integrated poultry belts | Short term (≤ 2 years) |
| Consumer pull for antibiotic-free meat | +1.2% | National, strongest in premium retail and food-service channels | Medium term (2-4 years) |
| Expansion of integrated poultry production | +0.9% | Southeast and Mid-Atlantic production corridors | Medium term (2-4 years) |
| Emergence of synbiotic (pre plus probiotic) formulas | +0.6% | National; higher uptake in specialized operations | Long term (≥ 4 years) |
| Precision-feeding platforms enabling targeted dosing | +0.4% | Midwest dairies and Western beef feedlots | Long term (≥ 4 years) |
| Carbon-credit incentives for methane reduction in cattle | +0.3% | Western rangelands and Midwest dairy operations | Long term (≥ 4 years) |
| Source: Mordor Intelligence | |||


Ban on Antibiotic Growth Promoters
Federal restrictions on medically important antibiotics forced producers to replace growth-promoting drugs with biological alternatives such as probiotics. Integrated poultry companies quickly deployed flock-wide probiotic programs, leveraging company-owned feed mills and hatcheries to achieve consistent dosing while safeguarding performance metrics. The urgency of compliance pushed demand for strains backed by robust efficacy trials, benefiting suppliers that could present peer-reviewed data packages. Although probiotics do not replicate antibiotic performance on a one-to-one basis, improved gut health parameters and pathogen suppression offset some productivity losses. Smallholders lagged in adoption due to higher formulation costs, yet the regulatory ban guarantees a structural demand floor that adds 1.8 percentage points to the market CAGR.
Consumer Pull for Antibiotic-Free Meat
Premium retail brands and restaurant chains expanded verified antibiotic-free sourcing rules, allowing producers to command price premiums that help absorb the extra cost of direct-fed microbials. The transparency requirements include thorough documentation of feed additive use, creating a pull-through effect from consumer to hatchery. Demand is concentrated in higher-income metropolitan areas where label claims drive selection. Surveys show shoppers perceive “raised without antibiotics” as more credible than “no antibiotics ever,” shifting the marketing narrative in a way that aligns naturally with probiotic programs. The willingness to pay higher prices sustains a 1.2 percentage-point uplift in CAGR, particularly in the broiler and premium pork segments.
Expansion of Integrated Poultry Production
Vertical integration streamlines feed additive decisions by centralizing purchasing and management standards within a single corporate structure. Scale economies let integrators negotiate volume discounts and adopt hatchery-spray or water-line probiotic delivery systems that independent growers cannot afford. New complexes built in Georgia and Alabama feature feed mills engineered around antibiotic-free protocols from day one, placing probiotics in both starter and grow-finisher rations. The integrator model mitigates variability in field outcomes, enabling suppliers to generate repeat business through long-term supply agreements. Consequently, integrated poultry growth contributes an additional 0.9 percentage points to overall market expansion.
Emergence of Synbiotic (Pre Plus Probiotic) Formulas
Combining prebiotics with probiotics improves colonization efficiency and enhances feed conversion metrics, especially in species with complex digestive physiology. Synbiotics offer a dual-mode mode of action, delivering fermentable fibers that selectively support probiotic strains while promoting volatile fatty acid production. Early adopters in calf starter feeds and turkey grower diets reported more consistent weight gains and lower mortality compared to probiotic-only programs. Collaborative partnerships between probiotic manufacturers and fiber suppliers accelerated commercialization during 2024, but regulatory evaluation is more intricate because the formulations involve multiple functional claims. Even so, falling production costs and favorable trial data point to a 0.6 percentage-point lift in CAGR over the forecast horizon.
Restraints Impact Analysis*
| Restraint | (~) % Impact on CAGR Forecast | Geographic Relevance | Impact Timeline |
|---|---|---|---|
| Probiotic heat instability during pelleting | −0.8% | Nationwide, most acute in pelleted feed mills | Short term (≤ 2 years) |
| Lengthy FDA GRAS approval timelines | −0.6% | National regulatory bottleneck | Medium term (2-4 years) |
| Domestic freeze-drying capacity bottlenecks | −0.4% | Concentrated in specialized manufacturing corridors | Medium term (2-4 years) |
| Variable efficacy in Midwest field trials | −0.3% | Midwest swine and poultry operations | Short term (≤ 2 years) |
| Source: Mordor Intelligence | |||
Probiotic Heat Instability During Pelleting
Steam-conditioning temperatures in the 60-90 °C range reduce viable spore counts by up to 90%, pushing manufacturers to overdose products or invest in enteric-coating technologies. Although Bacillus spores exhibit greater heat tolerance, many Lactobacilli and Bifidobacteria strains suffer severe losses. Feed mills experimenting with lower conditioning temperatures face pellet quality trade-offs that can throttle throughput and increase energy costs per ton. Coating solutions raise formulation costs and, in some cases, limit nutrient release profiles. Until cost-effective thermostable strains or post-pelleting application methods become mainstream, the issue shaves an estimated 0.8 percentage points off market growth.
Lengthy FDA GRAS (Generally Recognized As Safe) Approval Timelines
Securing Generally Recognized as Safe status for a novel microbial strain requires extensive safety dossiers and manufacturing disclosures, taking 18-24 months on average. Each new strain or strain combination demands separate submission, inflating R&D budgets and delaying commercial launch schedules. Start-ups often lack the regulatory resources to manage iterative data requests, allowing established incumbents with well-staffed regulatory affairs divisions to extend their competitive lead. The prolonged review cycle discourages rapid innovation and effectively suppresses the CAGR by 0.6 percentage points across the forecast window.
*Our forecasts treat driver/restraint impacts as directional, not additive. The impact forecasts reflect baseline growth, mix effects, and variable interactions.
Segment Analysis
By Sub-Additive: Lactobacilli Leadership Faces Specialized Competition
Lactobacilli held 33.05% of the feed probiotics market share in 2025 on the back of an extensive safety record and versatility across monogastric and ruminant diets. Yet Bifidobacteria strains are expanding at a 6.74% CAGR to 2031, capitalizing on neonatal gut health programs, especially in calf and broiler starter feeds. Strain-specific intellectual property stokes supplier differentiation; for example, Adisseo’s Pediococcus acidilactici is one of the few FDA-approved options in its class, while Arm and Hammer catalogs more than 82,000 proprietary isolates for tailored blends. Regulatory approvals tied to individual organisms heighten switching costs and encourage long-term supply relationships. Heat-resistant Enterococcus and Pediococcus products fill niches where pelleting damage is acute, but their narrower efficacy spectra limit uptake. Emerging Streptococcus and multistrain consortia aim at specific metabolic or pathogen interventions, indicating continued segmentation within the broader category.
Developers are dedicating more R&D to delivery technologies that preserve viability through processing. Encapsulation advances are widening the addressable market by bridging the gap between heat-labile strains and pelleted rations. Price pressure persists as commodity Bacillus products flood the low-tier segment, prompting premium brands to bundle performance guarantees backed by on-farm diagnostics. Over the forecast horizon, specialized formulations will outgrow legacy broad-spectrum products, yet legacy strains will remain volume leaders because of cost and regulatory familiarity.


By Animal: Poultry Dominance Meets Ruminant Momentum
Poultry represented 50.65% of the feed probiotics market size in 2025. Integrated broiler and layer companies deploy probiotics from hatch to processing, citing gains in feed conversion ratios and pathogen load reductions. Water-line dosing technology enables daily administration adjustments without reformulating the entire ration. Despite the established base, growth is moderating as penetration nears saturation in Tier-1 integrators. The ruminant category, although smaller, is tracking a 6.78% CAGR that will boost its feed probiotics market share by 2031. Methane-modulating strains and rumen-stable capsules demonstrate clear feed-efficiency gains, aligning with sustainability incentives and carbon-credit schemes.
Swine consumption remains resilient; custom Bacillus blends tailored to barn-specific pathogen profiles under the CERTILLUS platform illustrate how precision programs lock in customers for multiyear cycles. Aquaculture currently occupies a niche in value terms, yet NOAA’s identification of 21,000 acres of new Aquaculture Opportunity Areas positions the segment for an outsized growth trajectory . Species-specific water-stable carriers and biofilm-forming bacterial strains are critical enablers for fish and shrimp systems. Looking forward, species diversification and cross-segment formulation platforms will define supplier growth strategies.
Geography Analysis
Southeastern states form the epicenter of feed probiotics demand, driven by vertically integrated poultry complexes stretching from Georgia through the Carolinas. Feed mills in this corridor transitioned rapidly to probiotics following the 2017 implementation of the FDA’s Veterinary Feed Directive, and by 2025, virtually every new mill is designed for multi-path delivery options that include hatchery sprays and water-line administration. Unit costs fall as scale economies improve, anchoring the region’s leadership. Meanwhile, the Midwest dairy and swine belt is the fastest-growing geography as precision-feeding systems spread across Wisconsin, Minnesota, and Iowa. Operators integrate cloud-based ration software that fine-tunes probiotic dosing, with early adopters noting feed-to-gain improvements that justify incremental expense.
Western feedlots in Colorado, Kansas, and California add demand for Bacillus and yeast blends targeting rumen pH stabilization during finishing. California’s aggressive methane-reduction mandates catalyze interest in low-emission strains, and state sustainability incentives can offset product cost premiums. On the aquaculture front, Gulf Coast states capitalize on NOAA’s newly designated marine farming zones, where probiotic-enhanced hatchery feeds support fingerling survival in offshore net pens. The Pacific Northwest emphasizes salmonid applications, though marine probiotic regulations remain more stringent than terrestrial equivalents.
Regional dispersion also reflects variations in state feed-label review systems overseen by the Association of American Feed Control Officials. Texas and Missouri have streamlined electronic submission portals that cut approval days, whereas some Northeastern states still rely on manual document review. Variation in enforcement shapes supplier go-to-market timelines and drives regional specialization among distributors. Overall, geography-specific regulation, livestock mix, and infrastructure collectively steer adoption curves within the broader feed probiotics market.
Competitive Landscape
The top five suppliers captured a modest share of industry sales in 2024, placing the feed probiotics market in a moderately concentrated state. Multinational nutrition companies such as DSM-Firmenich, International Flavors and Fragrances, and Kerry Group leverage global R&D networks and broad strain repositories to defend shelf space. Their integrated models span strain discovery, fermentation, freeze-drying, and downstream formulation, granting them cost and regulatory advantages. Mid-tier players differentiate through niche focus, for example, Arm and Hammer’s CERTILLUS platform curates barn-specific Bacillus cocktails that reduce pathogen prevalence in swine operations.
Patent activity is shifting from individual organism claims to encapsulation and delivery methods, underscoring the maturation of strain libraries. Partnerships with precision-feeding start-ups provide incumbents with data-driven proof of value, further entrenching leading brands. In contrast, distribution-only companies struggle to compete as customers demand on-farm technical support and custom analysis. The aquaculture space remains less competitive, giving early entrants room to build brand loyalty as offshore farming expands. Competitive intensity should increase once regulatory processes for marine probiotics become standardized, prompting terrestrial players to extend their portfolios.
Looking ahead, consolidation is projected as large nutrition companies acquire start-ups holding specialized intellectual property or advanced heat-stable technologies. The regulatory drag associated with new strain approvals may temper the pace of mergers and acquisitions. Suppliers that can pair field trial support with regulatory guidance will gain a disproportionate share, while those lacking technical depth risk marginalization.
United States Feed Probiotics Industry Leaders
DSM-Firmenich
International Flavors and Fragrances Inc. (IFF)
Kerry Group PLC
Evonik Industries AG
Cargill, Incorporated.
- *Disclaimer: Major Players sorted in no particular order

Recent Industry Developments
- August 2025: Kent Nutrition Group has launched ARGIS, a novel Bacillus-strain probiotic for poultry and swine feed, developed in partnership with the Arkansas Agricultural Experiment Station and Life Products, Inc. The probiotic is heat-stable and able to survive low pH, enabling better gut health and improved feed efficiency, especially for indigestible carbohydrates in soybean meal. Early trials suggest it may reduce reliance on multiple feed enzymes and yield cost savings for producers.
- February 2024: Arm & Hammer introduced two new poultry products at the IPPE event, CERTILLUS HatchWell, aimed at reducing embryo mortality and improving hatchability, and CERTILLUS MoveWell, designed to mitigate “kinky back” issues linked to Enterococcus infection. They leverage specific Bacillus strains to strengthen gut barrier function and inhibit pathogenic bacteria, with field tests already showing benefits in hatch rate and bird livability.


United States Feed Probiotics Market Report Scope
| Bifidobacteria |
| Enterococcus |
| Lactobacilli |
| Pediococcus |
| Streptococcus |
| Other Probiotics |
| Aquaculture | Fish |
| Shrimp | |
| Other Aquaculture Species | |
| Poultry | Broiler |
| Layer | |
| Other Poultry Birds | |
| Ruminants | Beef Cattle |
| Dairy Cattle | |
| Other Ruminants | |
| Swine | |
| Other Animals |
| Sub-Additive | Bifidobacteria | |
| Enterococcus | ||
| Lactobacilli | ||
| Pediococcus | ||
| Streptococcus | ||
| Other Probiotics | ||
| Animal | Aquaculture | Fish |
| Shrimp | ||
| Other Aquaculture Species | ||
| Poultry | Broiler | |
| Layer | ||
| Other Poultry Birds | ||
| Ruminants | Beef Cattle | |
| Dairy Cattle | ||
| Other Ruminants | ||
| Swine | ||
| Other Animals | ||


Market Definition
- FUNCTIONS - For the study, feed additives are considered to be commercially manufactured products that are used to enhance characteristics such as weight gain, feed conversion ratio, and feed intake when fed in appropriate proportions.
- RESELLERS - Companies engaged in reselling feed additives without value addition have been excluded from the market scope, to avoid double counting.
- END CONSUMERS - Compound feed manufacturers are considered to be end-consumers in the market studied. The scope excludes farmers buying feed additives to be used directly as supplements or premixes.
- INTERNAL COMPANY CONSUMPTION - Companies engaged in the production of compound feed as well as the manufacturing of feed additives are part of the study. However, while estimating the market sizes, the internal consumption of feed additives by such companies has been excluded.
| Keyword | Definition |
|---|---|
| Feed additives | Feed additives are products used in animal nutrition for purposes of improving the quality of feed and the quality of food from animal origin, or to improve the animals’ performance and health. |
| Probiotics | Probiotics are microorganisms introduced into the body for their beneficial qualities. (It maintains or restores beneficial bacteria to the gut). |
| Antibiotics | Antibiotic is a drug that is specifically used to inhibit the growth of bacteria. |
| Prebiotics | A non-digestible food ingredient that promotes the growth of beneficial microorganisms in the intestines. |
| Antioxidants | Antioxidants are compounds that inhibit oxidation, a chemical reaction that produces free radicals. |
| Phytogenics | Phytogenics are a group of natural and non-antibiotic growth promoters derived from herbs, spices, essential oils, and oleoresins. |
| Vitamins | Vitamins are organic compounds, which are required for normal growth and maintenance of the body. |
| Metabolism | A chemical process that occurs within a living organism in order to maintain life. |
| Amino acids | Amino acids are the building blocks of proteins and play an important role in metabolic pathways. |
| Enzymes | Enzyme is a substance that acts as a catalyst to bring about a specific biochemical reaction. |
| Anti-microbial resistance | The ability of a microorganism to resist the effects of an antimicrobial agent. |
| Anti-microbial | Destroying or inhibiting the growth of microorganisms. |
| Osmotic balance | It is a process of maintaining salt and water balance across membranes within the body's fluids. |
| Bacteriocin | Bacteriocins are the toxins produced by bacteria to inhibit the growth of similar or closely related bacterial strains. |
| Biohydrogenation | It is a process that occurs in the rumen of an animal in which bacteria convert unsaturated fatty acids (USFA) to saturated fatty acids (SFA). |
| Oxidative rancidity | It is a reaction of fatty acids with oxygen, which generally causes unpleasant odors in animals. To prevent these, antioxidants were added. |
| Mycotoxicosis | Any condition or disease caused by fungal toxins, mainly due to contamination of animal feed with mycotoxins. |
| Mycotoxins | Mycotoxins are toxin compounds that are naturally produced by certain types of molds (fungi). |
| Feed Probiotics | Microbial feed supplements positively affect gastrointestinal microbial balance. |
| Probiotic yeast | Feed yeast (single-cell fungi) and other fungi used as probiotics. |
| Feed enzymes | They are used to supplement digestive enzymes in an animal’s stomach to break down food. Enzymes also ensure that meat and egg production is improved. |
| Mycotoxin detoxifiers | They are used to prevent fungal growth and to stop any harmful mold from being absorbed in the gut and blood. |
| Feed antibiotics | They are used both for the prevention and treatment of diseases but also for rapid growth and development. |
| Feed antioxidants | They are used to protect the deterioration of other feed nutrients in the feed such as fats, vitamins, pigments, and flavoring agents, thus providing nutrient security to the animals. |
| Feed phytogenics | Phytogenics are natural substances, added to livestock feed to promote growth, aid in digestion, and act as anti-microbial agents. |
| Feed vitamins | They are used to maintain the normal physiological function and normal growth and development of animals. |
| Feed flavors and sweetners | These flavors and sweeteners help to mask tastes and odors during changes in additives or medications and make them ideal for animal diets undergoing transition. |
| Feed acidifiers | Animal feed acidifiers are organic acids incorporated into the feed for nutritional or preservative purposes. Acidifiers enhance congestion and microbiological balance in the alimentary and digestive tracts of livestock. |
| Feed minerals | Feed minerals play an important role in the regular dietary requirements of animal feed. |
| Feed binders | Feed binders are the binding agents used in the manufacture of safe animal feed products. It enhances the taste of food and prolongs the storage period of the feed. |
| Key Terms | Abbreviation |
| LSDV | Lumpy Skin Disease Virus |
| ASF | African Swine Fever |
| GPA | Growth Promoter Antibiotics |
| NSP | Non-Starch Polysaccharides |
| PUFA | Polyunsaturated Fatty Acid |
| Afs | Aflatoxins |
| AGP | Antibiotic Growth Promoters |
| FAO | The Food And Agriculture Organization of the United Nations |
| USDA | The United States Department of Agriculture |


Research Methodology
Mordor Intelligence follows a four-step methodology in all our reports.
- Step-1: IDENTIFY KEY VARIABLES: In order to build a robust forecasting methodology, the variables and factors identified in Step-1 are tested against available historical market numbers. Through an iterative process, the variables required for market forecast are set and the model is built on the basis of these variables.
- Step-2: Build a Market Model: Market-size estimations for the forecast years are in nominal terms. Inflation is not a part of the pricing, and the average selling price (ASP) is kept constant throughout the forecast period.
- Step-3: Validate and Finalize: In this important step, all market numbers, variables and analyst calls are validated through an extensive network of primary research experts from the market studied. The respondents are selected across levels and functions to generate a holistic picture of the market studied.
- Step-4: Research Outputs: Syndicated Reports, Custom Consulting Assignments, Databases & Subscription Platforms


