Market Overview
| Study Period | 2018 - 2031 |
|---|---|
| Forecast Data Period | 2026 - 2031 |
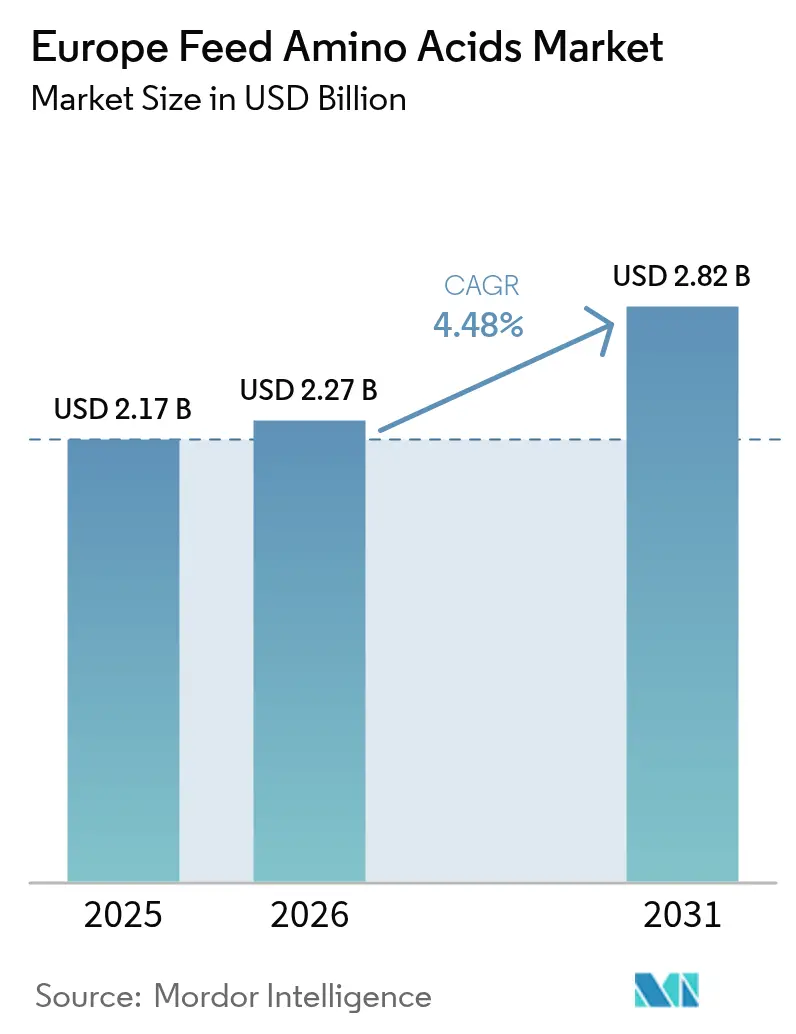
| Base Year Market Size (2025) | USD 2.17 Billion |
| Market Size (2026) | USD 2.27 Billion |
| Market Size (2031) | USD 2.82 Billion |
| Growth Rate (2026 - 2031) | 4.48% CAGR |
| Market Concentration | Medium |
Major Players*Disclaimer: Major Players sorted in no particular order Image © Mordor Intelligence. Reuse requires attribution under CC BY 4.0. | |
Europe Feed Amino Acids Market Analysis by Mordor Intelligence
Europe feed amino acids market size in 2026 is estimated at USD 2.27 billion, growing from 2025 value of USD 2.17 billion with 2031 projections showing USD 2.82 billion, growing at 4.48% CAGR over 2026-2031. Robust poultry and swine production, stricter European Union limits on antibiotic growth promoters, and the shift toward precision nutrition are steering sustained demand. Rising feed formulation complexity, growing interest in low-carbon ingredients, and the expansion of precision-fermentation capacity further stimulate uptake. Country-level livestock modernization programs and life-cycle assessment requirements create competitive advantages for suppliers that document environmental performance. Medium-term raw-material price volatility and trade measures on Chinese lysine encourage regional production investments while tightening supply options.
Key Report Takeaways
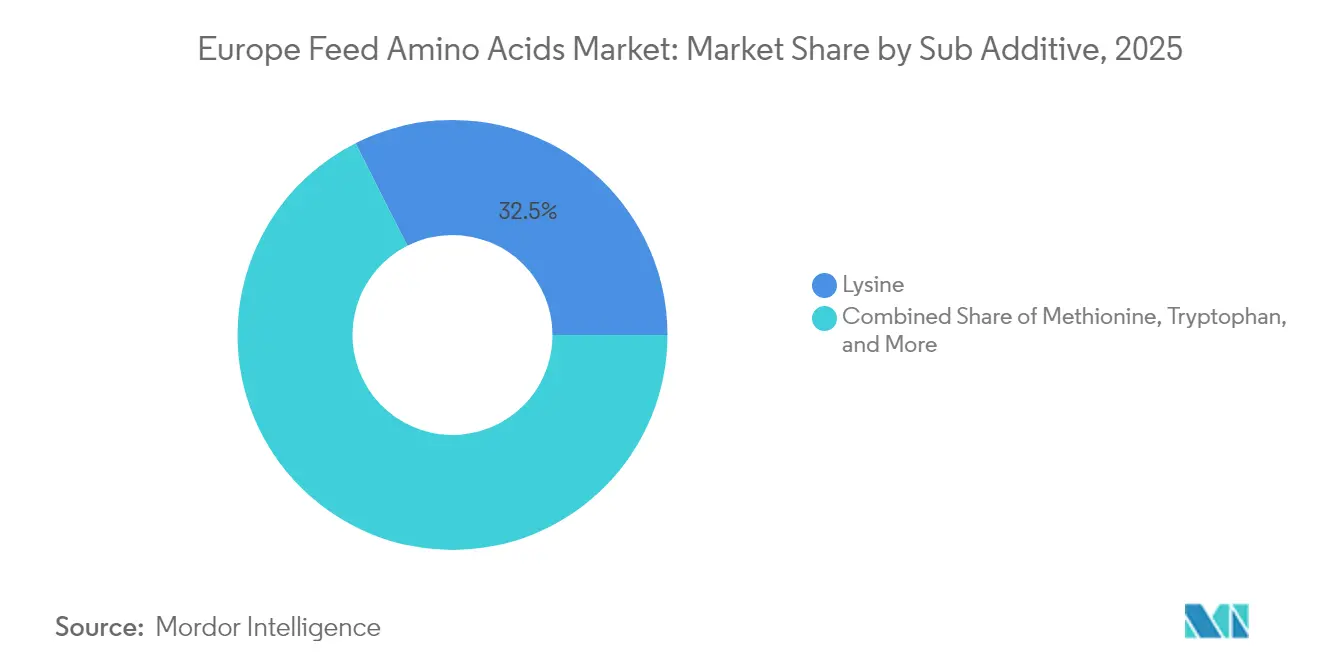
- By sub-additive, lysine captured 32.45% of the European feed amino acids market share in 2025, while methionine is projected to expand at a 4.62% CAGR through 2031.
- By animal, poultry accounted for 34.65% of the European feed amino acids market size in 2025, and swine segment is positioned for the fastest 4.78% CAGR to 2031.
- By geography, Spain led with 15.60% revenue share in 2025, whereas the United Kingdom is forecast to clock the quickest 5.04% CAGR during the outlook period.
Note: Market size and forecast figures in this report are generated using Mordor Intelligence’s proprietary estimation framework, updated with the latest available data and insights as of 2026.
Europe Feed Amino Acids Market Trends and Insights
Drivers Impact Analysis*
| Driver | (~) % Impact on CAGR Forecast | Geographic Relevance | Impact Timeline |
|---|---|---|---|
| Surge in Demand for High-Protein Poultry Meat | +0.6% | Spain, France, Germany core markets | Medium term (2-4 years) |
| Tightening European Union (EU) Limits on Antibiotic Growth Promoters | +0.8% | EU-27 excluding Russia and Turkey | Long term (≥ 4 years) |
| Cost Optimization Through Precision-Fermentation Amino Acids | +0.7% | Netherlands, Germany, France | Medium term (2-4 years) |
| Adoption of Net-Zero Feed Formulation Targets by Integrators | +0.9% | UK, Netherlands, Germany, France | Long term (≥ 4 years) |
| Growth of Insect-Based Protein Requiring Balanced Amino Acid Profiles | +0.5% | Netherlands, France, Germany | Long term (≥ 4 years) |
| Expansion of Specialty Feed Additive Blends by Premix Companies | +0.6% | Germany, Netherlands, France | Short term (≤ 2 years) |
| Source: Mordor Intelligence | |||


Surge in Demand for High-Protein Poultry Meat
Modern genetics requires precise lysine-to-methionine ratios, boosting synthetic amino acid inclusion. Spanish and French integrators are elevating methionine from 0.15% to 0.25% of finished feed to realize higher breast-meat yields. Processors marketing antibiotic-free labels depend on balanced amino acid nutrition to maintain growth without pharmaceuticals. This structural requirement underpins volume growth for suppliers with poultry-specific technical support. The underlying trend directly strengthens the European feed amino acids market by expanding repeat-purchase necessity.
Tightening EU Limits on Antibiotic Growth-Promoters
Since 2024, European Medicines Agency guidelines require performance gains to rely on nutrition rather than prophylactic antibiotics[1]European Medicines Agency, “Antimicrobial resistance prevention guidelines,” ema.europa.eu. Swine producers must now supplement essential amino acids to sustain daily gain targets previously supported by low-dose antimicrobials. Larger feed mills employ nutrient optimization software, often reformulating monthly to prove regulatory compliance. The policy accelerates demand for high-purity lysine, threonine, and valine, as these nutrients limit growth when antibiotic support is removed. Suppliers that bundle advisory services on gut-health amino acid ratios gain bargaining power with integrators. Over the long term, the rule cements amino acids as indispensable nutritional tools, reinforcing the European feed amino acids market trajectory.
Cost Optimization Through Precision-Fermentation Amino Acids
Fermentation yields now exceed 90%, trimming variable costs for lysine and threonine by up to 20% versus chemical synthesis. Dutch and German biotechnology clusters channel venture funding toward scaled fermenters, shortening order lead times inside Europe. Lower freight expenses, coupled with stable quality, attract feed mills seeking dependable supply amid volatile import tariffs. Producers such as Evonik leverage renewable electricity to further shrink carbon footprints, enabling pricing premiums when feed integrators score ingredients on sustainability. As operating metrics improve, precision-fermentation erodes cost gaps that once favored Asian imports, protecting margins while enlarging regional volumes throughout the European feed amino acids market.
Adoption of Net-Zero Feed Formulation Targets by Integrators
Leading groups like InVivo quantify life-cycle footprints for every kilogram of purchased additive, pushing suppliers to deliver verified greenhouse-gas data. Integrators blend carbon scoring into least-cost formulation software, allowing amino acids with lower footprints to displace higher-impact protein meals. Suppliers invest in third-party verification and renewable power contracts to secure preferred-supplier status. The United Kingdom retailers extend the pressure, asking poultry producers to publish feed-related emissions on pack. Over four years, climate reporting mandates convert environmental credentials into commercial tender prerequisites, effectively rewarding sustainable amino acid producers and amplifying scale across the European feed amino acids market.
Restraints Impact Analysis*
| Restraint | (~) % Impact on CAGR Forecast | Geographic Relevance | Impact Timeline |
|---|---|---|---|
| Volatile Raw-Material Prices (Corn, Soy, Sugar) | -0.4% | Spain, France, Germany, Italy | Short term (≤ 2 years) |
| Competition from Single-Cell Protein as Direct Replacement | -0.3% | Netherlands, Germany, UK | Medium term (2-4 years) |
| Stringent Carbon-Footprint Labeling Rules Raising Compliance Costs | -0.5% | EU-27, UK particularly stringent | Medium term (2-4 years) |
| Slow License Approvals for New Biosynthetic Pathways | -0.2% | EU-27 regulatory framework | Long term (≥ 4 years) |
| Source: Mordor Intelligence | |||
Volatile Raw-Material Prices (Corn, Soy, Sugar)
European feed wheat futures for 2025 trade at GBP 195.50 per ton (USD 244.4) as French harvest setbacks and export competition squeeze supply.[2]Agriculture and Horticulture Development Board, “2025 wheat futures prices rise vs crop 2024,” ahdb.org.uk Sharper cost swings prompt mills to recalculate least-cost formulas weekly, unsettling forward purchases of amino acids. When grains spike, formulators raise synthetic lysine levels to spare protein meals; when grains retreat, the reverse occurs, muting net demand. Smaller mills with limited hedging capacity postpone contracts, eroding supplier shipment visibility. This volatility introduces working-capital strain across the European feed amino acids market, particularly for firms carrying buffer inventories. While the impact is temporary, it compresses margins during periods of extreme price divergence.
Competition from Single-Cell Protein as Direct Replacement
DSM-Firmenich and emerging biotechnology startups scale microbial protein production that embeds balanced amino acids within a whole-protein matrix. At cost parity with concentrated soybean meal, single-cell protein can replace both plant protein and separate lysine or threonine additions. Dutch aquafeed trials report feed-conversion improvements when single-cell protein comprises 15% of rations, reducing the need for isolated amino acids. National regulators clear microbial protein for poultry and swine, unlocking larger addressable volumes. Although adoption remains nascent, every incremental ton displaces the equivalent amino acid inclusion, trimming growth potential in the European feed amino acids market during the medium term.
*Our forecasts treat driver/restraint impacts as directional, not additive. The impact forecasts reflect baseline growth, mix effects, and variable interactions.
Segment Analysis
By Sub-Additive: Methionine Momentum Amid Lysine Leadership
In 2025, lysine captured 32.45% of the European feed amino acids market, bolstered by its role as the primary limiting amino acid in cereal-soy diets. Despite trade disruptions, the European market for lysine is poised for steady volume growth. This is largely due to regulatory anti-dumping duties on Chinese imports, which have spurred commitments to bolster local production. Meanwhile, methionine is set to chart the fastest growth, with a projected CAGR of 4.62% through 2031. This surge is driven by heightened demands from broiler genetics, which seek a richer sulfur amino acid content for optimal feather development and enhanced breast-meat yield.
Broiler producers in Europe, particularly in Spain and France, have upped their DL-methionine diet inclusion to 0.25%, a level seldom reached just five years prior. Threonine is gaining traction for its role in maintaining gut integrity, especially in antibiotic-free swine systems. Its usage has now surpassed 0.10% in finishing pig feed in the Netherlands. Tryptophan, on the other hand, maintains a premium niche, being favored for its high inclusion in stress relief strategies for turkeys and layers. Specialty amino acids like valine and isoleucine are garnering attention as nutrition programs hone in on ideal protein formulations. The European Food Safety Authority's (EFSA) clarifications on safe usage levels are further propelling their adoption. Suppliers in the European feed amino acids market are carving out a competitive edge by emphasizing particle-size uniformity and dust-free granulation. These features not only enhance premix flowability and ensure feed mill safety but also bolster the suppliers' market position.


By Animal: Poultry Strength with Accelerating Swine Recovery
Poultry accounted for 34.65% of the European feed amino acids market share in 2025, reflecting the industry's reliance on synthetic methionine and lysine to improve feed conversion ratios. The ongoing shift away from antibiotic growth promoters increases the importance of precise amino acid supplementation to maintain growth rates. The transition to cage-free layer systems requires higher amino acid concentrations to mitigate environmental stress effects.
The swine segment is projected to grow at a 4.78% CAGR during the forecasted period, showing recovery after African swine fever in Eastern Europe, where large-scale farms with enhanced biosecurity implement sophisticated nutrition programs. The market share for weaned pig feed amino acids is increasing as threonine and tryptophan demonstrate effectiveness in reducing post-weaning stress and improving feed consumption. The aquaculture segment continues to grow, particularly in Norway and Turkey, incorporating crystalline lysine and methionine as alternatives to marine protein sources to manage feed costs.

Geography Analysis
Spain held 15.60% of revenue in 2025, driven by integrated poultry and swine firms. Favorable climate and export-oriented meat packing sustain continuous feed production growth. Germany's technologically advanced feed industry generates high per-animal amino acid consumption, particularly in Baden-Württemberg and Lower Saxony clusters, where livestock density peaks. France leverages its comprehensive research network to test novel amino acid blends, frequently converting pilot findings into commercial-scale adoption within two years. Together, these three markets shape specification benchmarks that ripple through distributor networks across the European feed amino acids market.
Western Europe dominates the European feed amino acids market, anchored by Spain's sizable poultry and swine sectors and Germany's high-tech feed mills that adopt multiple crystalline amino acids per formulation. Integrated producers in Brittany, Lower Saxony, and Catalonia reinforce predictable purchasing cycles, providing baseline demand stability. Stringent environmental rules in these zones heighten nitrogen emission penalties, prompting formulators to leverage amino acids to lower crude protein levels while maintaining growth performance. As regulations harden, the relative margin benefit of precision amino acid application rises, encouraging additional layers of supplementation and elevating per-ton usage intensity.
The United Kingdom reflects the quickest 5.04% CAGR during the outlook period. Accelerated growth stems from government-backed productivity grants and retailer sustainability mandates that grade suppliers on feed-related greenhouse-gas emissions. Carbon-constrained least-cost models reward amino acids produced via renewable-energy-powered fermentation, catalyzing contract shifts toward regionally produced material. The Netherlands, though limited in landmass, exerts disproportionate influence because it feeds R&D centers located in Wageningen and Utrecht rapidly disseminate trial data that become European formulation norms. Eastern European nations, Poland, Hungary, and the Czech Republic, transition from smallholder to industrial livestock systems, importing formulation expertise and gradually catching up in amino acid inclusion rates. These transitions convert previously low-intensity markets into sizeable incremental outlets for the Europe feed amino acids market.
Competitive Landscape
The top five players accounted for a modest share of market revenue in 2024, indicating moderate consolidation driven by established economies of scale while maintaining opportunities for specialized market entrants. Evonik Industries maintains market leadership through its European supply chain network and proprietary formulation software that analyzes methionine cost-benefit ratios across various raw material scenarios. Ajinomoto and ADM focus on improving fermentation yields to maintain margins despite anti-dumping duties that benefit regional producers.
Chinese manufacturers like Fufeng expanded their product ranges to include valine, isoleucine, and glutamic acid, reducing tariff risks and meeting the demand for comprehensive amino acid solutions from integrators. European premix companies, including Kemin Industries, pursue vertical integration by incorporating specialized amino acid blends into micronutrient packages, increasing their market share among smaller feed mills. Biotechnology companies challenge established players by offering microbial lysine with 30% lower greenhouse gas emissions, appealing to integrators with sustainability requirements.
Competition increasingly focuses on technical service offerings, with suppliers collaborating with customers to develop nutrient matrices incorporating performance data feedback. Companies establish research partnerships with European universities to access early trial results. They expand market presence through exclusive distribution agreements in Central and Eastern Europe without significant capital investment. Supply chain resilience has become a key priority following pandemic-related disruptions, leading to investments in multiple European warehouses to reduce delivery times. Companies combining production capacity with local service networks gain advantages over commodity importers, increasing market share while maintaining opportunities for innovative market entrants.
Europe Feed Amino Acids Industry Leaders
Adisseo
Evonik Industries AG
IFF(Danisco Animal Nutrition)
SHV (Nutreco NV)
Archer Daniels Midland Co.
- *Disclaimer: Major Players sorted in no particular order


Recent Industry Developments
- August 2024: Allozymes has partnered with Adisseo to develop eco-friendly bioprocesses for animal feed, starting with methionine. This marks one of Allozymes’ first European collaborations since expanding into the region earlier this year. The company will design tailored enzymes to support Adisseo’s sustainability and production goals.
- September 2022: The partnership between Evonik and BASF allowed Evonik certain non-exclusive licensing rights to OpteinicsTM, a digital solution to improve comprehension and reduce the environmental impact of the animal protein and feed industries.


Europe Feed Amino Acids Market Report Scope
Sub Additive
| Lysine |
| Methionine |
| Threonine |
| Tryptophan |
| Other Amino Acids |
Animal
| Aquaculture | Fish |
| Shrimp | |
| Other Aquaculture Species | |
| Poultry | Broiler |
| Layer | |
| Other Poultry Birds | |
| Ruminants | Beef Cattle |
| Dairy Cattle | |
| Other Ruminants | |
| Swine | |
| Other Animals |
Geography
| France |
| Germany |
| Italy |
| Netherlands |
| Russia |
| Spain |
| Turkey |
| United Kingdom |
| Rest of Europe |
| Sub Additive | Lysine | |
| Methionine | ||
| Threonine | ||
| Tryptophan | ||
| Other Amino Acids | ||
| Animal | Aquaculture | Fish |
| Shrimp | ||
| Other Aquaculture Species | ||
| Poultry | Broiler | |
| Layer | ||
| Other Poultry Birds | ||
| Ruminants | Beef Cattle | |
| Dairy Cattle | ||
| Other Ruminants | ||
| Swine | ||
| Other Animals | ||
| Geography | France | |
| Germany | ||
| Italy | ||
| Netherlands | ||
| Russia | ||
| Spain | ||
| Turkey | ||
| United Kingdom | ||
| Rest of Europe | ||


Market Definition
- FUNCTIONS - For the study, feed additives are considered to be commercially manufactured products that are used to enhance characteristics such as weight gain, feed conversion ratio, and feed intake when fed in appropriate proportions.
- RESELLERS - Companies engaged in reselling feed additives without value addition have been excluded from the market scope, to avoid double counting.
- END CONSUMERS - Compound feed manufacturers are considered to be end-consumers in the market studied. The scope excludes farmers buying feed additives to be used directly as supplements or premixes.
- INTERNAL COMPANY CONSUMPTION - Companies engaged in the production of compound feed as well as the manufacturing of feed additives are part of the study. However, while estimating the market sizes, the internal consumption of feed additives by such companies has been excluded.
| Keyword | Definition |
|---|---|
| Feed additives | Feed additives are products used in animal nutrition for purposes of improving the quality of feed and the quality of food from animal origin, or to improve the animals’ performance and health. |
| Probiotics | Probiotics are microorganisms introduced into the body for their beneficial qualities. (It maintains or restores beneficial bacteria to the gut). |
| Antibiotics | Antibiotic is a drug that is specifically used to inhibit the growth of bacteria. |
| Prebiotics | A non-digestible food ingredient that promotes the growth of beneficial microorganisms in the intestines. |
| Antioxidants | Antioxidants are compounds that inhibit oxidation, a chemical reaction that produces free radicals. |
| Phytogenics | Phytogenics are a group of natural and non-antibiotic growth promoters derived from herbs, spices, essential oils, and oleoresins. |
| Vitamins | Vitamins are organic compounds, which are required for normal growth and maintenance of the body. |
| Metabolism | A chemical process that occurs within a living organism in order to maintain life. |
| Amino acids | Amino acids are the building blocks of proteins and play an important role in metabolic pathways. |
| Enzymes | Enzyme is a substance that acts as a catalyst to bring about a specific biochemical reaction. |
| Anti-microbial resistance | The ability of a microorganism to resist the effects of an antimicrobial agent. |
| Anti-microbial | Destroying or inhibiting the growth of microorganisms. |
| Osmotic balance | It is a process of maintaining salt and water balance across membranes within the body's fluids. |
| Bacteriocin | Bacteriocins are the toxins produced by bacteria to inhibit the growth of similar or closely related bacterial strains. |
| Biohydrogenation | It is a process that occurs in the rumen of an animal in which bacteria convert unsaturated fatty acids (USFA) to saturated fatty acids (SFA). |
| Oxidative rancidity | It is a reaction of fatty acids with oxygen, which generally causes unpleasant odors in animals. To prevent these, antioxidants were added. |
| Mycotoxicosis | Any condition or disease caused by fungal toxins, mainly due to contamination of animal feed with mycotoxins. |
| Mycotoxins | Mycotoxins are toxin compounds that are naturally produced by certain types of molds (fungi). |
| Feed Probiotics | Microbial feed supplements positively affect gastrointestinal microbial balance. |
| Probiotic yeast | Feed yeast (single-cell fungi) and other fungi used as probiotics. |
| Feed enzymes | They are used to supplement digestive enzymes in an animal’s stomach to break down food. Enzymes also ensure that meat and egg production is improved. |
| Mycotoxin detoxifiers | They are used to prevent fungal growth and to stop any harmful mold from being absorbed in the gut and blood. |
| Feed antibiotics | They are used both for the prevention and treatment of diseases but also for rapid growth and development. |
| Feed antioxidants | They are used to protect the deterioration of other feed nutrients in the feed such as fats, vitamins, pigments, and flavoring agents, thus providing nutrient security to the animals. |
| Feed phytogenics | Phytogenics are natural substances, added to livestock feed to promote growth, aid in digestion, and act as anti-microbial agents. |
| Feed vitamins | They are used to maintain the normal physiological function and normal growth and development of animals. |
| Feed flavors and sweetners | These flavors and sweeteners help to mask tastes and odors during changes in additives or medications and make them ideal for animal diets undergoing transition. |
| Feed acidifiers | Animal feed acidifiers are organic acids incorporated into the feed for nutritional or preservative purposes. Acidifiers enhance congestion and microbiological balance in the alimentary and digestive tracts of livestock. |
| Feed minerals | Feed minerals play an important role in the regular dietary requirements of animal feed. |
| Feed binders | Feed binders are the binding agents used in the manufacture of safe animal feed products. It enhances the taste of food and prolongs the storage period of the feed. |
| Key Terms | Abbreviation |
| LSDV | Lumpy Skin Disease Virus |
| ASF | African Swine Fever |
| GPA | Growth Promoter Antibiotics |
| NSP | Non-Starch Polysaccharides |
| PUFA | Polyunsaturated Fatty Acid |
| Afs | Aflatoxins |
| AGP | Antibiotic Growth Promoters |
| FAO | The Food And Agriculture Organization of the United Nations |
| USDA | The United States Department of Agriculture |


Research Methodology
Mordor Intelligence follows a four-step methodology in all our reports.
- Step-1: IDENTIFY KEY VARIABLES: In order to build a robust forecasting methodology, the variables and factors identified in Step-1 are tested against available historical market numbers. Through an iterative process, the variables required for market forecast are set and the model is built on the basis of these variables.
- Step-2: Build a Market Model: Market-size estimations for the forecast years are in nominal terms. Inflation is not a part of the pricing, and the average selling price (ASP) is kept constant throughout the forecast period.
- Step-3: Validate and Finalize: In this important step, all market numbers, variables and analyst calls are validated through an extensive network of primary research experts from the market studied. The respondents are selected across levels and functions to generate a holistic picture of the market studied.
- Step-4: Research Outputs: Syndicated Reports, Custom Consulting Assignments, Databases & Subscription Platforms


