United States Feed Amino Acids Market Size and Share
Market Overview
| Study Period | 2018 - 2031 |
|---|---|
| Forecast Data Period | 2026 - 2031 |
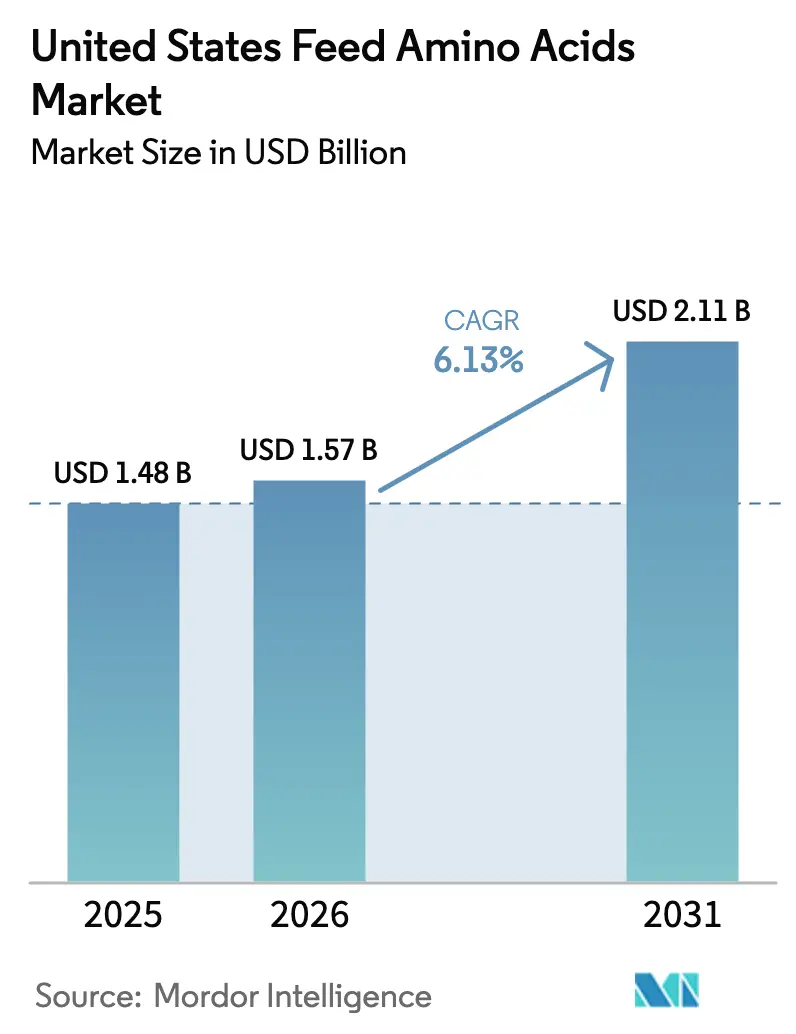
| Base Year Market Size (2025) | USD 1.48 Billion |
| Market Size (2026) | USD 1.57 Billion |
| Market Size (2031) | USD 2.11 Billion |
| Growth Rate (2026 - 2031) | 6.13% CAGR |
| Market Concentration | Medium |
Major Players *Disclaimer: Major Players sorted in no particular order Image © Mordor Intelligence. Reuse requires attribution under CC BY 4.0. | |
United States Feed Amino Acids Market Analysis by Mordor Intelligence
The United States feed amino acids market size in 2026 is estimated at USD 1.57 billion, growing from 2025 value of USD 1.48 billion with 2031 projections showing USD 2.11 billion, growing at 6.13% CAGR over 2026-2031. This expansion reflects a decisive shift from commodity feed additives to precision-nutrition solutions that improve protein efficiency, lower nitrogen emissions, and support regulatory compliance. Crystalline amino acids now anchor protein-balancing strategies that trim crude-protein levels without compromising animal performance. Sustained growth in poultry and swine feed, a permanent shift away from antibiotic growth promoters, and tariff-driven interest in domestic fermentation capacity continue to drive demand. The adoption of technology, from AI-enabled formulation software to protected-release delivery systems, further widens the addressable scope for specialized amino acids across all production species [1]Source: Heather McGuire Doyle, “AFIA Supports Legislation to Reduce US Dependence on China for Feed Ingredients,” Feedinfo, feedinfo.com .
Key Report Takeaways
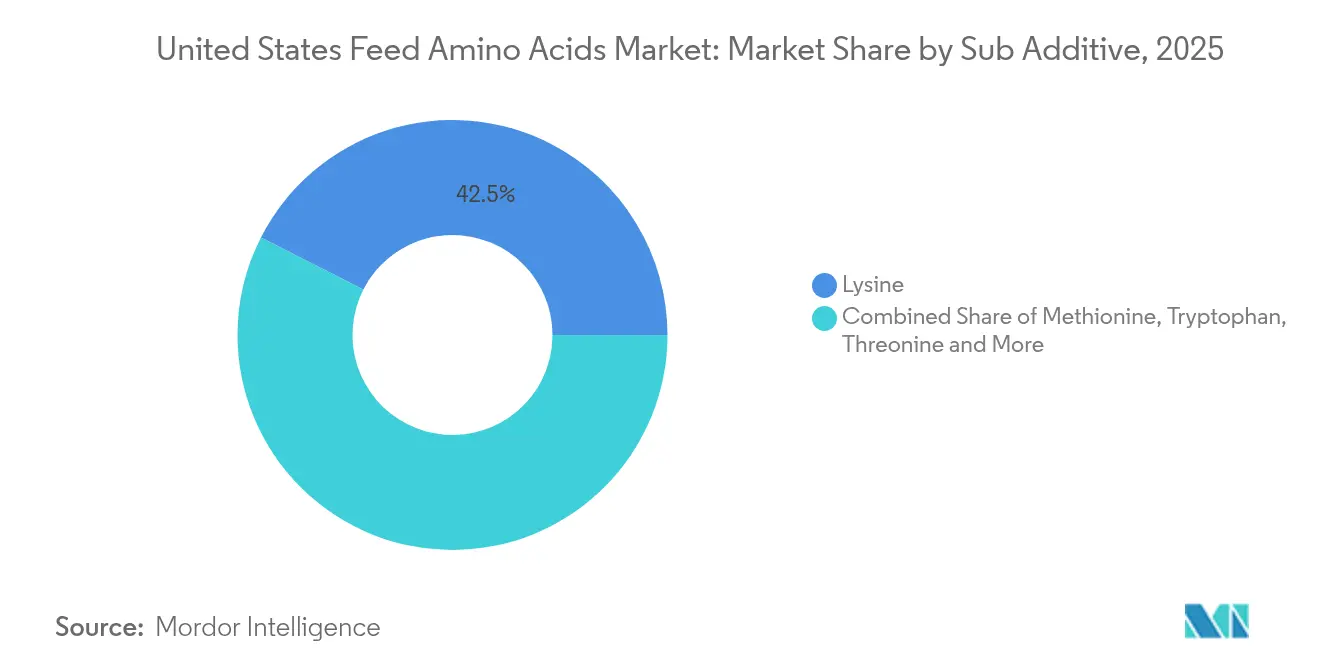
- By sub additive, lysine commanded 42.50% of the United States feed amino acids market share in 2025, while methionine was projected to register the fastest CAGR at 6.21% through 2031.
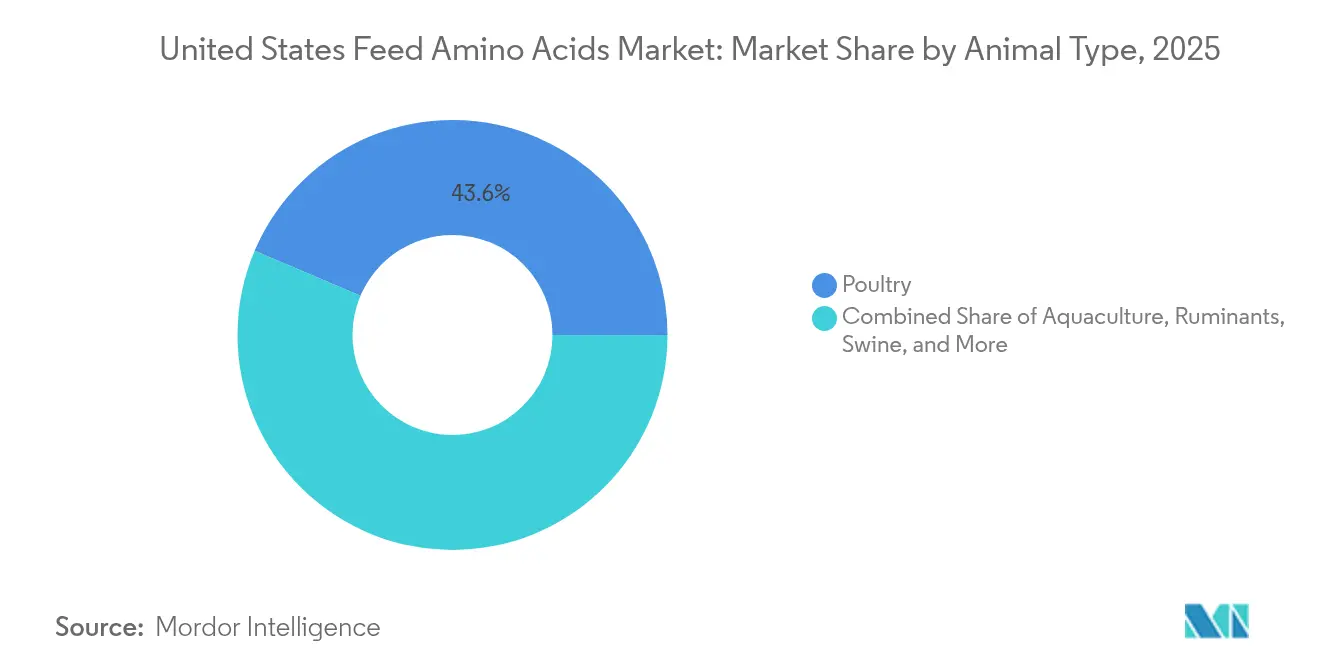
- By animal, poultry led with 43.60% revenue share in 2025, and aquaculture is poised for the highest growth at a 6.26% CAGR through 2031.
Note: Market size and forecast figures in this report are generated using Mordor Intelligence’s proprietary estimation framework, updated with the latest available data and insights as of 2026.
United States Feed Amino Acids Market Trends and Insights
Drivers Impact Analysis*
| Driver | (~) % Impact on CAGR Forecast | Geographic Relevance | Impact Timeline |
|---|---|---|---|
| Rising Poultry and Swine Feed Volumes | +1.20% | Iowa, North Carolina, Texas | Medium term (2-4 years) |
| Regulatory Push to Curtail Antibiotic Growth Promoters | +0.80% | Nationwide under FDA oversight | Long term (≥ 4 years) |
| Cost-Effective Protein Balancing via Crystalline Amino Acids | +1.50% | Midwest feed corridors | Short term (≤ 2 years) |
| Tariff-Driven Reshoring of Domestic Fermentation Capacity | +0.70% | Midwest and Southeast investment zones | Long term (≥ 4 years) |
| AI-Driven Precision Nutrition Platforms | +0.90% | Early adopter integrators nationwide | Medium term (2-4 years) |
| Functional Amino Acids Targeting Immunity and Stress | +0.60% | Premium segments across the country | Medium term (2-4 years) |
| Source: Mordor Intelligence | |||


Rising Poultry and Swine Feed Volumes
Feed demand continues to climb as broiler, layer, and hog inventories expand, pushing total livestock feed consumption. Large integrated complexes in Iowa, North Carolina, and Texas account for more than one-third of the national feed throughput, enabling the economical distribution of crystalline amino acids and facilitating the rapid adoption of lower crude-protein diets. Producers see immediate cost savings and feed-conversion benefits when lysine, methionine, threonine, and tryptophan are precisely matched to genetic potential, especially under modern phase-feeding programs [2]Source: “November/December 2024,” Feed Strategy, feedstrategy.com .
Regulatory Push to Curtail Antibiotic Growth Promoters
The Food and Drug Administration’s (FDA's) long-standing effort to combat antimicrobial resistance has led to a permanent shift in management practices toward non-medicated performance enhancers. Functional amino acids that fortify gut integrity and immunity now play core roles in maintaining growth metrics once attributed to antibiotic growth promoters. As a result, the inclusion of threonine and tryptophan has broadened, and feed mills have invested in advanced quality-control laboratories to standardize amino-acid supply, ensuring predictable animal-health outcomes across multi-site operations [3]Source: European Food Safety Authority, “Safety and efficacy of a feed additive consisting of l-isoleucine produced with Corynebacterium glutamicum CGMCC 20437,” efsa.europa.eu .
Cost-Effective Protein Balancing via Crystalline Amino Acids
Elevated soybean-meal prices relative to energy grains continue to validate lower-protein formulations. Nutritionists routinely reduce dietary protein by 2-4% points and supplement with crystalline amino acids to maintain essential ratios, thereby lowering feed cost per ton and reducing nitrogen excretion by up to 15% in monogastrics. The strategy is particularly effective in swine finisher diets, where precise amino-acid adjustments improve carcass leanness and feed efficiency [4]Source: Kansas State University Department of Animal Sciences, “Feed-Grade Amino Acids,” asi.k-state.edu .
Tariff-Driven Reshoring of Domestic Fermentation Capacity
Supply-chain shocks and proposed legislation to secure agricultural inputs spur investment in United States fermentation assets. Although 78% of the world's lysine and 92% of threonine capacity still originates from China, federal incentives and regional tax credits are encouraging joint ventures that pair biotechnology firms with feed majors to establish scalable Midwestern plants. These projects promise supply security and shorter delivery lead times while creating regional feed-grade acid hubs.
Restraints Impact Analysis*
| Restraint | (~) % Impact on CAGR Forecast | Geographic Relevance | Impact Timeline |
|---|---|---|---|
| Raw-Material Price Volatility (Corn, Soybean) | -1.10% | Midwest feed corridors | Short term (≤ 2 years) |
| High Capital Intensity of Fermentation Plants | -0.80% | Nationwide | Long term (≥ 4 years) |
| Import Dependency on Asia-Based Producers | -0.90% | Nationwide | Medium term (2-4 years) |
| Formulation Complexity at Very Low-Crude-Protein Diets | -0.60% | Nationwide | Medium term (2-4 years) |
| Source: Mordor Intelligence | |||
Raw-Material Price Volatility (Corn, Soybean)
Rapid swings in corn and soybean meal prices compress the cost advantage of crystalline amino acids. During low-protein meal cycles, feed mills sometimes revert to higher intact-protein inclusion, a move that temporarily dampens synthetic amino acid uptake. Price uncertainty complicates forward contracting and inventory planning, prompting nutritionists to hold safety stocks or chase spot markets, each option carrying margin risk.
High Capital Intensity of Fermentation Plants
Modern amino-acid plants command investments well above USD 100 million and require deep biochemical engineering expertise. Lengthy permitting, sophisticated downstream-purification equipment, and the need for continuous operations limit greenfield construction. Only large multinationals or strategic partnerships can absorb these fixed costs, slowing domestic capacity growth despite political support for reshoring initiatives.
*Our forecasts treat driver/restraint impacts as directional, not additive. The impact forecasts reflect baseline growth, mix effects, and variable interactions.
Segment Analysis
By Sub-Additive: Lysine Outpaces Rivals in Core Diets
Lysine retained 42.50% of 2025 revenue share because it corrects the first limiting deficiency in corn-soy formulas that dominate United States livestock diets. The United States' feed amino acids market size, attributed to lysine applications, is bolstered by consistent uptake across poultry, swine, and aqua feeds. Continuous improvements in fermentation yield and downstream efficiency have aligned prices with cost-of-gain targets for integrators, keeping lysine volumes resilient even during protein-meal price troughs.
Broader precision-nutrition efforts keep methionine in the spotlight, and its forecast 6.21% CAGR signals growing importance in feathering, methyl-donor metabolism, and fish-meal replacement in aqua diets. Suppliers invest heavily in hydroxy analogs and encapsulated forms that overcome pH-related absorption barriers, creating value pockets beyond standard DL-methionine. Threonine, tryptophan, valine, and isoleucine, although currently smaller, are experiencing compound demand as ultra-low protein regimes test the fourth and fifth limiting amino acids. Regulatory approvals for new fermentation routes promise lower carbon footprints and diversified sourcing.


By Animal: Poultry Scale Meets Aqua Momentum
Poultry’s 43.60% share reflects an industry that aggressively benchmarks feed-conversion ratio improvements. In 2026, broiler companies incorporated at least two synthetic amino acids in every formulation stage, driving an estimated United States feed amino acids market size of USD 0.69 billion for this species alone. Consistency of amino-acid supply and deep formulation knowledge allow integrators to capture marginal gains that translate directly into carcass yield and breast-meat quality.
Aquaculture, growing at a 6.26% CAGR, represents the frontier for specialized amino-acid nutrition. Carnivorous species require precise methionine and lysine balances when fish meal is partially or fully replaced with plant proteins, and crustaceans further demand taurine, β-alanine, and conditionally essential compounds. Investors are funding on-farm feed centers that tailor small-batch diets for trout, tilapia, and shrimp, deepening penetration of high-purity amino acids. Ruminant and swine segments follow mature but stable adoption curves, while equine and specialty animals provide niche channels for protected amino-acid formats that command premium pricing.
Geography Analysis
Regional consumption is tightly coupled to livestock density. The Midwest dominates, led by Iowa at followed by Nebraska and Kansas. Co-location of corn, soybean crushing, and feed manufacturing infrastructure underpins low logistics costs, fostering rapid replenishment cycles for lysine and threonine delivered by rail or truck from Gulf or Pacific ports. Environmental rules that cap nitrogen emissions in states such as Minnesota encourage low-protein diets, thereby increasing the volume of crystalline amino acids in pig and turkey rations.
The Southeast emerges as a second consumption pole, anchored by North Carolina’s dual-species complexes and Georgia’s poultry belt. Here, methionine demand is highest due to its critical role in feathers, while hurricane-season logistics risk drives feed mills to maintain strategic stock levels. Texas bridges the Midwest and Southeast corridors, which support beef, dairy, and an expanding broiler footprint. Its coastal proximity streamlines port-of-entry flows for Asian imports, yet simultaneously positions it to benefit from any domestic fermentation capacity in the Gulf or lower Mississippi region.
The West Coast remains a smaller but technologically advanced market, with California dairies employing rumen-protected methionine and lysine to push milk-component yields under strict manure-nitrogen caps. Aqua ventures in Idaho and Washington deploy specialty amino-acid blends to elevate plant-protein digestibility in freshwater trout and salmon diets. Across all regions, state-level nutrient-management legislation dictates how vigorously feed mills adopt crystalline amino acids, with stricter thresholds directly correlating with higher inclusion rates.
Competitive Landscape
The market is moderately consolidated, with the top five producers accounting for a significant portion of the projected 2024 revenue. This provides them with economies of scale while leaving nearly half of the United States feed amino acids market open to competition from specialty players. Evonik Industries AG leads through integrated production and advisory services that benchmark farm performance against amino-acid utilization efficiency. Archer Daniels Midland Co. follows, leveraging its grain-origination and transport network to bundle amino acids with other macro ingredients, reducing freight costs for compounders.
Below the leaders, mid-tier firms carve niches via protected forms, low-endotoxin grades, or AI-supported formulation platforms. Competitive leverage now rests less on list price and more on guaranteed digestibility coefficients, analytical backup, and deliver-on-demand logistics. Supply-security concerns post-pandemic have encouraged feed mills to multi-source across at least three suppliers, eroding single-supplier dominance and rewarding companies that maintain U.S. buffer stocks.
Rising sustainability metrics and Scope 3 emission reporting add a new competitive dimension. Producers with fermentation plants that run on renewable energy or upcycled carbohydrate streams position themselves favorably with integrators whose meat customers demand lower carbon footprints. Strategic investments in Midwestern fermentation hubs could shift regional balance; early movers may secure long-term off-take deals that lock in volumes and margins. Technical partnerships with AI and sensor companies further differentiate suppliers capable of embedding their amino acid datasets into real-time feed formulation ecosystems.
United States Feed Amino Acids Industry Leaders
Archer Daniel Midland Co.
Evonik Industries AG
Land O'Lakes, Inc.
Nutreco N.V. (SHV Holdings N.V.)
Danisco Animal Nutrition & Health (International Flavors and Fragrances Inc. (IFF))
- *Disclaimer: Major Players sorted in no particular order

Recent Industry Developments
- December 2024: USDA mandated nationwide testing of milk deliveries for avian influenza starting Dec 16, 2024, tightening on-farm biosecurity and elevating interest in immune-supporting amino acids.
- October 2024: The European Union opened an anti-dumping investigation into choline chloride imports from China, heightening vigilance on feed-additive trade flows, which may redirect buyers toward U.S.-sourced alternatives.
- March 2024: Evonik released its 2023 USA Crop Report, supplying region-specific amino-acid composition data that supports precision formulation.


United States Feed Amino Acids Market Report Scope
Lysine, Methionine, Threonine, Tryptophan are covered as segments by Sub Additive. Aquaculture, Poultry, Ruminants, Swine are covered as segments by Animal.| Lysine |
| Methionine |
| Threonine |
| Tryptophan |
| Other Amino Acids |
| Aquaculture | Fish |
| Shrimp | |
| Other Aquaculture Species | |
| Poultry | Broiler |
| Layer | |
| Other Poultry Birds | |
| Ruminants | Beef Cattle |
| Dairy Cattle | |
| Other Ruminants | |
| Swine | |
| Other Animals |
| By Sub-Additive | Lysine | |
| Methionine | ||
| Threonine | ||
| Tryptophan | ||
| Other Amino Acids | ||
| By Animal | Aquaculture | Fish |
| Shrimp | ||
| Other Aquaculture Species | ||
| Poultry | Broiler | |
| Layer | ||
| Other Poultry Birds | ||
| Ruminants | Beef Cattle | |
| Dairy Cattle | ||
| Other Ruminants | ||
| Swine | ||
| Other Animals | ||


Market Definition
- FUNCTIONS - For the study, feed additives are considered to be commercially manufactured products that are used to enhance characteristics such as weight gain, feed conversion ratio, and feed intake when fed in appropriate proportions.
- RESELLERS - Companies engaged in reselling feed additives without value addition have been excluded from the market scope, to avoid double counting.
- END CONSUMERS - Compound feed manufacturers are considered to be end-consumers in the market studied. The scope excludes farmers buying feed additives to be used directly as supplements or premixes.
- INTERNAL COMPANY CONSUMPTION - Companies engaged in the production of compound feed as well as the manufacturing of feed additives are part of the study. However, while estimating the market sizes, the internal consumption of feed additives by such companies has been excluded.
| Keyword | Definition |
|---|---|
| Feed additives | Feed additives are products used in animal nutrition for purposes of improving the quality of feed and the quality of food from animal origin, or to improve the animals’ performance and health. |
| Probiotics | Probiotics are microorganisms introduced into the body for their beneficial qualities. (It maintains or restores beneficial bacteria to the gut). |
| Antibiotics | Antibiotic is a drug that is specifically used to inhibit the growth of bacteria. |
| Prebiotics | A non-digestible food ingredient that promotes the growth of beneficial microorganisms in the intestines. |
| Antioxidants | Antioxidants are compounds that inhibit oxidation, a chemical reaction that produces free radicals. |
| Phytogenics | Phytogenics are a group of natural and non-antibiotic growth promoters derived from herbs, spices, essential oils, and oleoresins. |
| Vitamins | Vitamins are organic compounds, which are required for normal growth and maintenance of the body. |
| Metabolism | A chemical process that occurs within a living organism in order to maintain life. |
| Amino acids | Amino acids are the building blocks of proteins and play an important role in metabolic pathways. |
| Enzymes | Enzyme is a substance that acts as a catalyst to bring about a specific biochemical reaction. |
| Anti-microbial resistance | The ability of a microorganism to resist the effects of an antimicrobial agent. |
| Anti-microbial | Destroying or inhibiting the growth of microorganisms. |
| Osmotic balance | It is a process of maintaining salt and water balance across membranes within the body's fluids. |
| Bacteriocin | Bacteriocins are the toxins produced by bacteria to inhibit the growth of similar or closely related bacterial strains. |
| Biohydrogenation | It is a process that occurs in the rumen of an animal in which bacteria convert unsaturated fatty acids (USFA) to saturated fatty acids (SFA). |
| Oxidative rancidity | It is a reaction of fatty acids with oxygen, which generally causes unpleasant odors in animals. To prevent these, antioxidants were added. |
| Mycotoxicosis | Any condition or disease caused by fungal toxins, mainly due to contamination of animal feed with mycotoxins. |
| Mycotoxins | Mycotoxins are toxin compounds that are naturally produced by certain types of molds (fungi). |
| Feed Probiotics | Microbial feed supplements positively affect gastrointestinal microbial balance. |
| Probiotic yeast | Feed yeast (single-cell fungi) and other fungi used as probiotics. |
| Feed enzymes | They are used to supplement digestive enzymes in an animal’s stomach to break down food. Enzymes also ensure that meat and egg production is improved. |
| Mycotoxin detoxifiers | They are used to prevent fungal growth and to stop any harmful mold from being absorbed in the gut and blood. |
| Feed antibiotics | They are used both for the prevention and treatment of diseases but also for rapid growth and development. |
| Feed antioxidants | They are used to protect the deterioration of other feed nutrients in the feed such as fats, vitamins, pigments, and flavoring agents, thus providing nutrient security to the animals. |
| Feed phytogenics | Phytogenics are natural substances, added to livestock feed to promote growth, aid in digestion, and act as anti-microbial agents. |
| Feed vitamins | They are used to maintain the normal physiological function and normal growth and development of animals. |
| Feed flavors and sweetners | These flavors and sweeteners help to mask tastes and odors during changes in additives or medications and make them ideal for animal diets undergoing transition. |
| Feed acidifiers | Animal feed acidifiers are organic acids incorporated into the feed for nutritional or preservative purposes. Acidifiers enhance congestion and microbiological balance in the alimentary and digestive tracts of livestock. |
| Feed minerals | Feed minerals play an important role in the regular dietary requirements of animal feed. |
| Feed binders | Feed binders are the binding agents used in the manufacture of safe animal feed products. It enhances the taste of food and prolongs the storage period of the feed. |
| Key Terms | Abbreviation |
| LSDV | Lumpy Skin Disease Virus |
| ASF | African Swine Fever |
| GPA | Growth Promoter Antibiotics |
| NSP | Non-Starch Polysaccharides |
| PUFA | Polyunsaturated Fatty Acid |
| Afs | Aflatoxins |
| AGP | Antibiotic Growth Promoters |
| FAO | The Food And Agriculture Organization of the United Nations |
| USDA | The United States Department of Agriculture |


Research Methodology
Mordor Intelligence follows a four-step methodology in all our reports.
- Step-1: IDENTIFY KEY VARIABLES: In order to build a robust forecasting methodology, the variables and factors identified in Step-1 are tested against available historical market numbers. Through an iterative process, the variables required for market forecast are set and the model is built on the basis of these variables.
- Step-2: Build a Market Model: Market-size estimations for the forecast years are in nominal terms. Inflation is not a part of the pricing, and the average selling price (ASP) is kept constant throughout the forecast period.
- Step-3: Validate and Finalize: In this important step, all market numbers, variables and analyst calls are validated through an extensive network of primary research experts from the market studied. The respondents are selected across levels and functions to generate a holistic picture of the market studied.
- Step-4: Research Outputs: Syndicated Reports, Custom Consulting Assignments, Databases & Subscription Platforms


