Middle East Feed Amino Acids Market Size and Share
Market Overview
| Study Period | 2018 - 2031 |
|---|---|
| Forecast Data Period | 2026 - 2031 |
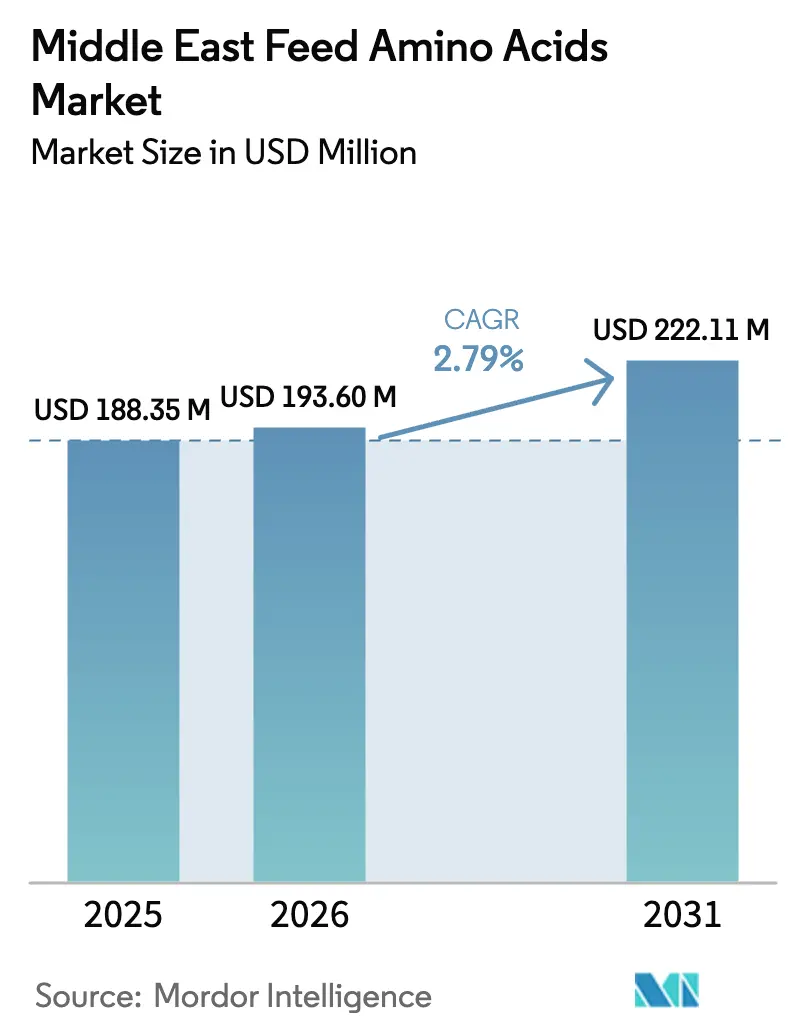
| Base Year Market Size (2025) | USD 188.35 Million |
| Market Size (2026) | USD 193.6 Million |
| Market Size (2031) | USD 222.11 Million |
| Growth Rate (2026 - 2031) | 2.79% CAGR |
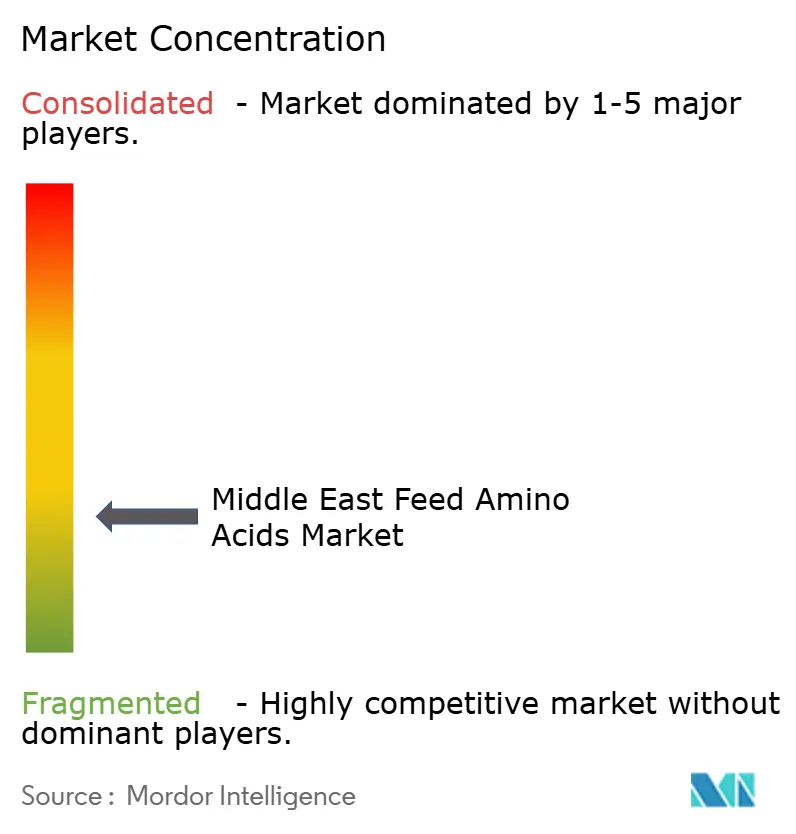
| Market Concentration | Low |
Major Players
*Disclaimer: Major Players sorted in no particular order Image © Mordor Intelligence. Reuse requires attribution under CC BY 4.0. |
|
Middle East Feed Amino Acids Market Analysis by Mordor Intelligence
Middle East feed amino acids market size in 2026 is estimated at USD 193.6 million, growing from 2025 value of USD 188.35 million with 2031 projections showing USD 222.11 million, growing at 2.79% CAGR over 2026-2031. Steady growth is stemming from large-scale livestock self-sufficiency programs, desalination-brine valorization initiatives, and early-stage precision-fermentation clusters that can localize amino acid supply. Industrial poultry integrators are upgrading feed mills to low-crude-protein diets that rely on balanced amino acid profiles, while aquaculture ventures in Saudi Arabia target 600,000 metric tons of output that will further lift methionine offtake. Technology partnerships between Gulf investors and global biotechnology firms are reducing scope-3 emissions in the Middle East feed amino acids market, providing a template for carbon-efficient production. At the same time, evolving registration frameworks in Saudi Arabia and Iran ensure only high-purity additives reach compounders, supporting product premiums and long-term supplier relationships.
Key Report Takeaways
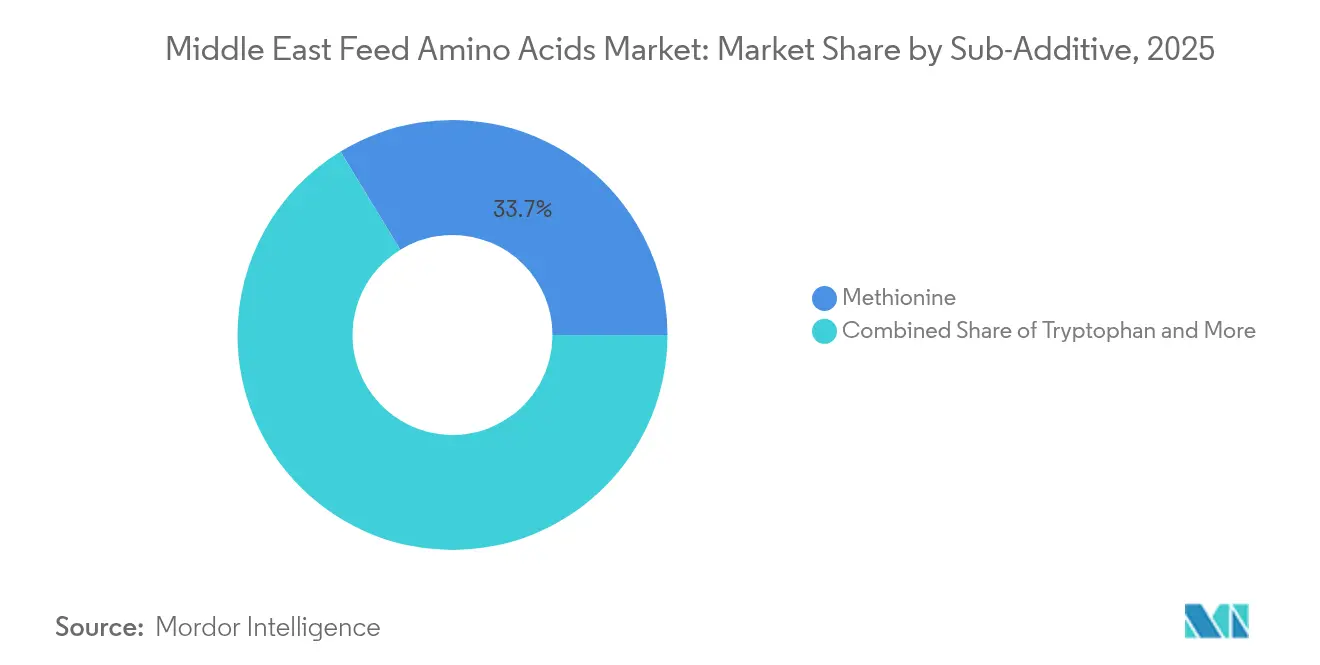
- By sub-additive, methionine held 33.72% of the Middle East feed amino acids market share in 2025, and is projected to expand at a 2.88% CAGR through 2031.
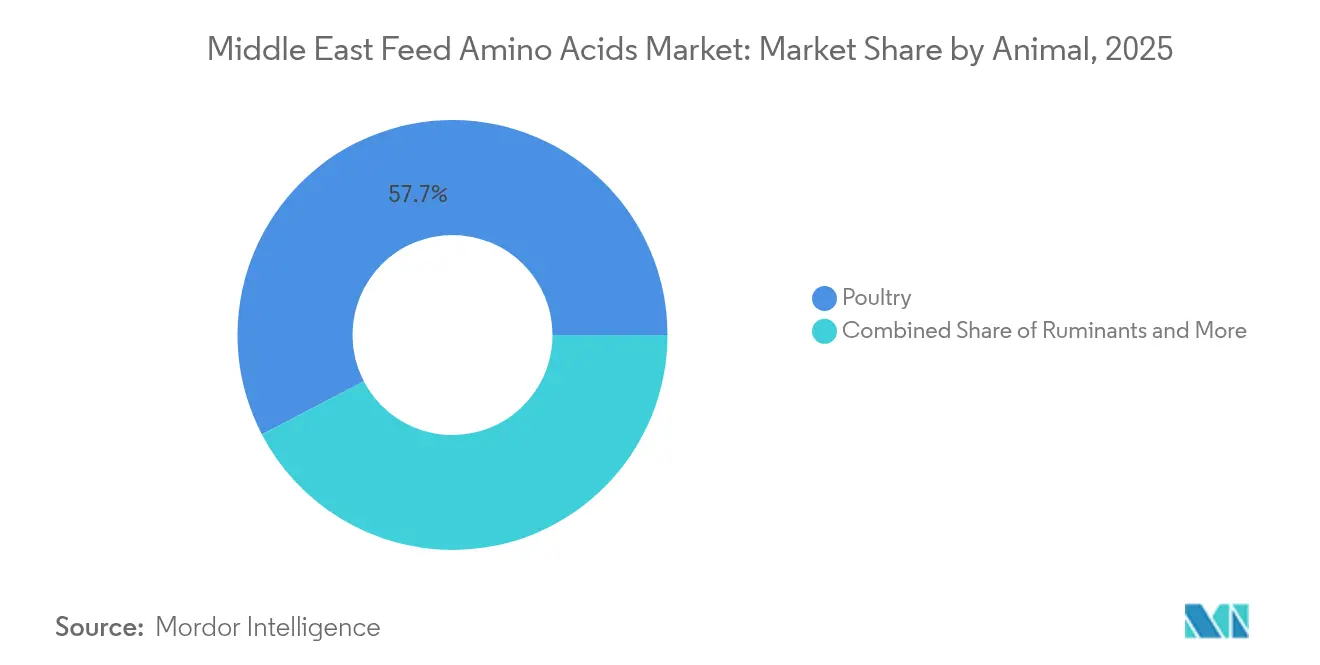
- By animal, poultry accounted for 57.65% of the Middle East feed amino acids market size in 2025, and aquaculture is advancing at a 2.81% CAGR to 2031.
- By country, Saudi Arabia commanded 35.28% revenue share in 2025; Iran records the fastest growth at 3.07% CAGR to 2031.
Note: Market size and forecast figures in this report are generated using Mordor Intelligence’s proprietary estimation framework, updated with the latest available data and insights as of 2026.
Middle East Feed Amino Acids Market Trends and Insights
Drivers Impact Analysis*
| Driver | (~) % Impact on CAGR Forecast | Geographic Relevance | Impact Timeline |
|---|---|---|---|
| Industrial poultry expansion in GCC | +0.4% | Saudi Arabia, UAE, and Kuwait | Medium term (2-4 years) |
| Rising per-capita meat consumption | +0.3% | Global, with a concentration in Saudi Arabia and Iran | Long term (≥ 4 years) |
| Government feed-mill self-sufficiency plans | +0.3% | Saudi Arabia and Iran | Medium term (2-4 years) |
| Desalination-brine methionine projects | +0.2% | Saudi Arabia and UAE | Long term (≥ 4 years) |
| Solar-powered precision fermentation clusters | +0.2% | NEOM and Saudi Arabia | Long term (≥ 4 years) |
| Non-antibiotic dairy ration regulations | +0.2% | GCC countries | Short term (≤ 2 years) |
| Source: Mordor Intelligence | |||
Industrial poultry expansion in GCC
Saudi Arabian integrators now run a compound-feed capacity of 8 million metric tons within a 22 million metric tons regional market, elevating amino acid inclusion rates to optimize feed-conversion ratios in water-scarce environments[1]Source: Oirere, Shem. "Cargill, ARASCO, NEOM join forces to expand Saudi Arabia's aquaculture capacity" arasco.com. Cross-border investment is funneling into new broiler complexes that demand premixes containing methionine, lysine, and threonine for rapid weight gain. Regulatory audits by the Saudi Food and Drug Authority have tightened purity thresholds, giving global suppliers with validated quality systems greater access. Larger contract volumes are moderating price volatility for stakeholders in the Middle East feed amino acids market while creating scale economies that spur local premix blending. Rising cold-chain penetration across the Gulf bolsters retail poultry demand, reinforcing a structural uptick in additive requirements.
Rising per-capita meat consumption
Urbanization and disposable-income growth are lifting meat intake in Riyadh, Jeddah, and Tehran, driving steady downstream demand for nutrient-dense feeds. Each 1 kg rise in per-capita chicken consumption raises synthetic amino acid volumes exponentially as feed mills reformulate to maintain nitrogen balance. Iranian policy dialogues with Turkey streamline technology transfer that allows domestic integrators to match Gulf feed-efficiency benchmarks. The shift toward higher-quality cuts intensifies nutrient density expectations, amplifying opportunities for specialty amino acids such as tryptophan that improve carcass traits. Consumers increasingly value provenance and halal certification, supporting fermentation-based solutions that align with ethical-sourcing mandates.
Government feed-mill self-sufficiency plans
Vision 2030 initiatives earmark multi-billion-dollar budgets for domestic feed hubs, triggering long-term offtake agreements that underpin regional amino acid plants. Iran’s Ministry of Health and Medical Education (MOHME) and ISIRI coordinate additive rules that offer transparent entry pathways for compliant suppliers. Joint-venture models such as Danish Unibio’s natural-gas-to-protein project illustrate how petrochemical resources can be monetized into feed-grade proteins and amino acids, compressing logistical costs. Sovereign procurement guarantees stabilize cash flows, catalyzing precision-fermentation build-outs that insulate the Middle East feed amino acids market from external shocks. These national plans also carry employment targets that encourage workforce upskilling in nutrition science.
Desalination-brine methionine projects
The Gulf generates millions of cubic meters of hypersaline waste daily, and biotechnology consortia are converting this brine into cost-competitive L-methionine through microbial pathways at 0.79 kg CO₂-eq per kg, far below petrochemical benchmarks. Circular-economy economics align with water-scarcity imperatives, allowing desalination operators to diversify revenue. Pilot units inside NEOM provide field-scale validation, and once commercial, these plants could supply nearly one-third of regional methionine needs. As process intellectual property matures, forward contracts are emerging between brine-conversion startups and integrated feed producers, providing predictable volumes to the Middle East feed amino acids market. Environmental regulators favor the closed-loop solution, likely accelerating permit approvals.
Restraints Impact Analysis*
| Restraint | (~) % Impact on CAGR Forecast | Geographic Relevance | Impact Timeline |
|---|---|---|---|
| Raw-material import price volatility | -0.2% | Global, affecting all Middle East markets | Short term (≤ 2 years) |
| Geopolitical trade route disruptions | -0.2% | Red Sea, Suez Canal, and Persian Gulf | Short term (≤ 2 years) |
| Lengthy additive registration timelines | -0.1% | Saudi Arabia and Iran | Medium term (2-4 years) |
| Shortage of skilled animal nutritionists | -0.1% | Regional, particularly Iran and the smaller GCC states | Long term (≥ 4 years) |
| Source: Mordor Intelligence | |||
Raw-material import price volatility
Heavy reliance on Asian amino acid intermediates exposes feed formulators to swings driven by corn, sugar, and energy markets. Chinese oversupply lowered spot lysine prices in 2024, but freight spikes erased a portion of the savings, complicating contract hedges[2]Source: Maud Roeters, “dsm-firmenich reports H1 2024 results,” DSM-Firmenich, dsm-firmenich.com. Currency depreciation in Iran further amplifies cost uncertainty, forcing mills to shorten procurement horizons. Some buyers stockpile up to three months of inventory, tying up working capital and depressing near-term demand in the Middle East feed amino acids market. Bank financing rates linked to U.S. dollar benchmarks add an extra layer of expense.
Geopolitical trade route disruptions
Strategic waterways handle more than 80% of inbound amino acids, and episodic security incidents trigger abrupt insurance surcharges. Re-routing cargo south of the Cape of Good Hope extends transit times by two weeks, inducing production halts at just-in-time feed plants. Land corridors through Iraq and Jordan help, but face customs bottlenecks that lengthen clearance cycles. Importers are experimenting with rail-freight pilots via the International North-South Transport Corridor (INSTC), although volumes remain marginal. Supply-chain fragility underscores the strategic rationale for indigenous production, accelerating investment in the Middle East feed amino acids market.
*Our forecasts treat driver/restraint impacts as directional, not additive. The impact forecasts reflect baseline growth, mix effects, and variable interactions.
Segment Analysis
By Sub-Additive: Methionine Dominance Drives Aquaculture Transition
Methionine captured 33.72% of Middle East feed amino acids market share in 2025, reflecting its indispensability for fishmeal-free diets and broiler growth efficiency. The segment’s 2.88% rise to 2031 aligns with Saudi aquaculture expansion plans for seafood output. Precision‐fermentation routes are helping localize supply, cutting emissions, and import reliance. Lysine ranks second thanks to universal inclusion in poultry formulas, while threonine and tryptophan grow as formulators optimize low-protein diets to meet environmental rules.
Emerging feed concepts incorporate valine, isoleucine, and histidine to fine-tune amino acid balance, broadening the segment mix inside the Middle East feed amino acids market. Halal compliance encourages fermentation-based purity, giving biotechnology producers a reputational edge. Life-cycle data indicating 65% lower carbon intensity for L-methionine resonates with retailers seeking greener meat labels. Forward-pricing contracts between fermentation startups and feed majors lock in offtake, underpinning capex pipelines that can lift regional self-sufficiency to 40% by decade-end.


By Animal: Poultry Sector Leads Intensive Production Scaling
Poultry contributed 57.65% of the Middle East feed amino acids market size in 2025 as vertically integrated broiler chains expand housing density and switch to precision diets. Each 1% drop in crude protein aided by extra amino acids can cut nitrogen excretion by 10.4%, aligning with environmental limits. Aquaculture is advancing at a 2.81% CAGR during the forecast period. Aquaculture logs the quickest gains due to ambitious national seafood targets, requiring methionine-rich, fishmeal-light rations. Dairy herds increasingly dose rumen-protected amino acids to curb heat stress, widening application breadth.
Ruminants will steadily adopt encapsulated methionine and lysine because milk payout schemes reward protein percentages, encouraging nutrient-dense formulations. Swine remains niche but persists in non-Muslim markets, keeping baseline lysine demand alive. Specialty livestock such as camels and goats open micro-segments where custom amino acid profiles improve reproductive performance and growth rates. Collectively, these dynamics reinforce volume resilience for the Middle East feed amino acids market through commodity cycles.
Geography Analysis
Saudi Arabia held 35.28% market share in 2025, supported by robust feed infrastructure, transparent regulation, and capital access under Vision 2030. The kingdom’s tie-ups with Danish Unibio and Liberation Labs anchor domestic production ambitions and bolster the local value chain. Iran, at 3.07% CAGR, stands out for growth as it scales feed output through Turkey partnerships and incentives for provincial mills. Unified additive oversight across MOHME, ISIRI, and IVO ensures consistent quality checkpoints, attracting multinational entrants.
The rest of Middle East markets, notably the UAE and Kuwait, import bulk volumes via Jebel Ali and leverage free-zone warehouses to re-export across the region. Their sovereign wealth funds support aquaculture and dairy mega-farms that create incremental amino acid demand. Harmonized GCC standards underway could simplify cross-border trade, reinforcing the Middle East feed amino acids market’s regional integration and reducing redundancy in testing protocols.
Iran’s livestock roadmap prescribes compound-feed conversion targets that double annual output capacity within five years. Import substitution policies grant tax holidays to amino acid joint ventures, and rail links to Central Asia may unlock future export corridors. Currency volatility and banking sanctions occasionally impede raw-material procurement, prompting local developers to pursue fermentation feedstocks from beet molasses and corn steep liquor to hedge exposure.
Competitive Landscape
The Middle East feed amino acids market exhibits a fragmented structure with a mix of global manufacturers and regional players. CJ CheilJedang’s planned USD 4.3 billion divestment of its bio business could reshape global supply alignments and open space for new entrants[3]Source: Jun-Ho Cha, “CJ CheilJedang puts bio business on market for $4 bn,” KED Global, kedglobal.com. DSM-Firmenich countered price pressure by unveiling a regional manufacturing plant in Egypt that lowers freight and customs burdens for Gulf deliveries, reinforcing service proximity.
Chinese producers maintain cost leadership but face anti-dumping vigilance, nudging them toward local warehousing partnerships. Regional players such as ARASCO secure captive demand through integrated feed-mill capacity and joint research with Cargill, bolstering bargaining leverage. Environmental credentials are becoming decisive; suppliers armed with third-party verified life-cycle assessments and halal certification gain shelf-space advantage at mill purchasing desks.
Innovation race centers on fermentation substrates sourced from desalination brine or natural gas. Startups targeting on-site methionine generation via modular bioreactors could disrupt shipment-based procurement models. Established firms respond by bundling technical services, formulation software, and heat-stress advisory, locking customers into multi-year amino acid supply contracts and shoring up stickiness in the Middle East feed amino acids market.
Middle East Feed Amino Acids Industry Leaders
-
Adisseo
-
Alltech, Inc.
-
Archer Daniel Midland Co.
-
Evonik Industries AG
-
IFF(Danisco Animal Nutrition)
- *Disclaimer: Major Players sorted in no particular order

Recent Industry Developments
- April 2025: NEOM Investment Fund partnered with Liberation Labs to construct a precision-fermentation hub aimed at low-carbon amino acid production.
- December 2024: CJ CheilJedang shortlisted Blackstone and Carlyle to submit binding bids for its USD 4.3 billion bio division, whose portfolio spans lysine, tryptophan, and valine plants across 11 countries.
- September 2024: DSM-Firmenich inaugurated a nutrition ingredients factory in Sadat City, Egypt, expanding amino acid and vitamin availability for Middle East buyers.


Middle East Feed Amino Acids Market Report Scope
Lysine, Methionine, Threonine, Tryptophan are covered as segments by Sub Additive. Aquaculture, Poultry, Ruminants, Swine are covered as segments by Animal. Iran, Saudi Arabia are covered as segments by Country.| Lysine |
| Methionine |
| Threonine |
| Tryptophan |
| Other Amino Acids |
| Aquaculture | Fish |
| Shrimp | |
| Other Aquaculture Species | |
| Poultry | Broiler |
| Layer | |
| Other Poultry Birds | |
| Ruminants | Beef Cattle |
| Dairy Cattle | |
| Other Ruminants | |
| Swine | |
| Other Animals |
| Iran |
| Saudi Arabia |
| Rest of Middle East |
| Sub Additive | Lysine | |
| Methionine | ||
| Threonine | ||
| Tryptophan | ||
| Other Amino Acids | ||
| Animal | Aquaculture | Fish |
| Shrimp | ||
| Other Aquaculture Species | ||
| Poultry | Broiler | |
| Layer | ||
| Other Poultry Birds | ||
| Ruminants | Beef Cattle | |
| Dairy Cattle | ||
| Other Ruminants | ||
| Swine | ||
| Other Animals | ||
| Country | Iran | |
| Saudi Arabia | ||
| Rest of Middle East | ||


Market Definition
- FUNCTIONS - For the study, feed additives are considered to be commercially manufactured products that are used to enhance characteristics such as weight gain, feed conversion ratio, and feed intake when fed in appropriate proportions.
- RESELLERS - Companies engaged in reselling feed additives without value addition have been excluded from the market scope, to avoid double counting.
- END CONSUMERS - Compound feed manufacturers are considered to be end-consumers in the market studied. The scope excludes farmers buying feed additives to be used directly as supplements or premixes.
- INTERNAL COMPANY CONSUMPTION - Companies engaged in the production of compound feed as well as the manufacturing of feed additives are part of the study. However, while estimating the market sizes, the internal consumption of feed additives by such companies has been excluded.
| Keyword | Definition |
|---|---|
| Feed additives | Feed additives are products used in animal nutrition for purposes of improving the quality of feed and the quality of food from animal origin, or to improve the animals’ performance and health. |
| Probiotics | Probiotics are microorganisms introduced into the body for their beneficial qualities. (It maintains or restores beneficial bacteria to the gut). |
| Antibiotics | Antibiotic is a drug that is specifically used to inhibit the growth of bacteria. |
| Prebiotics | A non-digestible food ingredient that promotes the growth of beneficial microorganisms in the intestines. |
| Antioxidants | Antioxidants are compounds that inhibit oxidation, a chemical reaction that produces free radicals. |
| Phytogenics | Phytogenics are a group of natural and non-antibiotic growth promoters derived from herbs, spices, essential oils, and oleoresins. |
| Vitamins | Vitamins are organic compounds, which are required for normal growth and maintenance of the body. |
| Metabolism | A chemical process that occurs within a living organism in order to maintain life. |
| Amino acids | Amino acids are the building blocks of proteins and play an important role in metabolic pathways. |
| Enzymes | Enzyme is a substance that acts as a catalyst to bring about a specific biochemical reaction. |
| Anti-microbial resistance | The ability of a microorganism to resist the effects of an antimicrobial agent. |
| Anti-microbial | Destroying or inhibiting the growth of microorganisms. |
| Osmotic balance | It is a process of maintaining salt and water balance across membranes within the body's fluids. |
| Bacteriocin | Bacteriocins are the toxins produced by bacteria to inhibit the growth of similar or closely related bacterial strains. |
| Biohydrogenation | It is a process that occurs in the rumen of an animal in which bacteria convert unsaturated fatty acids (USFA) to saturated fatty acids (SFA). |
| Oxidative rancidity | It is a reaction of fatty acids with oxygen, which generally causes unpleasant odors in animals. To prevent these, antioxidants were added. |
| Mycotoxicosis | Any condition or disease caused by fungal toxins, mainly due to contamination of animal feed with mycotoxins. |
| Mycotoxins | Mycotoxins are toxin compounds that are naturally produced by certain types of molds (fungi). |
| Feed Probiotics | Microbial feed supplements positively affect gastrointestinal microbial balance. |
| Probiotic yeast | Feed yeast (single-cell fungi) and other fungi used as probiotics. |
| Feed enzymes | They are used to supplement digestive enzymes in an animal’s stomach to break down food. Enzymes also ensure that meat and egg production is improved. |
| Mycotoxin detoxifiers | They are used to prevent fungal growth and to stop any harmful mold from being absorbed in the gut and blood. |
| Feed antibiotics | They are used both for the prevention and treatment of diseases but also for rapid growth and development. |
| Feed antioxidants | They are used to protect the deterioration of other feed nutrients in the feed such as fats, vitamins, pigments, and flavoring agents, thus providing nutrient security to the animals. |
| Feed phytogenics | Phytogenics are natural substances, added to livestock feed to promote growth, aid in digestion, and act as anti-microbial agents. |
| Feed vitamins | They are used to maintain the normal physiological function and normal growth and development of animals. |
| Feed flavors and sweetners | These flavors and sweeteners help to mask tastes and odors during changes in additives or medications and make them ideal for animal diets undergoing transition. |
| Feed acidifiers | Animal feed acidifiers are organic acids incorporated into the feed for nutritional or preservative purposes. Acidifiers enhance congestion and microbiological balance in the alimentary and digestive tracts of livestock. |
| Feed minerals | Feed minerals play an important role in the regular dietary requirements of animal feed. |
| Feed binders | Feed binders are the binding agents used in the manufacture of safe animal feed products. It enhances the taste of food and prolongs the storage period of the feed. |
| Key Terms | Abbreviation |
| LSDV | Lumpy Skin Disease Virus |
| ASF | African Swine Fever |
| GPA | Growth Promoter Antibiotics |
| NSP | Non-Starch Polysaccharides |
| PUFA | Polyunsaturated Fatty Acid |
| Afs | Aflatoxins |
| AGP | Antibiotic Growth Promoters |
| FAO | The Food And Agriculture Organization of the United Nations |
| USDA | The United States Department of Agriculture |


Research Methodology
Mordor Intelligence follows a four-step methodology in all our reports.
- Step-1: IDENTIFY KEY VARIABLES: In order to build a robust forecasting methodology, the variables and factors identified in Step-1 are tested against available historical market numbers. Through an iterative process, the variables required for market forecast are set and the model is built on the basis of these variables.
- Step-2: Build a Market Model: Market-size estimations for the forecast years are in nominal terms. Inflation is not a part of the pricing, and the average selling price (ASP) is kept constant throughout the forecast period.
- Step-3: Validate and Finalize: In this important step, all market numbers, variables and analyst calls are validated through an extensive network of primary research experts from the market studied. The respondents are selected across levels and functions to generate a holistic picture of the market studied.
- Step-4: Research Outputs: Syndicated Reports, Custom Consulting Assignments, Databases & Subscription Platforms


