China Feed Amino Acids Market Size and Share
Market Overview
| Study Period | 2020 - 2030 |
|---|---|
| Forecast Data Period | 2025 - 2030 |
| Historical Data Period | 2020 - 2023 |
| Market Size (2025) | USD 0.84 Billion |
| Market Size (2030) | USD 1.07 Billion |
| Growth Rate (2025 - 2030) | 5.00% CAGR |
| Market Concentration | Medium |
Major Players*Disclaimer: Major Players sorted in no particular order Image © Mordor Intelligence. Reuse requires attribution under CC BY 4.0. | |

China Feed Amino Acids Market Analysis by Mordor Intelligence
The China feed amino acids market size reached USD 0.84 billion in 2025 and is projected to increase to USD 1.07 billion by 2030, reflecting a 5.0% CAGR during the forecast period. The capacity now exceeds 4.89 million metric tons per year, making China the primary global supply hub for feed amino acids. Precision nutrition programs, antibiotic-free mandates, and the soybean meal reduction policy collectively elevate demand for crystalline amino acids. Export-driven overcapacity keeps domestic prices competitive, while environmental compliance costs intensify pressure on smaller producers. Integrated livestock groups are pioneering liquid delivery systems, reinforcing product differentiation, and supporting broader adoption of amino acid balancing technologies across the China feed amino acids market.
Key Report Takeaways
- By sub-additive, lysine led the China feed amino acids market with a 42.2% revenue share in 2024; tryptophan is projected to record the fastest growth, at a 5.0% CAGR, through 2030.
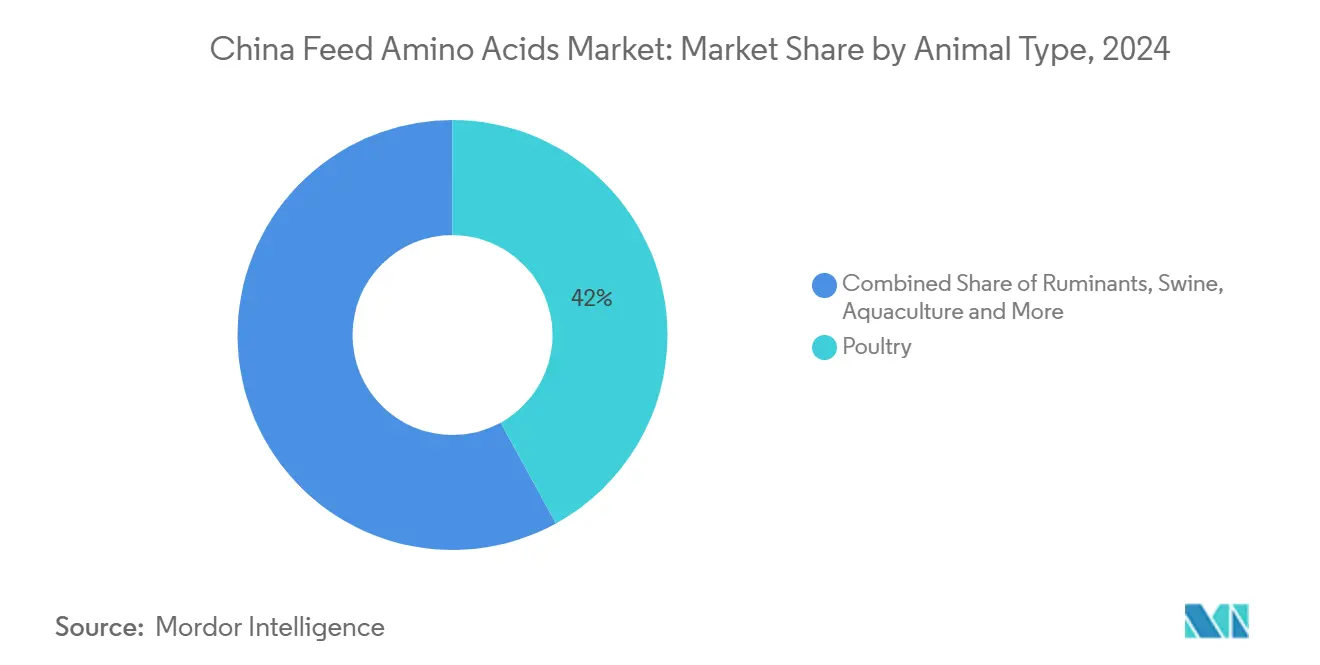
- By animal, poultry accounted for a 51.2% share of the China feed amino acids market in 2024, and aquaculture is on course for a 5.6% CAGR during the same period.
China Feed Amino Acids Market Trends and Insights
Drivers Impact Analysis*
| Driver | (~) % Impact on CAGR Forecast | Geographic Relevance | Impact Timeline |
|---|---|---|---|
| Rising meat consumption and livestock expansion | +1.2% | Shandong, Henan, Sichuan | Medium term (2–4 years) |
| Antibiotic-free feed regulations | +0.9% | Nationwide, large integrators first | Short term (≤ 2 years) |
| Growth of large, integrated livestock farms | +0.8% | Nationwide, coastal provinces lead | Long term (≥ 4 years) |
| Soybean-meal-reduction boosts crystalline amino acids use | +1.1% | Major feed regions nationwide | Medium term (2–4 years) |
| Insect-protein adoption alters amino acids balancing | +0.3% | Guangdong, Jiangsu pilots | Long term (≥ 4 years) |
| Export-driven scale lowers domestic amino acids prices | +0.7% | Shandong, Jilin, Inner Mongolia | Short term (≤ 2 years) |
| Source: Mordor Intelligence | |||
Rising Meat Consumption and Livestock Expansion
Per-capita meat intake climbed to 61.8 kg in 2024 as urbanization and disposable income drove sustained pork and poultry demand. Integrated operations responded by scaling precision amino acid programs that consistently trimmed feed conversion ratios by up to 4% while lowering nitrogen excretion[1]Source: National Bureau of Statistics of China, “China Meat Consumption 2024,” stats.gov.cn . Higher-value clean-label and organic meats rely on balanced crystalline profiles to offset the removal of antibiotic promoters and maintain carcass yields. Demand clusters in Shandong and Henan shorten delivery routes, enabling same-day deliveries that fortify supply reliability for regional feed mills. As the population ages, protein consumption is forecast to stabilize at elevated levels rather than decline, securing a durable volume base for the China feed amino acids market.
Antibiotic-Free Feed Regulations
The nationwide ban on antibiotic growth promoters, fully enforced by late 2024, forced every commercial mill to reformulate diets within a compressed time frame[2]Source: Ministry of Agriculture and Rural Affairs, “Feed Industry Statistical Bulletin 2024,” marachina.gov.cn. Crystalline lysine, threonine and especially tryptophan replaced crude protein to stabilize gut flora, which reduced post-wean diarrhea cases by up to 18% in trial herds. Early adopter integrators leveraged liquid amino acid systems that deliver sub-gram accuracy, cutting formulation errors and shrinkage losses. Ongoing residue testing maintains demand discipline; non-compliant batches risk recall and license suspension. Continuous technical seminars hosted by provincial feed associations ensure that even mid-tier producers master low-antibiotic formulation techniques, widening the addressable market for amino acid suppliers.
Growth of Large, Integrated Livestock Farms
Consolidation accelerated after environmental tax reforms raised the minimum efficient scale for new barns. Modern complexes equipped with real-time sensor feeds achieve 15-20% better feed conversion ratios than legacy farms and share performance data with nutrition partners to refine daily amino acid matrices. Many operators shifted to bulk liquid lysine and threonine tanks that reduce labor costs by 30% versus bagged powders while minimizing dust emissions[3]Source: National Development and Reform Commission, “Corn Price Monitoring Report December 2024,” ndrc.gov.cn . Such partnerships embed suppliers at the design stage of new facilities, creating multi-year supply commitments that lock in offtake. Smaller contract growers are gradually absorbed or transformed into satellite units that follow integrator feed regimes, further concentrating purchasing power.
Soybean-Meal-Reduction Boosts Crystalline Amino Acids Use
Targets to push soybean meal inclusion below 13% by 2025 originated from food-security objectives to curb reliance on imported soy. Feed trials showed that supplementing an additional 0.1% lysine and 0.05% threonine preserved weight gain while dropping dietary crude protein by 1.5 percentage points. Nitrogen output at finishing farms fell 10-12%, enabling operators to meet stricter manure-management rules. The central government funds pilot demonstrations across 70 feed mills, reimbursing formulation software upgrades that automate amino acid balancing. Meeting the 2025 deadline all but guarantees incremental tonnage for crystalline products during the forecast period.
Restraints Impact Analysis*
| Restraint | (~) % Impact on CAGR Forecast | Geographic Relevance | Impact Timeline |
|---|---|---|---|
| Volatile corn and sugar prices inflate costs | -0.8% | National production hubs | Short term (≤ 2 years) |
| Supplier oligopoly creates price swings | -0.6% | Global linkages to domestic prices | Medium term (2–4 years) |
| Stricter effluent and VOC rules raise compliance cost | -0.4% | Industrial clusters, eco-zones | Long term (≥ 4 years) |
| Alt-protein shift caps livestock feed demand | -0.2% | Tier-1 and tier-2 cities | Long term (≥ 4 years) |
| Source: Mordor Intelligence | |||
Volatile Corn and Sugar Prices Inflate Costs
Corn averaged CNY 2,059 per metric ton (USD 308.9 per metric ton) in December 2024 and swung 14% between seasonal highs and lows. Sugar and molasses followed similar patterns as weather-driven shortages in Brazil tightened global supply. Since substrates account for up to 70% of fermentation expenses, every 50 yuan spike trims gross margin by nearly 1.2 percentage points for mid-scale plants. Long-dated supply contracts cushion part of the shock yet limit upside when prices retreat. Futures hedging is gaining traction, although liquidity remains thin for many mills, keeping cost volatility a persistent headwind.
Supplier Oligopoly Creates Price Swings
Three global giants, such as Evonik, Adisseo, and Novus, control about 60% of worldwide methionine capacity. Their synchronized January 2025 increases lifted landed costs in China by 5-7%, igniting downstream rationing as millers deferred purchases. Domestic oligopolies exist in minor acids like valine, where top producers can throttle output to maintain margins. Short-notice plant turnarounds or port congestion adds further noise, prompting feed formulators to expand safety stocks despite working-capital drag. Until new entrants or process innovations dilute concentration, users will contend with recurrent price oscillations.
*Our forecasts treat driver/restraint impacts as directional, not additive. The impact forecasts reflect baseline growth, mix effects, and variable interactions.
Segment Analysis
By Sub Additive: Lysine Dominance Faces Tryptophan Challenge
Lysine secured 42.2% of China's feed amino acids market share in 2024, supported by domestic capacity exceeding 2 million metric tons. High-volume manufacturing creates pricing advantages that propel widespread usage across corn-soy diets. The China feed amino acids market size for lysine is forecast to expand steadily on the back of ongoing protein-reduction strategies.
Tryptophan posted a robust 5.0% CAGR outlook to 2030 as its serotonin pathway benefits stress mitigation in antibiotic-free systems. Expanded fermentation yields and tech transfer from leading enzyme developers lower unit costs, reinforcing uptake. Methionine remains supply-constrained due to import reliance; nonetheless, upcoming local projects aim to ease availability. Fermentation breakthroughs in threonine and valine production position domestic firms to extend leadership, further stabilizing component diversity inside the China feed amino acids market.
Synergistic inclusion of threonine with lysine underpins protein efficiency improvements that offset rising grain prices. Emerging specialty amino acids with immune-modulating attributes gain attention, though present volumes are small. Regulatory streamlining for established additives quickens market entry, while new molecules face rigorous evaluation, maintaining quality assurance across the China feed amino acids market.


By Animal: Poultry Leadership with Aquaculture Acceleration
Poultry dominated consumption with a 51.2% share in 2024 due to China’s 23 million metric tons of chicken meat output. Short grow-out cycles facilitate rapid formulation refinement, embedding crystalline amino acids at optimal levels. The China feed amino acids market size for poultry formulations is projected to remain buoyant as integrated broiler giants upgrade liquid dosing infrastructure.
Aquaculture registers the quickest 5.6% CAGR, propelled by coastal intensification and species diversification. Waterborne systems require precise nutrient ratios to curb environmental discharge, elevating amino acid inclusion. Swine rebounded following African swine fever with modernized barns that favor low-protein regimes. Ruminant demand holds steady, driven by rumen-protected technologies. Specialty segments such as pet nutrition expand alongside premiumization, creating incremental growth pockets in the China feed amino acids market.
Geography Analysis
China owns more than 30% of global amino acid production and consumption, underpinning undisputed leadership in the China feed amino acids market. Shandong alone hosts about 40% of national capacity, leveraging corn belt proximity to secure substrate supply. Concentrated industry clusters foster shared utilities and skilled labor pools, further lowering unit costs and reinforcing export competitiveness.
Consumption mirrors livestock distribution, with Shandong, Henan, Sichuan, and Guangdong absorbing over 60% of amino acids in 2024. Coastal hubs exhibit faster adoption of precision feeding tools, aided by widespread technical service networks. Rural revitalization programs encourage livestock investment in central and western regions, progressively diffusing demand and reducing geographic concentration risks in the China feed amino acids market.
Trade surplus exceeds USD 2 billion on sizable exports to Southeast Asia, Europe and Latin America. Tariff shocks, such as the EU’s 98% duty, redirect shipments internally, boosting domestic availability yet compressing margins. The Belt and Road Initiative opens new corridors into Central Asia and Africa, though volumes remain modest relative to traditional markets. Export policy monitoring remains pivotal for supply-demand balancing in the China feed amino acids market.
Competitive Landscape
The top five manufacturers capture the majority of revenue, signifying moderate concentration and room for consolidation. Multinationals and domestic champions invest in process optimization, synthetic biology, and digital fermentation to sustain cost leadership. Environmental compliance accelerates market exits among sub-scale players, gradually lifting average capacity per site in the Chinese feed amino acids market.
Vertical integration strategies align amino acid supply with feed milling and live-animal assets, assuring offtake and facilitating customized nutrition services. Evonik’s partnership with Vland Biotech demonstrates the value of combining global technology with local reach. Specialty amino acid niches and organic-certified products present untapped whitespace for differentiated growth.
Patent intensity climbs as firms safeguard innovations in strain engineering, continuous fermentation, and micro-filtration. Intellectual property enforcement is strengthening, evidenced by recent favorable rulings for multinational patentees. The competitive arena increasingly rewards technical collaboration and customer-centric service models in the Chinese feed amino acids market.
China Feed Amino Acids Industry Leaders
Adisseo
Alltech, Inc.
Evonik Industries AG
IFF(Danisco Animal Nutrition)
SHV (Nutreco NV)
- *Disclaimer: Major Players sorted in no particular order


Recent Industry Developments
- January 2025: Meihua Holdings suspended 100,000 metric tons 98% lysine capacity to pivot toward higher-value amino acids, signaling an agile response to EU anti-dumping measures.
- January 2025: Coordinated price hikes saw Adisseo lift liquid methionine by 5%, New Hope Liuhe raise solid methionine by 15% and Evonik adjust prices by 7%, aiming to offset raw-material inflation.
- December 2024: The European Union enforced a 98% anti-dumping tariff on Chinese lysine, curbing 200,000 tonnes of exports and prompting capacity redeployment.
- October 2024: Adisseo unveiled plans for a 150,000 metric tons solid methionine facility in Quanzhou, slated for 2027, aimed at reinforcing global leadership.


China Feed Amino Acids Market Report Scope
Lysine, Methionine, Threonine, Tryptophan are covered as segments by Sub Additive. Aquaculture, Poultry, Ruminants, Swine are covered as segments by Animal.| Lysine |
| Tryptophan |
| Methionine |
| Threonine |
| Other Amino Acids |
| Aquaculture | By Sub Animal | Fish |
| Shrimp | ||
| Other Aquaculture Species | ||
| Poultry | By Sub Animal | Broiler |
| Layer | ||
| Other Poultry Birds | ||
| Ruminants | By Sub Animal | Beef Cattle |
| Dairy Cattle | ||
| Other Ruminants | ||
| Swine | ||
| Other Animals |
| By Sub-Additive | Lysine | ||
| Tryptophan | |||
| Methionine | |||
| Threonine | |||
| Other Amino Acids | |||
| By Animal | Aquaculture | By Sub Animal | Fish |
| Shrimp | |||
| Other Aquaculture Species | |||
| Poultry | By Sub Animal | Broiler | |
| Layer | |||
| Other Poultry Birds | |||
| Ruminants | By Sub Animal | Beef Cattle | |
| Dairy Cattle | |||
| Other Ruminants | |||
| Swine | |||
| Other Animals | |||


Market Definition
- FUNCTIONS - For the study, feed additives are considered to be commercially manufactured products that are used to enhance characteristics such as weight gain, feed conversion ratio, and feed intake when fed in appropriate proportions.
- RESELLERS - Companies engaged in reselling feed additives without value addition have been excluded from the market scope, to avoid double counting.
- END CONSUMERS - Compound feed manufacturers are considered to be end-consumers in the market studied. The scope excludes farmers buying feed additives to be used directly as supplements or premixes.
- INTERNAL COMPANY CONSUMPTION - Companies engaged in the production of compound feed as well as the manufacturing of feed additives are part of the study. However, while estimating the market sizes, the internal consumption of feed additives by such companies has been excluded.
| Keyword | Definition |
|---|---|
| Feed additives | Feed additives are products used in animal nutrition for purposes of improving the quality of feed and the quality of food from animal origin, or to improve the animals’ performance and health. |
| Probiotics | Probiotics are microorganisms introduced into the body for their beneficial qualities. (It maintains or restores beneficial bacteria to the gut). |
| Antibiotics | Antibiotic is a drug that is specifically used to inhibit the growth of bacteria. |
| Prebiotics | A non-digestible food ingredient that promotes the growth of beneficial microorganisms in the intestines. |
| Antioxidants | Antioxidants are compounds that inhibit oxidation, a chemical reaction that produces free radicals. |
| Phytogenics | Phytogenics are a group of natural and non-antibiotic growth promoters derived from herbs, spices, essential oils, and oleoresins. |
| Vitamins | Vitamins are organic compounds, which are required for normal growth and maintenance of the body. |
| Metabolism | A chemical process that occurs within a living organism in order to maintain life. |
| Amino acids | Amino acids are the building blocks of proteins and play an important role in metabolic pathways. |
| Enzymes | Enzyme is a substance that acts as a catalyst to bring about a specific biochemical reaction. |
| Anti-microbial resistance | The ability of a microorganism to resist the effects of an antimicrobial agent. |
| Anti-microbial | Destroying or inhibiting the growth of microorganisms. |
| Osmotic balance | It is a process of maintaining salt and water balance across membranes within the body's fluids. |
| Bacteriocin | Bacteriocins are the toxins produced by bacteria to inhibit the growth of similar or closely related bacterial strains. |
| Biohydrogenation | It is a process that occurs in the rumen of an animal in which bacteria convert unsaturated fatty acids (USFA) to saturated fatty acids (SFA). |
| Oxidative rancidity | It is a reaction of fatty acids with oxygen, which generally causes unpleasant odors in animals. To prevent these, antioxidants were added. |
| Mycotoxicosis | Any condition or disease caused by fungal toxins, mainly due to contamination of animal feed with mycotoxins. |
| Mycotoxins | Mycotoxins are toxin compounds that are naturally produced by certain types of molds (fungi). |
| Feed Probiotics | Microbial feed supplements positively affect gastrointestinal microbial balance. |
| Probiotic yeast | Feed yeast (single-cell fungi) and other fungi used as probiotics. |
| Feed enzymes | They are used to supplement digestive enzymes in an animal’s stomach to break down food. Enzymes also ensure that meat and egg production is improved. |
| Mycotoxin detoxifiers | They are used to prevent fungal growth and to stop any harmful mold from being absorbed in the gut and blood. |
| Feed antibiotics | They are used both for the prevention and treatment of diseases but also for rapid growth and development. |
| Feed antioxidants | They are used to protect the deterioration of other feed nutrients in the feed such as fats, vitamins, pigments, and flavoring agents, thus providing nutrient security to the animals. |
| Feed phytogenics | Phytogenics are natural substances, added to livestock feed to promote growth, aid in digestion, and act as anti-microbial agents. |
| Feed vitamins | They are used to maintain the normal physiological function and normal growth and development of animals. |
| Feed flavors and sweetners | These flavors and sweeteners help to mask tastes and odors during changes in additives or medications and make them ideal for animal diets undergoing transition. |
| Feed acidifiers | Animal feed acidifiers are organic acids incorporated into the feed for nutritional or preservative purposes. Acidifiers enhance congestion and microbiological balance in the alimentary and digestive tracts of livestock. |
| Feed minerals | Feed minerals play an important role in the regular dietary requirements of animal feed. |
| Feed binders | Feed binders are the binding agents used in the manufacture of safe animal feed products. It enhances the taste of food and prolongs the storage period of the feed. |
| Key Terms | Abbreviation |
| LSDV | Lumpy Skin Disease Virus |
| ASF | African Swine Fever |
| GPA | Growth Promoter Antibiotics |
| NSP | Non-Starch Polysaccharides |
| PUFA | Polyunsaturated Fatty Acid |
| Afs | Aflatoxins |
| AGP | Antibiotic Growth Promoters |
| FAO | The Food And Agriculture Organization of the United Nations |
| USDA | The United States Department of Agriculture |


Research Methodology
Mordor Intelligence follows a four-step methodology in all our reports.
- Step-1: IDENTIFY KEY VARIABLES: In order to build a robust forecasting methodology, the variables and factors identified in Step-1 are tested against available historical market numbers. Through an iterative process, the variables required for market forecast are set and the model is built on the basis of these variables.
- Step-2: Build a Market Model: Market-size estimations for the forecast years are in nominal terms. Inflation is not a part of the pricing, and the average selling price (ASP) is kept constant throughout the forecast period.
- Step-3: Validate and Finalize: In this important step, all market numbers, variables and analyst calls are validated through an extensive network of primary research experts from the market studied. The respondents are selected across levels and functions to generate a holistic picture of the market studied.
- Step-4: Research Outputs: Syndicated Reports, Custom Consulting Assignments, Databases & Subscription Platforms


