Market Overview
| Study Period | 2021 - 2031 |
|---|---|
| Market Size (2026) | USD 1.47 Billion |
| Market Size (2031) | USD 1.93 Billion |
| Growth Rate (2026 - 2031) | 5.60% CAGR |
| Fastest Growing Market | North America |
| Largest Market | Asia-Pacific |
| Market Concentration | Medium |
Major Players *Disclaimer: Major Players sorted in no particular order Image © Mordor Intelligence. Reuse requires attribution under CC BY 4.0. | |

Feed Antioxidants Market Analysis by Mordor Intelligence
The feed antioxidants market size is projected to increase from USD 1.39 billion in 2025 to USD 1.47 billion in 2026 and reach USD 1.93 billion by 2031, growing at a CAGR of 5.60% over 2026-2031. Robust demand stems from the shift toward natural tocopherols, refinery-by-product monetization, and stricter residue regulations, which are driving up reformulation needs. Higher inclusion of polyunsaturated lipids in aquaculture and specialty poultry amplifies oxidative-stability requirements, opening margin-rich opportunities for encapsulated systems. Patent activity in microencapsulation rose 18% between 2024 and 2025, signaling a move toward precision delivery that synthetic phenolics cannot easily match. However, raw-material volatility for rosemary extract and vitamin E precursors constrains predictable cost structures, prompting integrators to hedge through dual sourcing and forward contracts.
Key Report Takeaways
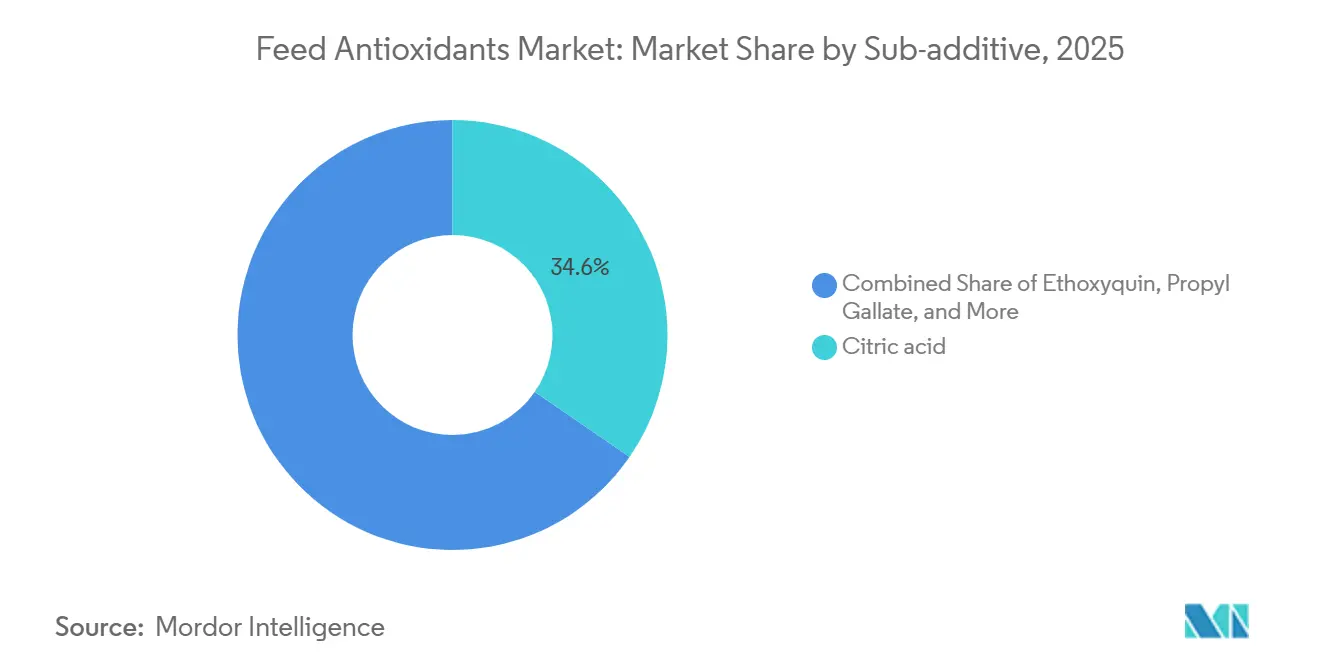
- By sub-additive, citric acid led with 34.6% revenue share of the feed antioxidants market size in 2025, while propyl gallate is projected to expand at a 4.6% CAGR through 2031.
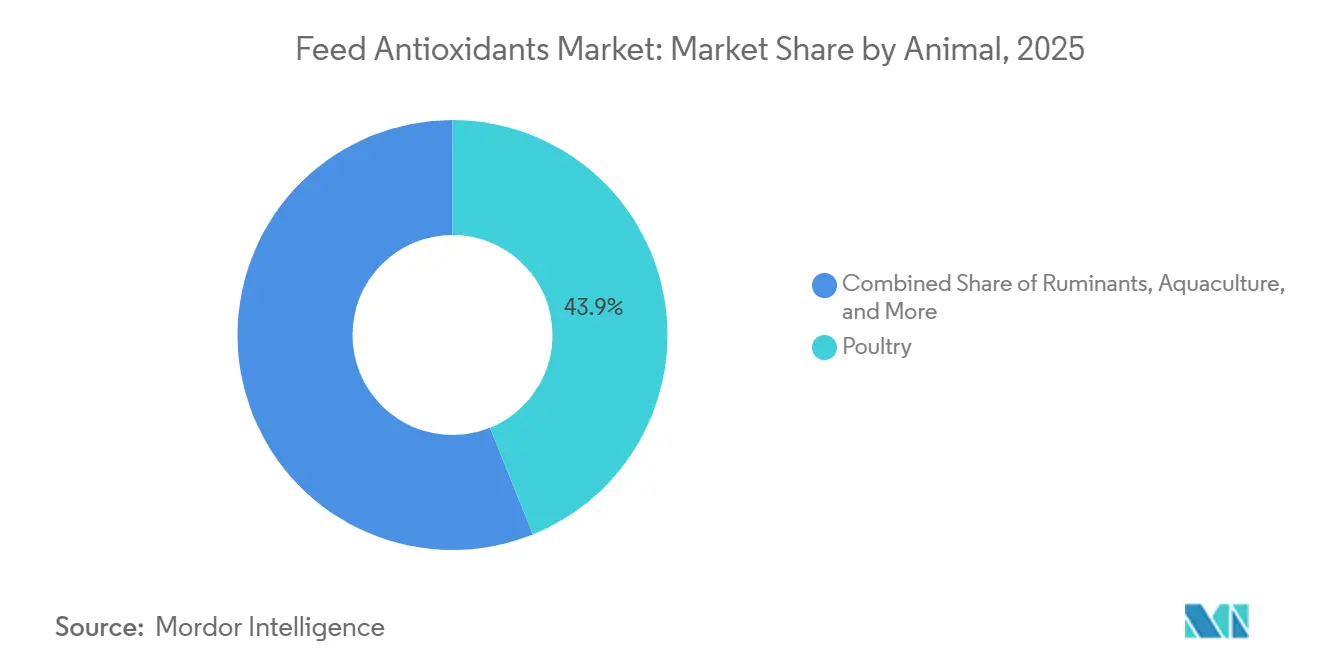
- By animal type, poultry held 43.9% of the feed antioxidants market share in 2025, and ruminants are advancing at a 4.6% CAGR through 2031.
- By geography, Asia-Pacific accounted for a 31.2% share of the feed antioxidants market in 2025, whereas North America is anticipated to grow at a 5.1% CAGR through 2031.
- In 2025, the feed antioxidants market demonstrated moderate concentration, with the top five companies Cargill, Inc., DSM Firmenich AG, BASF SE, Archer Daniels Midland Company, and Bluestar Adisseo Company (ChemChina) collectively holding a significant share of the market.
Note: Market size and forecast figures in this report are generated using Mordor Intelligence’s proprietary estimation framework, updated with the latest available data and insights as of January 2026.
Global Feed Antioxidants Market Trends and Insights
Drivers Impact Analysis*
| Driver | (~) % Impact on CAGR Forecast | Geographic Relevance | Impact Timeline |
|---|---|---|---|
| Surge in polyunsaturated-rich feed formulations | +1.2% | Asia-Pacific aquaculture hubs and North American specialty poultry | Medium term (2–4 years) |
| Regulatory shift toward antioxidant inclusion in pathogen-reduction programs | +0.9% | United States, European Union, and spill-over to the Middle East and Africa | Short term (≤ 2 years) |
| Meat shelf-life mandates in export markets | +0.8% | South America, Asia-Pacific exporters, and Middle East importers | Medium term (2–4 years) |
| Shift from antibiotic growth promoters to oxidative-stress mitigation | +1.1% | Europe, North America, and rapid adoption in Asia-Pacific and South America | Short term (≤ 2 years) |
| Adoption of encapsulated natural tocopherols in aquaculture and specialty feeds | +0.5% | Core uptake in Asia-Pacific, growing in Europe, and South America | Long term (≥ 4 years) |
| Expansion of refinery deodorizer-distillate valorization for feed-grade antioxidants | +0.4% | United States, Brazil, and emerging in India and Indonesia | Long term (≥ 4 years) |
| Source: Mordor Intelligence | |||
Surge in Polyunsaturated-Rich Feed Formulations
Aquaculture and premium poultry producers are increasing omega-3 content, yet higher levels of polyunsaturated fatty acids oxidize rapidly, curtailing shelf life. High-performance shrimp feed in Vietnam now includes up to 9% fish oil, requiring a tocopherol dosage of 250 ppm to keep peroxide values below 5 mEq/kg and maintain feed stability under tropical storage conditions[1]Source: Food and Agriculture Organization, “FAOSTAT—Food and Agriculture Data,” FAO, fao.org. Broiler integrators in the United States and Brazil are adding 1% algal Docosahexaenoic Acid (DHA) to feed to enhance meat quality. These formulations maintain high oxidative stability during 60 days of storage due to the microalgal antioxidants. Encapsulated beadlets cut inclusion rates by roughly 25% because release occurs in the gut rather than the feed bin, favoring suppliers with spray-drying patents. As aquafeed production in the Asia-Pacific region expands, antioxidant inclusion rates are anticipated to rise proportionally due to higher omega-3 enrichment. Continued growth is anticipated as functional-food claims around omega-3 content expand to mainstream retail.
Regulatory Shift Toward Antioxidant Inclusion in Pathogen-Reduction Programs
Food safety regulators now link oxidative stress to pathogen shedding, moving antioxidants from optional preservative status to integral Hazard Analysis and Critical Control Points elements. The Food Safety and Inspection Service (FSIS) is focusing its 2025/2026 initiatives on new product standards and verification testing, rather than requiring feed additives like vitamin E, to reduce Salmonella illnesses[2]Source: United States Department of Agriculture Food Safety and Inspection Service, “Technical Bulletins and Guidelines,” USDA FSIS, fsis.usda.gov. Oxidized lipids in broiler feed reduce tight junction protein expression, compromising gut barrier integrity and enabling the translocation of pathogens, such as Campylobacter, into mucosal tissues. Importers in the Middle East and Africa adopt these benchmarks as pre-shipment criteria, compelling South American exporters to reformulate. Natural antioxidants face fewer residue limits, accelerating demand as synthetic phenolics decline.
Meat Shelf-Life Mandates in Export Markets
Importers are imposing oxidative-rancidity ceilings that compel upstream use of antioxidants. To meet Saudi Standards and the Metrology and Quality Organization (SASO) quality standards, poultry exporters to Saudi Arabia use in-feed antioxidants to maintain Thiobarbituric Acid Reactive Substances values at 0.5–1.0 mg/kg, ensuring lipid stability and preventing rancidity throughout the cold chain[3]Source: Saudi Standards, Metrology and Quality Organization, “Meat Quality and Safety Standards,” SASO, saso.gov.sa. To meet China's updated National Food Safety Standard GB 10146, Brazilian pork exporters increased tocopherol dosing to keep peroxide values below 10 mEq/kg during transit, ensuring stability while expanding into markets such as Japan and the Philippines. Economics are favorable, as a USD 0.10 per kilogram premium on finished meat offsets a USD 0.03 per kilogram feed-cost uptick. Integrators view antioxidant investment as a margin-accretive compliance mechanism for premium channels.
Shift From Antibiotic Growth Promoters to Oxidative-Stress Mitigation
As antibiotic growth promoters are phased out, oxidative stress becomes a primary hurdle to feed conversion and immune competence. By 2025, Vitamin E inclusion in broiler diets reached 100 IU/kg in antibiotic-free environments, up from 2020 levels. Trials in China and Thailand showed a 2% FCR improvement and a 1% point mortality reduction by reducing oxidative stress. Regulatory bans in Europe set precedents followed by Vietnam, Thailand, and Brazil, making antioxidants foundational to antibiotic-free programs. Suppliers now market antioxidants as dual-purpose immune and shelf-life tools, a positioning that expands addressable spend. This pivot lifts demand, especially in Asia-Pacific, where antibiotic curbs took effect for several species in 2025.
Restraints Impact Analysis*
| Restraint | (~) % Impact on CAGR Forecast | Geographic Relevance | Impact Timeline |
|---|---|---|---|
| Tightening maximum-residue limits for synthetic phenolics | -0.7% | Europe and China will spill over into neighboring markets | Short term (≤ 2 years) |
| Volatile raw-material pricing for natural extracts | -0.5% | Europe and Asia‑Pacific importers | Medium term (2–4 years) |
| Label-friendly reformulation costs for integrators | -0.3% | North America, Europe, and emerging in the Asia‑Pacific | Medium term (2–4 years) |
| Sporadic supply shocks in the vitamin E value chain | -0.4% | Global, precursor reliance on China | Short term (≤ 2 years) |
| Source: Mordor Intelligence | |||
Tightening Maximum-Residue Limits for Synthetic Phenolics
To meet stricter European and Chinese safety standards in 2025, livestock and pet food integrators are replacing Butylated Hydroxyanisole (BHA) and Butylated Hydroxytoluene (BHT) with natural alternatives such as tocopherols and plant extracts, due to new restrictions on synthetic phenolics. EU safety reviews of Butylated Hydroxytoluene (BHT), which held a 42.1% market share in 2025, have led to reformulations requiring 12- to 18-month stability trials. Natural antioxidant adoption is increasing, supported by rising regulatory scrutiny of synthetic additives. China is evaluating tighter regulatory oversight of feed additives under its 2025 legislative agenda.
Volatile Raw-Material Pricing for Natural Extracts
The 2023–2025 Mediterranean drought reduced rosemary production by 30%, resulting in a significant shortage of high-purity carnosic acid concentrates and increased pricing in the 2026 market. While El Niño spurred a record 9% increase in South American soybean production for the 2024/25 season, drastically lowering raw material costs, global tocopherol pricing remained volatile due to supply-side disruptions at major European manufacturing sites. Integrators operating on 60-day contracts lack hedging tools, so cost spikes eat into already narrow margins. Europe imports 90% of its rosemary extract from drought-hit Mediterranean regions, causing price volatility that is expected to reduce ingredient market growth by 0.5% until synthetic biology or diversified sourcing provides a stable supply.
*Our forecasts treat driver/restraint impacts as directional, not additive. The impact forecasts reflect baseline growth, mix effects, and variable interactions.
Segment Analysis
By Sub-Additive: Citric Acid Dominates on Synergist Economics
Citric acid accounted for 34.6% of the feed antioxidants market size in 2025, while propyl gallate is projected to expand at a 4.6% CAGR through 2031. The higher citric acid content is due to its metal chelation, which enhances tocopherol efficacy, allowing formulators to reduce overall antioxidant dosing by up to 15%. Propyl gallate benefits from residue-friendly profiles ideal for dairy and beef exporters facing strict limits on Butylated Hydroxytoluene (BHT). Together, these two molecules illustrate the market’s twin priorities of proven synergists for volume applications and label-friendly alternatives for premium meats. Their contrasting growth paths highlight how tightening residue rules and cost management shape purchasing decisions across integrators worldwide.
Butylated hydroxyanisole and butylated hydroxytoluene jointly accounted for a prominent share of the 2025 Feed antioxidants market size but face steady erosion as Europe and China restrict synthetic phenolic residues, pushing poultry and swine producers toward natural blends. Tocopherols captured a significant share of the feed antioxidants market and continue to gain ground in clean-label programs, though raw-material volatility moderates uptake in price-sensitive regions. Ethoxyquin ban in the European Union, prompting aquafeed formulators to adopt tocopherol-astaxanthin combinations despite higher costs. Smaller niches such as tertiary butylhydroquinone, green-tea polyphenols, and emerging botanical mixes collectively accounted for a decent share and is anticipated to grow at a significant CAGR as pet food and specialty livestock brands seek differentiation.


By Animal: Poultry Leads, Ruminants Accelerate
Poultry held 43.9% of the feed antioxidants market share in 2025, and ruminants are advancing at a 4.6% CAGR through 2031. Poultry's higher share is owing to broiler and layer integrators that rely on tocopherol-citric acid blends to extend chilled-meat shelf life and support omega-3 enrichment programs. Robust retailer standards for antibiotic-free labeling reinforce antioxidant inclusion, making poultry the volume backbone for suppliers. Ruminants are the fastest among species, as grass-fed beef and high-fat dairy rations demand higher tocopherol-selenium doses to curb polyunsaturated fatty-acid oxidation. This growth is further propelled by premium export channels that tie carcass-quality bonuses to oxidative-stability metrics.
Aquaculture accounted for a significant share of the feed antioxidants market in 2025, with the demand for feed antioxidants rising significantly among fish and shrimp, respectively, on the back of higher-lipid feeds in the Asia-Pacific. Swine accounted for prominent demand, but uptake is tempered by price sensitivity and staggered antibiotic-growth-promoter bans in several Asian markets. Other animal types collectively represent a decent share and are advancing at a significant rate annually as premium pet-food brands leverage natural antioxidants for joint-health and cognitive claims. Together, these secondary segments diversify demand and cushion suppliers against volatility in any single livestock category.
Geography Analysis
Asia-Pacific led the feed antioxidants market with 31.2% of global revenue in 2025, supported by dominant aquaculture production and rising tocopherol use in high-energy poultry and swine rations. China, Vietnam, Thailand, and India together accounted for more than two-thirds of the region’s volume as exporters raised antioxidant inclusion levels to meet European Union and United States residue standards. North America is projected to post the fastest regional growth at a 5.1% CAGR through 2031, driven by clean-label reformulation that shifts integrators away from synthetic phenolics toward natural tocopherol-rosemary blends. Record US broiler production of 20.4 million metric tons in 2025 is driving demand for specialty additives, as retailers increasingly require antibiotic-free protocols along with oxidative-stability assurances to maintain meat quality and shelf life.
Europe continues to pivot toward higher-priced natural antioxidants because stringent residue caps are squeezing synthetic phenolic use, yet mature livestock sectors limit their growth potential. South America gains from Brazil’s poultry exports and Argentina’s grass-fed beef premiums, advancing on rigorous shelf-life rules in Middle Eastern and Asian destinations. Africa benefits from poultry intensification in Kenya, South Africa, and Nigeria, while dairy cooperatives add tocopherol-selenium blends to improve milk quality. The Middle East enlarges demand as Saudi Arabia and the United Arab Emirates mandate antioxidant supplementation to curb rancidity in hot climates.
Region-specific capacity expansions and regulatory harmonization are set to widen market reach over the next five years. North American deodorizer-distillate recovery units shorten lead times and reduce reliance on imports, giving integrators cost certainty. Asia-Pacific’s work toward unified Association of Southeast Asian Nations residue limits will favor suppliers with cross-border technical service, streamlining product rollouts. Meanwhile, stricter export standards in Africa and South America reinforce antioxidant inclusion as a ticket to premium channels, bolstering global demand even if individual regions face feed-cost volatility.


Competitive Landscape
Together with Cargill, Inc., DSM-Firmenich AG, BASF SE, Archer Daniels Midland Company, and Bluestar Adisseo Company (ChemChina), the top five players accounted for a major share of the feed antioxidants market in 2025, indicating moderate concentration. Cargill, Inc. and DSM-Firmenich AG anchor the market, leveraging vertical integration in oilseed refining and vitamins to ensure tocopherol supply, while bundling enzymes and amino acids through long-term supply contracts. These leaders invest heavily in spray-drying and co-extrusion lines that support encapsulated antioxidants for aquaculture and premium poultry segments.
Regional specialists such as Kemin Industries Inc. and Camlin Fine Sciences Ltd. differentiate through proprietary delivery systems protected by robust patent portfolios. Agolin SA and Perstorp Holding AB (Petronas Chemicals Group Bhd) innovate with plant-based or multifunctional additives that pair antioxidant activity with methane reduction or gut health benefits, addressing sustainability targets in Europe and North America. New entrants cluster around fermentation-derived tocopherols to sidestep raw-material swings, though scale-up economics remain untested.
Growth strategies for 2026 focus on localized production to reduce logistical risks. BASF SE is completing a capacity expansion in Ludwigshafen, aiming to increase vitamin E availability by 10% by 2027. Kemin's planned investments in Southeast Asia by 2025 are intended to reduce lead times to 10 days. Additionally, Archer Daniels Midland and Wilmar International are expanding downstream operations in Indonesia to utilize palm-oil distillates by 2027, addressing key supply gaps in the Asia-Pacific region.
Feed Antioxidants Industry Leaders
Cargill, Inc.
DSM-firmenich AG
BASF SE
Archer Daniels Midland Company
Bluestar Adisseo Company (ChemChina)
- *Disclaimer: Major Players sorted in no particular order


Recent Industry Developments
- January 2026: Avitech Nutrition set up a dedicated Trading Division in India to distribute vitamin blends and straight vitamins, ensuring steadier domestic access to key feed antioxidant inputs such as vitamin E and vitamin C. The initiative is expected to shorten lead times for premix manufacturers that currently rely on imports, reducing price volatility for natural‐antioxidant formulations
- October 2025: De Heus invested USD 17 million in a new 180,000 metric-ton feed plant in Rajpura, India, with separate lines for poultry, cattle, and swine diets. The modern facility is designed to incorporate natural tocopherol‐rosemary blends as standard shelf-life insurance, immediately adding regional demand for clean-label antioxidants as India phases down synthetic phenolics.
- March 2025: DIC Group subsidiary Earthrise Nutritionals opened an USD 8 million spirulina cultivation site in California to scale LINABLUE phycocyanin, a spirulina-derived antioxidant pigment. Although marketed primarily as a natural colorant, phycocyanin’s strong free-radical–scavenging capacity positions it as an emerging botanical antioxidant for specialty aquafeeds, signaling diversification beyond conventional tocopherols.


Global Feed Antioxidants Market Report Scope
The feed antioxidants market encompasses the global industry focused on the production and distribution of chemical and natural additives used in animal diets to prevent oxidative deterioration. These additives play a vital role in preserving the nutritional quality, safety, and shelf life of animal feed by preventing the oxidation of fats, vitamins, and other sensitive nutrients.
The feed antioxidants market report analyzes the market across sub-additives such as Butylated Hydroxyanisole, Butylated Hydroxytoluene, Citric Acid, Ethoxyquin, Propyl Gallate, Tocopherols, and other antioxidants. It further categorizes the market by animal type, covering aquaculture, poultry, ruminants, swine, and other animals, and by geographic regions including North America, South America, Europe, Asia Pacific, and the Middle East and Africa. Market forecasts are presented in both value (USD) and volume (units).
By Sub-Additive
| Butylated Hydroxyanisole (BHA) |
| Butylated Hydroxytoluene (BHT) |
| Citric Acid |
| Ethoxyquin |
| Propyl Gallate |
| Tocopherols |
| Other Antioxidants |
By Animal
| Ruminants | Beef Cattle |
| Dairy Cattle | |
| Other Ruminants | |
| Poultry | Broiler |
| Layer | |
| Other Poultry Birds | |
| Swine | |
| Aquaculture | Fish |
| Shrimp | |
| Other Aquaculture Species | |
| Other Animals |
By Geography
| North America | United States |
| Canada | |
| Mexico | |
| Rest of North America | |
| South America | Brazil |
| Argentina | |
| Chile | |
| Rest of South America | |
| Europe | Germany |
| France | |
| Italy | |
| Spain | |
| Netherlands | |
| Russia | |
| United Kingdom | |
| Rest of Europe | |
| Asia-Pacific | China |
| India | |
| Japan | |
| South Korea | |
| Indonesia | |
| Philippines | |
| Thailand | |
| Vietnam | |
| Australia | |
| Rest of Asia-Pacific | |
| Middle East | Iran |
| Saudi Arabia | |
| Turkey | |
| Rest of Middle East | |
| Africa | South Africa |
| Kenya | |
| Rest of Africa |
| By Sub-Additive | Butylated Hydroxyanisole (BHA) | |
| Butylated Hydroxytoluene (BHT) | ||
| Citric Acid | ||
| Ethoxyquin | ||
| Propyl Gallate | ||
| Tocopherols | ||
| Other Antioxidants | ||
| By Animal | Ruminants | Beef Cattle |
| Dairy Cattle | ||
| Other Ruminants | ||
| Poultry | Broiler | |
| Layer | ||
| Other Poultry Birds | ||
| Swine | ||
| Aquaculture | Fish | |
| Shrimp | ||
| Other Aquaculture Species | ||
| Other Animals | ||
| By Geography | North America | United States |
| Canada | ||
| Mexico | ||
| Rest of North America | ||
| South America | Brazil | |
| Argentina | ||
| Chile | ||
| Rest of South America | ||
| Europe | Germany | |
| France | ||
| Italy | ||
| Spain | ||
| Netherlands | ||
| Russia | ||
| United Kingdom | ||
| Rest of Europe | ||
| Asia-Pacific | China | |
| India | ||
| Japan | ||
| South Korea | ||
| Indonesia | ||
| Philippines | ||
| Thailand | ||
| Vietnam | ||
| Australia | ||
| Rest of Asia-Pacific | ||
| Middle East | Iran | |
| Saudi Arabia | ||
| Turkey | ||
| Rest of Middle East | ||
| Africa | South Africa | |
| Kenya | ||
| Rest of Africa | ||


Market Definition
- FUNCTIONS - For the study, feed additives are considered to be commercially manufactured products that are used to enhance characteristics such as weight gain, feed conversion ratio, and feed intake when fed in appropriate proportions.
- RESELLERS - Companies engaged in reselling feed additives without value addition have been excluded from the market scope, to avoid double counting.
- END CONSUMERS - Compound feed manufacturers are considered to be end-consumers in the market studied. The scope excludes farmers buying feed additives to be used directly as supplements or premixes.
- INTERNAL COMPANY CONSUMPTION - Companies engaged in the production of compound feed as well as the manufacturing of feed additives are part of the study. However, while estimating the market sizes, the internal consumption of feed additives by such companies has been excluded.
| Keyword | Definition |
|---|---|
| Feed additives | Feed additives are products used in animal nutrition for purposes of improving the quality of feed and the quality of food from animal origin, or to improve the animals’ performance and health. |
| Probiotics | Probiotics are microorganisms introduced into the body for their beneficial qualities. (It maintains or restores beneficial bacteria to the gut). |
| Antibiotics | Antibiotic is a drug that is specifically used to inhibit the growth of bacteria. |
| Prebiotics | A non-digestible food ingredient that promotes the growth of beneficial microorganisms in the intestines. |
| Antioxidants | Antioxidants are compounds that inhibit oxidation, a chemical reaction that produces free radicals. |
| Phytogenics | Phytogenics are a group of natural and non-antibiotic growth promoters derived from herbs, spices, essential oils, and oleoresins. |
| Vitamins | Vitamins are organic compounds, which are required for normal growth and maintenance of the body. |
| Metabolism | A chemical process that occurs within a living organism in order to maintain life. |
| Amino acids | Amino acids are the building blocks of proteins and play an important role in metabolic pathways. |
| Enzymes | Enzyme is a substance that acts as a catalyst to bring about a specific biochemical reaction. |
| Anti-microbial resistance | The ability of a microorganism to resist the effects of an antimicrobial agent. |
| Anti-microbial | Destroying or inhibiting the growth of microorganisms. |
| Osmotic balance | It is a process of maintaining salt and water balance across membranes within the body's fluids. |
| Bacteriocin | Bacteriocins are the toxins produced by bacteria to inhibit the growth of similar or closely related bacterial strains. |
| Biohydrogenation | It is a process that occurs in the rumen of an animal in which bacteria convert unsaturated fatty acids (USFA) to saturated fatty acids (SFA). |
| Oxidative rancidity | It is a reaction of fatty acids with oxygen, which generally causes unpleasant odors in animals. To prevent these, antioxidants were added. |
| Mycotoxicosis | Any condition or disease caused by fungal toxins, mainly due to contamination of animal feed with mycotoxins. |
| Mycotoxins | Mycotoxins are toxin compounds that are naturally produced by certain types of molds (fungi). |
| Feed Probiotics | Microbial feed supplements positively affect gastrointestinal microbial balance. |
| Probiotic yeast | Feed yeast (single-cell fungi) and other fungi used as probiotics. |
| Feed enzymes | They are used to supplement digestive enzymes in an animal’s stomach to break down food. Enzymes also ensure that meat and egg production is improved. |
| Mycotoxin detoxifiers | They are used to prevent fungal growth and to stop any harmful mold from being absorbed in the gut and blood. |
| Feed antibiotics | They are used both for the prevention and treatment of diseases but also for rapid growth and development. |
| Feed antioxidants | They are used to protect the deterioration of other feed nutrients in the feed such as fats, vitamins, pigments, and flavoring agents, thus providing nutrient security to the animals. |
| Feed phytogenics | Phytogenics are natural substances, added to livestock feed to promote growth, aid in digestion, and act as anti-microbial agents. |
| Feed vitamins | They are used to maintain the normal physiological function and normal growth and development of animals. |
| Feed flavors and sweetners | These flavors and sweeteners help to mask tastes and odors during changes in additives or medications and make them ideal for animal diets undergoing transition. |
| Feed acidifiers | Animal feed acidifiers are organic acids incorporated into the feed for nutritional or preservative purposes. Acidifiers enhance congestion and microbiological balance in the alimentary and digestive tracts of livestock. |
| Feed minerals | Feed minerals play an important role in the regular dietary requirements of animal feed. |
| Feed binders | Feed binders are the binding agents used in the manufacture of safe animal feed products. It enhances the taste of food and prolongs the storage period of the feed. |
| Key Terms | Abbreviation |
| LSDV | Lumpy Skin Disease Virus |
| ASF | African Swine Fever |
| GPA | Growth Promoter Antibiotics |
| NSP | Non-Starch Polysaccharides |
| PUFA | Polyunsaturated Fatty Acid |
| Afs | Aflatoxins |
| AGP | Antibiotic Growth Promoters |
| FAO | The Food And Agriculture Organization of the United Nations |
| USDA | The United States Department of Agriculture |


Research Methodology
Mordor Intelligence follows a four-step methodology in all our reports.
- Step-1: IDENTIFY KEY VARIABLES: In order to build a robust forecasting methodology, the variables and factors identified in Step-1 are tested against available historical market numbers. Through an iterative process, the variables required for market forecast are set and the model is built on the basis of these variables.
- Step-2: Build a Market Model: Market-size estimations for the forecast years are in nominal terms. Inflation is not a part of the pricing, and the average selling price (ASP) is kept constant throughout the forecast period.
- Step-3: Validate and Finalize: In this important step, all market numbers, variables and analyst calls are validated through an extensive network of primary research experts from the market studied. The respondents are selected across levels and functions to generate a holistic picture of the market studied.
- Step-4: Research Outputs: Syndicated Reports, Custom Consulting Assignments, Databases & Subscription Platforms


