Europe Courier, Express, And Parcel (CEP) Market Size and Share
Market Overview
| Study Period | 2020 - 2031 |
|---|---|
| Forecast Data Period | 2026 - 2031 |
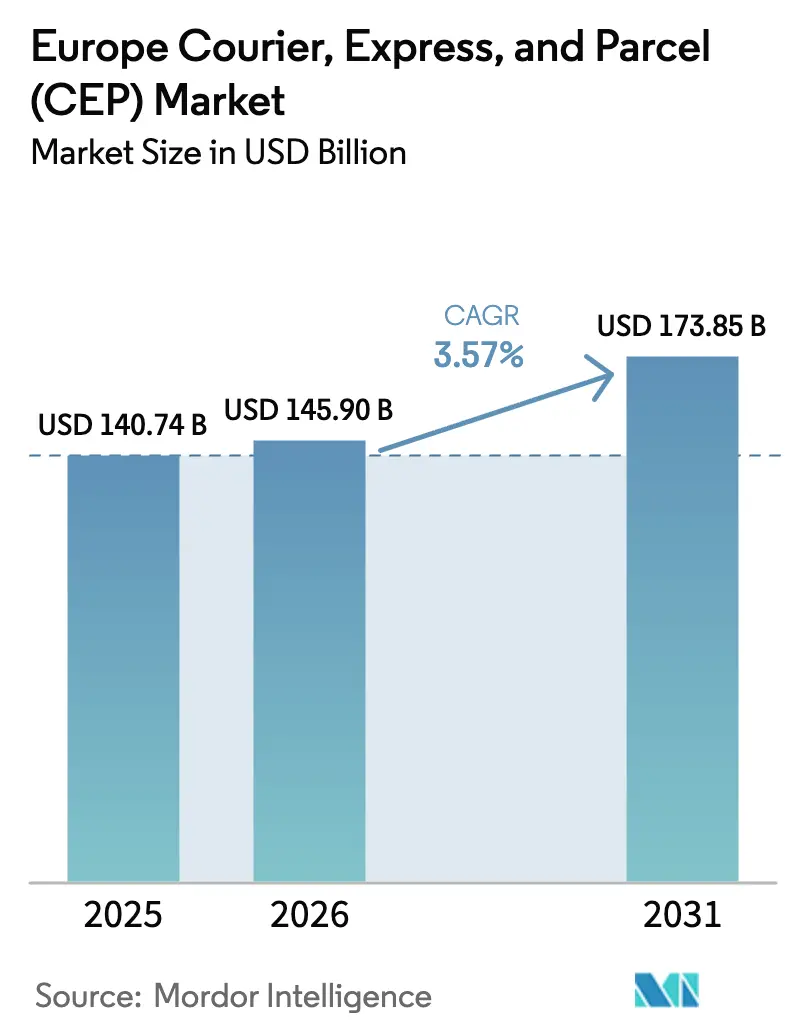
| Base Year Market Size (2025) | USD 140.74 Billion |
| Market Size (2026) | USD 145.90 Billion |
| Market Size (2031) | USD 173.85 Billion |
| Growth Rate (2026 - 2031) | 3.57% CAGR |
| Market Concentration | Medium |
Major Players *Disclaimer: Major Players sorted in no particular order Image © Mordor Intelligence. Reuse requires attribution under CC BY 4.0. | |
Europe Courier, Express, And Parcel (CEP) Market Analysis by Mordor Intelligence
The Europe courier, express, and parcel (CEP) market size is projected to be USD 140.74 billion in 2025 and USD 145.90 billion in 2026, and reach USD 173.85 billion by 2031, growing at a CAGR of 3.57% from 2026 to 2031.
Momentum stems from rising parcel density in large metropolitan corridors, deployment of automated locker infrastructure, and the European Union’s digital customs reforms that streamline cross-border flows. Operators concentrate on density optimization rather than sheer volume growth, replacing hub-and-spoke tactics with micro-fulfillment nodes that shorten the final mile. Cloud-native multi-carrier platforms provide small sellers with enterprise-grade routing tools, eroding incumbents’ historical technology moat. At the same time, labor shortages exceeding 500,000 drivers push networks toward robotics and predictive routing that trim empty miles and support low-emission fleet rollouts. Dimensional-weight pricing and fuel surcharges pressure yields, but premium services in healthcare and international express offset part of the margin squeeze.
Key Report Takeaways
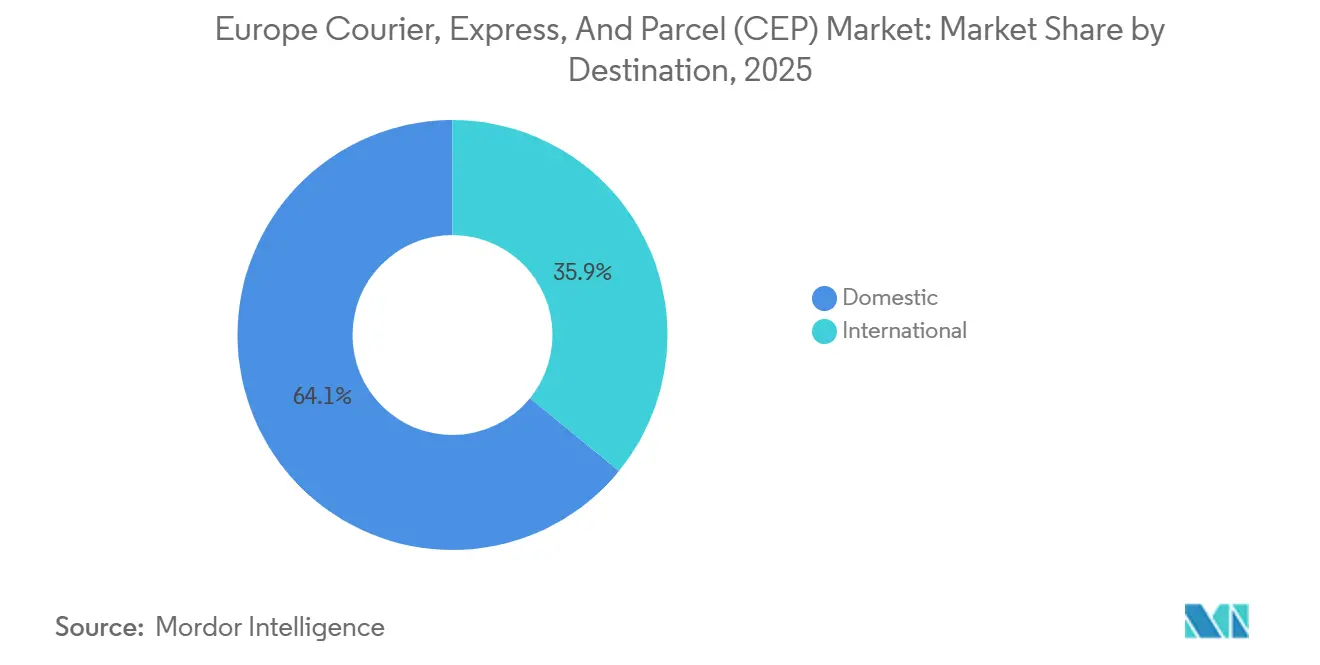
- By destination, domestic parcels held 64.15% of the Europe courier, express, and parcel (CEP) market size in 2025, while international consignments are projected to advance at a 3.87% CAGR through 2031.
- By speed of delivery, non-express services commanded 75.24% market share in 2025, whereas express shipments are forecast to climb at a 4.24% CAGR through 2031.
- By business model, B2C flows accounted for 52.58% of the 2025 Europe courier, express, and parcel (CEP) market size, yet C2C volumes are set to expand fastest at a 5.43% CAGR to 2031.
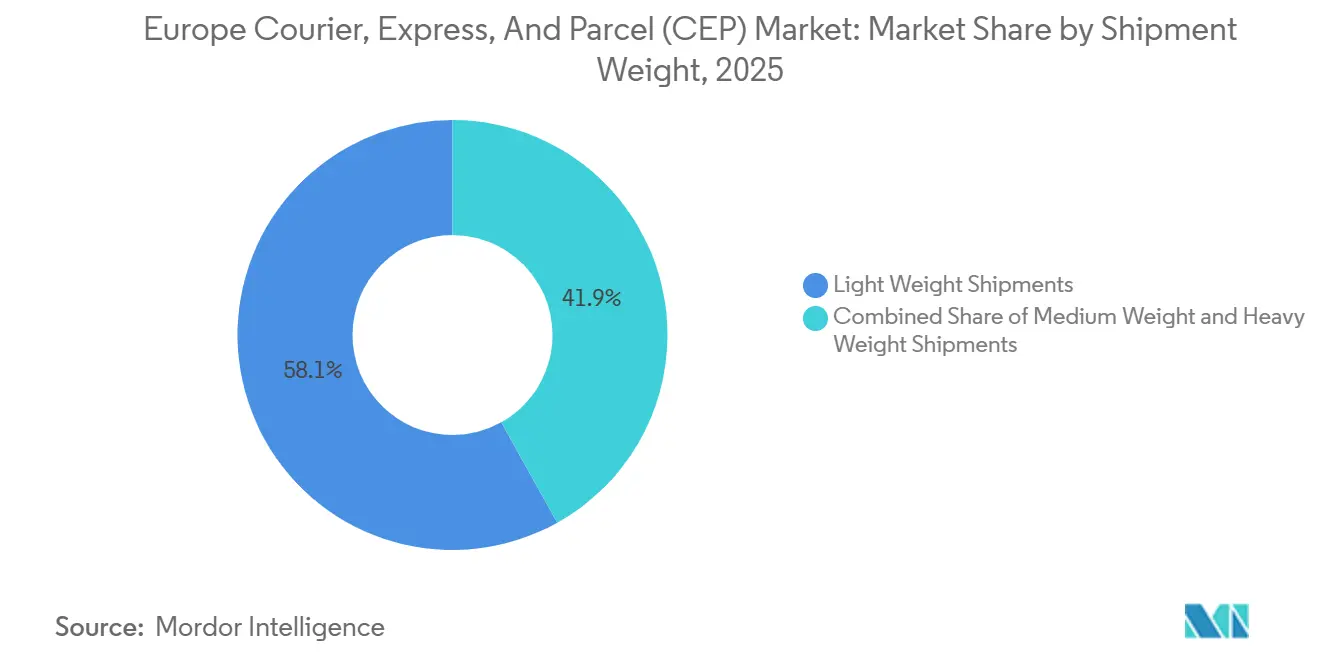
- By shipment weight, light parcels represented 58.10% of the 2025 value, but heavy-weight items are expected to post the strongest growth at a 4.40% CAGR between 2026 and 2031.
- By mode of transport, road deliveries contributed 52.07% of market share in 2025, while air freight leads growth with a 5.12% CAGR through 2031.
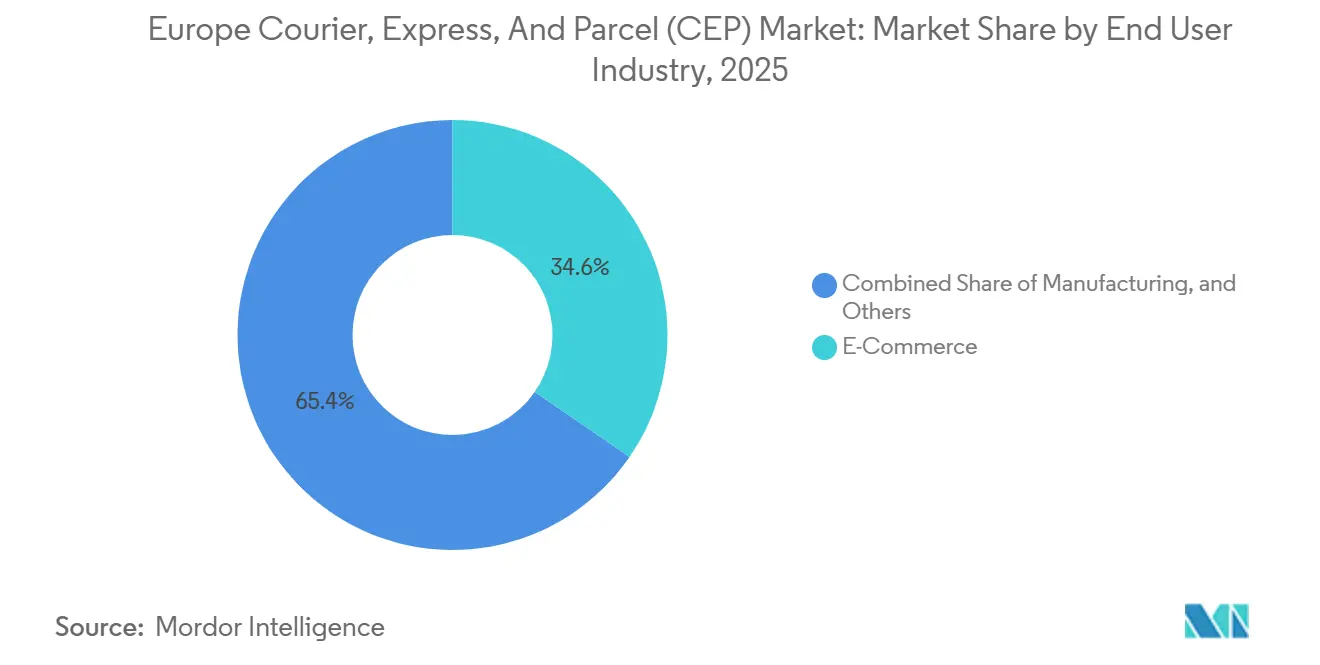
- By end-user industry, e-commerce generated 34.55% of 2025 sales, yet healthcare is poised for the quickest rise, registering a 5.41% CAGR during 2026-2031.
- By country, Germany led with 21.04% of the market share in 2025, whereas Netherlands is projected to log a 4.94% CAGR between 2026-2031.
Note: Market size and forecast figures in this report are generated using Mordor Intelligence’s proprietary estimation framework, updated with the latest available data and insights as of 2026.
Europe Courier, Express, And Parcel (CEP) Market Trends and Insights
Drivers Impact Analysis*
| Driver | (~) % Impact on CAGR Forecast | Geographic Relevance | Impact Timeline |
|---|---|---|---|
| Surge in online retail transactions and hybrid shopping models | +1.1% | Germany, France, United Kingdom, with spillover to Nordic | Medium term (2-4 years) |
| EU single-market customs simplification accelerating cross-border parcel flows | +0.9% | EU-wide, strongest in Benelux, Germany, Poland | Long term (≥ 4 years) |
| Proliferation of out-of-home delivery points (lockers, pick-up shops) | +0.7% | Poland, United Kingdom, France, expanding to Southern Europe | Medium term (2-4 years) |
| Roll-out of smart automation, robotics, and predictive routing in hubs | +0.6% | Germany, Netherlands, Nordic countries | Long term (≥ 4 years) |
| Regulatory push toward low-emission logistics and electrified vehicle fleets | +0.5% | Netherlands, Germany, Nordic countries, United Kingdom | Long term (≥ 4 years) |
| Adoption of cloud-based multi-carrier shipping software among SMEs | +0.4% | United Kingdom, Germany, France, Italy | Short term (≤ 2 years) |
| Source: Mordor Intelligence | |||
Surge in Online Retail Transactions and Hybrid Shopping Models
Hybrid shoppers who alternate between digital and physical channels generate 2.3 times more parcels and record 40% fewer returns than single-channel buyers, raising network density without proportional reverse-logistics cost escalation. Click-and-collect now appears in 78% of European store networks, shifting last-mile costs to consumers while boosting in-store basket value by 23%. Germany’s USD 3.99 billion e-commerce packaging market, growing at 14.03% CAGR, reflects retailer investments in micro-fulfillment units that cut delivery distance by 60-70%. Social-commerce platforms such as TikTok Shop inject sporadic demand spikes, forcing carriers to maintain base capacity year-round. Regional specialists capable of linking store inventory to locker networks increasingly displace national posts whose fixed hubs cannot pivot quickly to these granular flows[1]“EU Customs Data Hub Goes Live,” European Commission, taxation-customs.ec.europa.eu.
EU Single-Market Customs Simplification Accelerating Cross-Border Parcel Flows
The EU Customs Data Hub, operational since October 2024, merges declarations from all 27 states into one interface that enables pre-arrival risk analysis, slicing compliant transit times by 30-40%. Import Control System 2 coverage of road and rail by September 2025, and ViDA’s One-Stop Shop for B2C VAT cut paperwork costs up to 50%. International parcels, therefore, grow 30 basis points faster than domestic consignments. Operators with API-driven brokerage tools monetize pre-clearance, while small regionals risk penalties under real-time reporting rules from 2028 onward[2]“ReFuelEU Aviation,” European Commission, transport.ec.europa.eu .
Proliferation of Out-of-Home Delivery Points (Lockers, Pick-Up Shops)
InPost installed 11,500 lockers in 2024, raising its network to 46,977 European sites and confirming lockers as the lowest-cost urban solution at EUR 1.50 per parcel, versus EUR 5 for doorstep drops in congestion zones. Consumers value flexibility; 72% rank locker access as a top buying factor, cutting cart abandonment by up to 15%. Partnerships with WHSmith and Galp reuse high-street and petrol real estate, speeding roll-out without greenfield spend. Traditional couriers and Amazon follow suit, since zero-emission zones restrict van entry during peak windows and favor consolidated locker drops.
Roll-Out of Smart Automation, Robotics, and Predictive Routing in Hubs
In 2024, the warehouse automation market, valued at EUR 4.2 billion (USD 4.83 billion), is witnessing robust growth. This surge is largely attributed to automated sorters, which efficiently manage 30,000-40,000 parcels every hour with an impressive 99.9% accuracy. This level of precision has led to a significant reduction in fixed hub costs, trimming expenses by 20-25% compared to traditional manual lines. AI routing used by DHL and UPS cuts miles driven 10-15% and lifts on-time rates to 97%. Forecasting engines pre-allocate capacity, curbing peak-season capital burn. High debt tolerance, therefore, becomes a competitive prerequisite because subscale carriers cannot fund robotics while coping with wage inflation.
Restraints Impact Analysis*
| Restraint | (~) % Impact on CAGR Forecast | Geographic Relevance | Impact Timeline |
|---|---|---|---|
| Intensifying price competition and volumetric-weight pricing eroding yields | -0.8% | United Kingdom, Germany, France, Italy | Short term (≤ 2 years) |
| Persistent shortage of qualified couriers and fulfilment staff | -0.6% | EU-wide, most severe in Germany, Netherlands, United Kingdom | Medium term (2-4 years) |
| National minimum-wage and work-time mandates inflating operating expenses | -0.5% | France, Germany, Spain, Netherlands | Medium term (2-4 years) |
| Escalating investment needs for data protection and sovereign-cloud compliance | -0.4% | EU-wide, enhanced focus in Germany, France | Long term (≥ 4 years) |
| Source: Mordor Intelligence | |||
Intensifying Price Competition and Volumetric-Weight Pricing Eroding Yields
DHL, FedEx, and UPS switched to volumetric formulas in 2024, lifting billable weights 15-20% for bulky apparel, prompting shippers to defect to regionals offering flat rates and shrinking industry margins from 8-9% in 2022 to 5-6% in 2025. InPost’s acquisitions of Yodel and Sending underscore a race for density that spreads fixed cost across more parcels, since organic growth cannot offset yield erosion in mature corridors[3]“Adequate Minimum Wages in the EU,” European Commission, ec.europa.eu .
Persistent Shortage of Qualified Couriers and Fulfillment Staff
Europe's CEP sector is experiencing a severe labor shortage, with over 500,000 drivers needed and 37% of couriers aged 50 or older. Fulfillment centers face persistent 15-20% vacancy rates in warehouse roles despite low skill requirements. Policy changes, such as lowering the HGV license age to 18, are slow and will take years to address workforce gaps. These shortages restrict peak-season capacity and compel operators to adopt automation to sustain throughput. The labor crunch highlights structural challenges in meeting demand across the CEP sector.[4]“Data Act,” European Commission, digital-strategy.ec.europa.eu.
*Our forecasts treat driver/restraint impacts as directional, not additive. The impact forecasts reflect baseline growth, mix effects, and variable interactions.
Segment Analysis
By End-User Industry: Healthcare Leads Growth Through Specialized Requirements
E-commerce still represented 34.55% of the market size in 2025, though healthcare’s 5.41% CAGR makes it the headline growth engine. DHL’s EUR 2 billion (USD 2.08 billion) health logistics investment underlines a pivot toward temperature-controlled and same-day services that protect margin.
Wholesale and retail trade reshape flows via omnichannel, while manufacturing relies on express lanes to avoid costly line stoppages. Regulatory GDP certification is a high barrier to entry, insulating incumbents.


By Destination: Customs Digitalization Unlocks Cross-Border Velocity
Domestic consignments held 64.15% of the Europe courier express and parcel market share in 2025, but international flows rise 3.87% CAGR to 2031 as the Customs Data Hub ensured near-frictionless clearance. The One-Stop Shop VAT portal removes multi-country registrations and halves compliance spend, supporting small merchants entering new EU markets. Domestic margins tighten because urban locker delivery drives down price benchmarks, whereas compliance automation lets cross-border specialists charge premiums for certainty.
International density improvement means the Europe courier express and parcel market size for international flows could approach a significant value by 2031 if current mix trends persist. Out-of-home networks reduce re-delivery risk, boosting service quality for shoppers ordering across languages and currencies. Carriers that integrate dynamic duty calculators and customs APIs gain share ahead of the 2028 mandatory e-invoicing milestone.
By Speed of Delivery: Express Services Capture Premium Healthcare Demand
Non-express held 75.24% market share in 2025 as price-sensitive shoppers accept 3-5 day windows. Express products, however, post 4.24% CAGR supported by a GDP-compliant cold chain for biologics and critical automotive parts. The Europe courier express, and parcel market size for express may top USD 43 billion by 2031, benefiting from SAF-enabled carbon-neutral air lanes that large corporates favor to hit ESG targets.
As tracking expectations converge, standard services copy express features, forcing operators to differentiate on temperature control, security sealing, and in-flight customer support rather than time alone. Blended SAF cost adds parity with road but allows premium branding, sustaining yields.
By Shipment Weight: Light Parcels Dominate Amid E-Commerce Bias
Shipments under 5 kg delivered 58.10% market share of 2025 volumes, and dimensional billing motivates tighter packaging. The Europe courier express and parcel market share for light parcels slightly erodes as bulky furniture and appliances sold online lift heavy-weight CAGR to 4.40%. Locker apertures cap dimensions, so carriers invest in oversize hubs and two-man crews for premium white-glove services, diversifying revenue.
By Business Model: C2C Disruption Driven by Circular Economy Adoption
B2C retained 52.58% market share in 2025, yet C2C parcels climb 5.43% CAGR as platforms like Vinted feed the Europe courier express and parcel market with lightly used apparel and collectibles. InPost’s eight-country contract with Vinted illustrates tailored pickup, authentication, and dispute handling that conventional B2C networks lack.
C2C density is uneven, peaking near university cities and requiring route flexibility. Operators monetizing returns and quality checks gain stickiness. B2B steadies, but procurement pushes transparent tariffs, keeping margin thin.
By Mode of Transport: Air Freight Gains from Express Demand and SAF Mandates
Road kept 52.07% market share in 2025, but air moves fastest at 5.12% CAGR, fueled by biologics and expedited electronics. Driver scarcities and city diesel bans elevate air’s comparative reliability, while platform visibility mitigates cost shock. Multimodal rail gains where emissions pricing pushes shippers to low-carbon corridors, yet digital scheduling is required to manage modal handoffs.
Geography Analysis
Germany held 21.04% share in 2025 owing to its large consumer base and industrial backbone. Driver shortages and strict wage accords, however, weigh on margin. The Netherlands, supported by Rotterdam’s 15 million TEU gateway and 1 locker per 2,000 residents, grows 4.94% CAGR as zero-emission zones and digital customs make it Europe’s logistics laboratory.
France and the United Kingdom sustain scale but confront competition from technology-first entrants. Eastern Europe benefits from reshoring, with Poland attracting EUR 8 billion (USD 8.33 billion) of logistics real estate between 2020 and 2024, pushing parcel locker access to 64% of the population. Nordic consumers pay premiums for sustainable services, while Southern Europe accelerates through tourism recovery and cross-border purchasing.
Regulatory harmonization under ViDA lowers market entry barriers, enabling cross-border specialists to bypass legacy national posts. Compliance complexity still rewards scale, nudging fragmented southern markets toward consolidation around locker-centric operators able to amortize sovereign-cloud and cybersecurity investments.
Competitive Landscape
The Europe courier express and parcel (CEP) market features moderate concentration, with national posts guarding home turf and private carriers racing to build technology-enabled pan-European footprints. InPost moved 1 billion parcels in 2024 after spending PLN 1.8 billion (USD 434 million) on network expansion and acquiring Yodel and Sending to gain density in the United Kingdom and Spain.
DSV’s EUR 14.3 billion (USD 15.7 billion) purchase of DB Schenker in 2025 forms a EUR 39 billion (USD 40.62 billion) revenue logistics powerhouse able to offer integrated freight and parcel services.
Express specialists leverage SAF-compliant fleets to win environmentally minded corporates, while regionals differentiate via simplified tariffs that dodge volumetric penalties. Scale is now synonymous with data sophistication, locker density, and compliance bandwidth, rather than fleet size alone.
Europe Courier, Express, And Parcel (CEP) Industry Leaders
DHL Group
FedEx
International Distributions Services (including GLS)
La Poste Group
United Parcel Service of America, Inc. (UPS)
- *Disclaimer: Major Players sorted in no particular order


Recent Industry Developments
- July 2025: InPost closed the acquisition of Sending, reinforcing its Iberian footprint and widening service lines.
- April 2025: InPost gained a 95.5% stake in Yodel, creating the third-largest agnostic carrier in the United Kingdom.
- April 2025: DSV closed the EUR 14.3 billion (USD 15.78 billion) acquisition of DB Schenker, forming one of Europe’s largest integrated logistics providers.
- January 2025: InPost outlined a GBP 1 billion (USD 1.25 billion) United Kingdom investment through 2029 to deploy 10,000 lockers.


Europe Courier, Express, And Parcel (CEP) Market Report Scope
Domestic, International are covered as segments by Destination. Express, Non-Express are covered as segments by Speed Of Delivery. Business-to-Business (B2B), Business-to-Consumer (B2C), Consumer-to-Consumer (C2C) are covered as segments by Model. Heavy Weight Shipments, Light Weight Shipments, Medium Weight Shipments are covered as segments by Shipment Weight. Air, Road, Others are covered as segments by Mode Of Transport. E-Commerce, Financial Services (BFSI), Healthcare, Manufacturing, Primary Industry, Wholesale and Retail Trade (Offline), Others are covered as segments by End User Industry. Albania, Bulgaria, Croatia, Czech Republic, Denmark, Estonia, Finland, France, Germany, Hungary, Iceland, Italy, Latvia, Lithuania, Netherlands, Norway, Poland, Romania, Russia, Slovak Republic, Slovenia, Spain, Sweden, Switzerland, United Kingdom are covered as segments by Country.| Domestic |
| International |
| Express |
| Non-Express |
| Business-to-Business (B2B) |
| Business-to-Consumer (B2C) |
| Consumer-to-Consumer (C2C) |
| Heavy Weight Shipments |
| Light Weight Shipments |
| Medium Weight Shipments |
| Air |
| Road |
| Others |
| E-Commerce |
| Financial Services (BFSI) |
| Healthcare |
| Manufacturing |
| Primary Industry |
| Wholesale and Retail Trade (Offline) |
| Others |
| Albania |
| Bulgaria |
| Croatia |
| Czech Republic |
| Denmark |
| Estonia |
| Finland |
| France |
| Germany |
| Hungary |
| Iceland |
| Italy |
| Latvia |
| Lithuania |
| Netherlands |
| Norway |
| Poland |
| Romania |
| Russia |
| Slovak Republic |
| Slovenia |
| Spain |
| Sweden |
| Switzerland |
| United Kingdom |
| Rest of Europe |
| By Destination | Domestic |
| International | |
| By Speed of Delivery | Express |
| Non-Express | |
| By Business Model | Business-to-Business (B2B) |
| Business-to-Consumer (B2C) | |
| Consumer-to-Consumer (C2C) | |
| By Shipment Weight | Heavy Weight Shipments |
| Light Weight Shipments | |
| Medium Weight Shipments | |
| By Mode of Transport | Air |
| Road | |
| Others | |
| By End User Industry | E-Commerce |
| Financial Services (BFSI) | |
| Healthcare | |
| Manufacturing | |
| Primary Industry | |
| Wholesale and Retail Trade (Offline) | |
| Others | |
| By Country | Albania |
| Bulgaria | |
| Croatia | |
| Czech Republic | |
| Denmark | |
| Estonia | |
| Finland | |
| France | |
| Germany | |
| Hungary | |
| Iceland | |
| Italy | |
| Latvia | |
| Lithuania | |
| Netherlands | |
| Norway | |
| Poland | |
| Romania | |
| Russia | |
| Slovak Republic | |
| Slovenia | |
| Spain | |
| Sweden | |
| Switzerland | |
| United Kingdom | |
| Rest of Europe |


Market Definition
- Courier, Express, and Parcel - The Courier, Express, and Parcel services, often called as CEP Market, refers to the logistics and postal service providers which specialize in moving small goods (parcels/packages). It captures the overall market size (USD) and market volume (number of parcels) of (1) the shipments/parcels/packages which are under 70kgs/ 154lbs weight, (2) Business Customer packages viz. Business-to-Business (B2B) & Business-to-Consumer (B2C) as well as private customer packages (C2C), (3) non-express parcel delivery services (Standard and Deferred) as well as express parcel delivery services (Day-Definite-Express and Time-Definite-Express), (4) domestic as well as international shipments.
- Demographics - To analyse total addressable market demand, population growth & forecasts have been studied and presented in this industry trend. It represents population distribution across categories like gender (male/female), development area (urban/rural), major cities among other key parameters like population density and final consumption expenditure (growth and share % of GDP). This data has been used for assessing the fluctations in demand & consumption expenditure, and the major hotspots (cities) of potential demand.
- Domestic Courier Market - Domestic Courier Market refers to the CEP shipments wherein the origin and destination is within the boundary of the geography studied (country or region as per the scope of report). It captures the market size (USD) and market volume (number of parcels) of (1) the shipments/parcels/packages which are under 70kgs/ 154lbs weight, including light weight shipments, medium weight shipments and heavy weight shipments (2) Business Customer packages viz. Business-to-Business (B2B) & Business-to-Consumer (B2C) as well as private customer packages (C2C), (3) non-express parcel delivery services (Standard and Deferred) as well as express parcel delivery services (Day-Definite-Express and Time-Definite-Express).
- E-Commerce - This end user industry segment captures the external (outsourced) logistics expenditure incurred by the e-tailers, through online sales channel, on Courier, Express, and Parcel (CEP) services. The scope includes (i) the supply chain of a company's online customer orders being fulfilled, (ii) the process of getting a product from the point of manufacturing to the point at which it is delivered to consumers. It involves managing inventory (deferred as well as time critical), shipping, and distribution.
- Export Trends and Import Trends - Overall logistics performance of an economy is positively and significantly (statistically) correlated to its trade performance (exports and imports). Hence, in this industry trend, total value of trade, major commodities/ commodity groups and the major trade partners, for the studied geography (country or region as per the scope of report) have been analysed alongside the impact of major trade/logistics infrastructure investments & regulatory environment.
- Financial Services (BFSI) - This end user industry segment captures the external (outsourced) logistics expenditure incurred by the BFSI players, on Courier, Express, and Parcel (CEP) services. CEP is important to the financial services industry in shipping of confidential documents and files. The establishments in this sector are engaged in (i) financial transactions (that is, transactions involving the creation, liquidation, or change in ownership of financial assets) or in facilitating financial transactions, (ii) financial intermediation, (iii) the pooling of risk by underwriting annuities and insurance, (iv) providing specialized services that facilitate or support financial intermediation, insurance and employee benefit programs, and (v) monetary control - the monetary authorities.
- Fuel Price - Fuel price spikes can cause delays and diruption for logistics service providers (LSPs), while drops in the same can result in higher short-term profitability and increased market rivalry to offer consumers with the best deals. Hence, the fuel price variations have been studied over the review period and presented along with the causes as well as market impacts.
- GDP Distribution by Economic Activity - Nominal Gross Domestic Product and distribution of the same, across major economic sectors in the geography studied (country or region as per scope of the report) have been studied and presented in this industry trend. As GDP is positively related to the profitability and growth of logistics industry, this data has been used in adjunction to the input-output tables/ supply-use tables for analyzing the potential major contributing sectors towards the logistics demand.
- GDP Growth by Economic Activity - Growth of Nominal Gross Domestic Product across major economic sectors, for the geography studied (country or region as per scope of the report) have been presented in this industry trend. This data has been utilized for assessing the growth of logistics demand from all the market end users (economic sectors considered here).
- Healthcare - This end user industry segment captures the external (outsourced) logistics expenditure incurred by the Healthcare players (Hospitals, clinics, mrdical centres) , on Courier, Express, and Parcel (CEP) services. The scope includes CEP services involved in the defrerred as well time critical movement of medical goods & supplies (surgical supplies and instruments, including gloves, masks, syringes, equipment). The establishments in this sector (i) include the ones providing medical care exclusively (ii) deliver services by trained professionals (iii) involve processes, including labor inputs of health practitioners with the requisite expertise (iv) are defined based on the educational degree held by the practitioners included in the industry.
- Inflation - Variations in both Wholesale Price Inflation (YoY change in producer price index) and Consumer Price Inflation have been presented in this industry trend. This data has been used to assess the inflationary environment as it plays a vital role in smooth functioning of the supply chain, directly impacting the logistics operational cost components e.g., pricing of tyres, driver wages & benefits, energy/fuel prices, maintenace costs, toll charges, warehousing rents, custom brokerage, forwarding rates, courier rates etc. hence impacting the overall freight and logistics market.
- Infrastructure - As infrastructure plays a vital role in an economy's logistics performance, variables like length of roads, distribution of road length by surface category (paved v/s unpaved), distribution of road length by road classification (expressways v/s highways v/s other roads), rail length, volume of containers handled by major ports and tonnage handled by major airports have been analysed and presented in this industry trend.
- International Express Service Market - International Express Service Market refers to the CEP shipments wherein the origin or destination is not within the boundary of the geography studied (country or region as per the scope of report). It captures the market size (USD) and market volume (number of parcels) of (1) the shipments/parcels/packages which are under 70kgs/ 154lbs weight, including light weight shipments, medium weight shipments and heavy weight shipments (ii) Inter-Region as well as Intra-Region Shipments
- Key Industry Trends - The report section named "Key Industry Trends" include all the key variables/parameters studied to better analyze the market size estimates and forecasts. All the trends have been presented in the form of data points (time series or latest available data points) along with analysis of the paramter in the form of concise market relevant commentary, for the geography studied (country or region as per the scope of report).
- Key Strategic Moves - The action taken by a company to differentiate from its competitor or used as a general strategy is referred to as a key strategic move (KSM). This includes (1) Agreements (2) Expansions (3) Financial Restructuring (4) Mergers and Acquisitions (5) Partnerships, and (6) Product Innovations. Key players (Logistics Service Providers, LSPs) in the market have been shortlisted, their KSM have been studied and presented in this section.
- Logistics Performance - Logistics Performance and Logistics Costs are the backbone of trade, and influences trade costs, making countries compete globally. Logistics performance is influenced by market wide adopted supply chain management strategies, government services, investments & policies, fuel/ energy costs, inflationary environment etc. Hence, in this industry trend, the logistics performance of the geography studied (country/ region as per the scope of report) has been analysed and presented over the review period.
- Manufacturing - This end user industry segment captures the external (outsourced) logistics expenditure incurred by the Manufacturing industry (including Hi-Tech/Technology) players, on Courier, Express, and Parcel (CEP) services. The end user players considered are the establishments primarily engaged in the chemical, mechanical or physical transformation of materials or substances into new products. Logistics Service Providers (LSPs) play a crucial role in maintaining a smooth flow of raw materials across the supply chain, enabling timely delivery of finished goods to distributors or end customers and storing & supplying the raw materials to clients for just-in-time manufacturing.
- Other End Users - Other end user segment captures the external (outsourced) logistics expenditure incurred by the construction, real estate, educational services, and professional services (administrative, waste management, legal, architectural, engineering, design, consulting, scientific R&D), on Courier, Express, and Parcel (CEP) services. Logistics Service Providers (LSPs) plays a crucial role in the reliable movement of time critical supplies and documents to/from these industries such as transporting any equipment or resources required, shipping confidential documents and files.
- Primary Industry - This end user industry segment captures the external (outsourced) logistics expenditure incurred by the AFF (Agriculture, Fishing, and Forestry) and Extraction indsutry (Oil &Gas, Quarrying and Mining) players, on Courier, Express, and Parcel (CEP) services. The end user players considered are the establishments (i) primarily engaged in growing crops, raising animals, harvesting timber, harvesting fish & other animals from their natural habitats and providing related support activities; (ii) that extract naturally occurring mineral solids, such as coal and ores; liquid minerals, such as crude petroleum; and gases, such as natural gas. Herein, Logistics Service Providers (LSPs) (i) play a crucial role in acquisition, storage, handling, transportation, and distribution activities for the optimal & continuous flow of inputs (seeds, pesticides, fertilizers, equipment, and water) from manufacturers or suppliers to the producers and smooth flow of output (produce, agro-goods) to distributors/ consumers; (ii) cover entire phases from upstream to downstream and play a crucial role in the transportation of machinery, drilling equipments, extracted minerals, crude oil & natural gas and refined/ processed products from one place to another. This includes both termperature controlled and non-temperature controlled logistics, as and when required according to the shelf life of goods being transported or stored.
- Producer Price Inflation - It indicates inflation from viewpoint of the producers viz. the average selling price received for their output over a period of time. Annual change (YoY) of producer price index is reported as wholesale price inflation in the "Inflation" industry trend. As WPI captures dynamic price movements in most comprehensive way, it is widely used by governments, banks, industry, business circles and is deemed important in formulation of trade, fiscal and other economic policies. The data has been used in adjunction to consumer price inflation for better understanding the inflationary environment.
- Segmental Revenue - Segmental Revenue has been triangulated or computed and presented for all the major players in the market. It refers to the courier, express, and parcel (CEP) market specific revenue earned by the company, over the base year of study, in the geography studied (country or region as per the scope of report). It is computed through the study and analysis of major parameters like financials, service portfolio, employee strength, fleet size, investments, number of countries present in, major economies of concern, etc. that have been reported by the company in its annual reports, webpage. For companies having scarce financial disclosures, paid databases like D&B Hoovers, Dow Jones Factiva have been resorted to and verified through industry/expert interactions.
- Transport and Storage Sector GDP - Value and growth of Transport and Storage Sector GDP has a direct relation to the freight and logistics market size. Hence, this variable has been studied and presented over the review period, in value terms (USD) and as share % of total GDP, in this industry trend. The data has been supported by concise and relevant commentary around the investments, developments, and current market scenario.
- Trends in E-Commerce Industry - Enhanced internet connectivity and boom in smartphone penetration, coupled with increasing disposable incomes, has led to a phenomenal growth in the e-commerce market globally. Online shoppers require fast and efficient delivery of their orders leading to an increase in the demand for logistics services especially e-commerce fulfilment services. Hence, the Gross Merchandise Value (GMV), historial and projected growth, breakup of major commodity groups in e-commerce industry for the studied geography (country or region as per scope of the report) have been analysed and presented in this industry trend.
- Trends in Manufacturing Industry - Manufacturing industry involves the transformation of raw materials into finished products, while logistics industry ensures the efficient flow of raw materials to the factory, and the transport of manufactured products to the distributors & consumers. Demand-Supply of both industries are highly cross-linked and critical for a seamless supply chain. Hence, the Gross Value Added (GVA), breakup of GVA into major manufacturing sectors, and growth of manufacturing industry over the review period have been analysed and presented, in this industry trend.
- Wholesale and Retail Trade (Offline) - This end user industry segment captures the external (outsourced) logistics expenditure incurred by the wholesalers and retailers, through offline sales channel, on Courier, Express, and Parcel (CEP) services. The end user players considered are the establishments primarily engaged in wholesaling or retailing merchandise, generally without transformation, and rendering services incidental to the sale of merchandise. Logistics Service Providers (LSPs) plays a crucial role in the reliable movement of supplies to and finished products from production houses to the distributors and finally to the end customer covering activites like material sourcing, transportation, order fulfillment, warehousing & storage, demand forecasting, inventory management etc.
| Keyword | Definition |
|---|---|
| Axle Load | The axle load refers to the total load (weight) bearing on the roadway through wheels connected to a given axle. Across the globe, there are systems in place to ensure axle load monitoring, wherein surpassing the defined limits set by the concerned regulatory authority can lead to penalty/fine. For transportation of goods via road this can be an important determinant of costs as knowledge about the axle load limits can be used to (i) load the vehicle optimally for maximizing profits (ii) avoid exceeding the same and hence the probable fines associated (iii) avoid wear and tear of the vehicle (iv) avoid damage to pavement resulting in noticeable public maintenance and repair costs (v) achieve better turnaround time. |
| Back Haul | Backhaul is the return movement of a transport vehicle from its original destination to its original point of departure, and can include full, partial, or empty truck loads (all or part of the way) depending on the visibility of the local freight ecosystem. In this regard, transportation of empty containers to the point of origin, known as deadheading is also a significant factor, considering the supply/container shortages across the geographies, resulting in cost escalation and under optimized profit potential attainment. Generally, the carriers offer discounts on the backhaul, to secure freight for the trip. |
| Bill of Lading (BOL) | A bill of lading is a legal contract document issued by a carrier to a shipper to acknowledge reception of their cargo, and is evidence for the contract of carriage between the two parties. Broadly it details the (i) type, quantity, and other specifications of the goods being carried (ii) destination, and terms & conditions of the shipment (iii) carrier and drivers with all the necessary information to process the shipment, which can be used for insurance and customs clearance purposes (iv) assurance that the consignment is damage-free and ready to be shipped to the consignee. In this regard, a house bill of lading (HBL) is a document issued by a freight forwarder or a non-vessel operating common carrier (NVOCC) to acknowledge receipt of items for shipment (to a shipper). If shipments from several shippers are involved a master bill of lading (MBL) might be involved which is a consolidated version of the same for all the shipments being taken care of by the carrier (to a common destination) and might be issued by the carrier to the freight forwarder or the shipper (depending on who books the transport). |
| Bunkering | Bunkering is the process of supplying fuel to power the propulsion system of a ship. It includes the logistics of loading and distributing the fuel among available shipboard tanks. In this regard, (i) Bunker fuel is technically any type of fuel oil used aboard ships. It gets its name from the containers on ships and in ports that it is stored in; in the days of steam they were coal bunkers but now they are bunker-fuel tanks, (ii) Bunker refers to the spaces (Tank) on board a vessel to store fuel, (iii) Bunker trader refers to a person dealing in trade of bunker (fuel), (iv) Bunker call is made when a cargo ship anchors or berths in a port to take on bunker oil or supplies, (v) Bunkering service is the supply of a requested quality and quantity of bunkers to a ship. Bunkering is signficant from point of view of freight rates applicable to the shipper as Bunker Contribution (BUC)/ Fuel Adjustment Factor (FAF)/ Bunker Adjustment Factor (BAF) are applied by shipping lines to offset the effect of fluctuations in the cost of bunkers. |
| Cabotage | Transport by a vehicle registered in a country, performed on the national territory of another country. Cabotage law may restrict domestic cargo traffic to be carried in its own nationally registered, and sometimes built and crewed vehicles, though regulations vary across industries/commodity groups/countries and sometimes specify maximum allowable percentage of cabotage that can be serviced by foreign registered fleet. |
| C-commerce | Collaborative commerce (also known as C-commerce), (i) describes electronically enabled business interactions among an enterprise’s internal personnel, business partners and customers throughout a trading community (industry, industry segment, supply chain or supply chain segment); (ii) is the optimization of supply and distribution channels to capitalize on the global economy by using new technology efficiently. Advantages of C-commerce, to detail few include (i) maximization of organization's efficiency and profitability (ii) technology integration with physical channels to allow companies to work together (iii) increased information exchange such as inventory and product specifications, using the web as an intermediary (iv) increased competitiveness by reaching a broader audience. Examples of C-commerce, also known as peer-to-peer commerce, include (i) companies that allow consumers to rent things from each other, or marketplaces, such as Meta (formerly Facebook) Marketplace, that allow the sale of used goods; (ii) DoorDash teamed up with many national brands, such as McDonald’s and Chipotle, to offer fast food delivery, building their business model on c-commerce. They have since expanded their delivery service from restaurants to retailers and even offer 'fleets' of drivers to businesses. |
| Courier | A business/company that delivers packages/parcels/shipments (upto 70 kgs) including quick door to door pickup and delivery service for goods or documents, domestically or internationally, on a commercial contract basis. Example, DHL Group, FedEx, United Parcel Service of America, Inc., USPS, International Distributions Services, J&T Express, SF Express among several others |
| Cross docking | Cross docking is a practice in logistics management that includes unloading incoming delivery vehicles and loading the materials directly into outbound delivery vehicles, omitting traditional warehouse logistical practices and saving time and money. It requires close synchronization of both inbound and outbound movements. It is highly significant in reduction of costs pertaining to warehousing & storage (and the associated Value Added Services). |
| Cross Trade | International transport between two different countries performed by a vehicle registered in a third country. A third country is a country other than the country of loading/embarkation and the country of unloading/disembarkation. Cross Trade law may restrict international cargo traffic to be carried by respective country's registered vehicles, and sometimes built and crewed vehicles, though regulations vary across industries/commodity groups/countries and sometimes specify maximum allowable percentage of cross trade that can be serviced by foreign registered fleet. |
| Customs Clearance | The process of declaring and clearing cargoes through customs. It includes the procedures involved in getting cargo released by Customs through designated formalities such as presenting import license/permit, payment of import duties and other required documentations by the nature of the cargo. In this regard, a customs broker is a person or company licensed by the respective department of the country to act on behalf of freight importers and exporters. |
| Dangerous Goods | Dangerous goods (or hazardous materials or HAZMAT) include flammable liquids/solids, gases (compressed, liquified, dissolved under pressure), corrosives, oxidising substances, explosive substances and articles, substances which on contact with water emit flammable gasses, organic peroxides, toxic substances, infectious substances, radioactive materials, miscellaneous dangerous goods and articles. |
| First mile Delivery | First mile delivery refers to the (i) first stage of the freight/shipment/cargo/courier transportation (ii) the transportation of goods from a merchant’s premises or warehouse to the next fulfillment centre/warehouse/hub from where the goods are forwarded (iii) shipping goods from local distribution centers to stores (For retailers) (iv) transportation of finished goods from a plant or a factory to a distribution center (For manufacturers), (v) pick up of goods from the end-customer’s home or store followed by movement to a warehouse or storage location (movers and packers), (vi) process where goods are picked up from a retailer and then transferred to third-party logistics providers or courier service providers to be delivered to the end-consumer (e-commerce). Once the package reaches the next warehouse or the courier’s hub, it is then sorted and transported further until it reaches the customer’s doorstep. Example, if one chooses UPS as a courier, first-mile delivery will be the product being delivered from manufacturer's/retailer's warehouse to the UPS’s warehouse/ fulfilment centre. |
| Last Mile Delivery | Last mile delivery refers to the very last step of the delivery process when a parcel is moved from a transportation hub (warehouse or a distribution center or fulfillment centre) to its final destination, which usually is a personal residence/retail store/ business, or parcel locker. It accounts for around half of the total cost involved in entire process of first mile, middle mile, and last mile delivery, though it can vary shipment to shipment, based on commodity, business model and similar factors. |
| Milkrun | A Milk Run is a delivery method used to transport mixed loads from various suppliers to one customer, using lean management principles applied to logistics. Instead of each supplier sending a truck every week to meet the needs of one customer, one truck (or vehicle) visits the suppliers to pick up the loads for that customer. This method of transport got its name from the dairy industry practice, where one tanker used to collect milk from several dairy farms for delivery to a milk processing company. A milk run can be a more efficient way to handle logistics but require proper planning. If the route involves products from different companies, there is need for an agreement about cost-sharing and other aspects of the cooperative delivery arrangement. Once the group settles these issues, this delivery method can save time and money for everyone by pooling operation costs and resources. |
| Multi country consolidation | Multi-Country Consolidation (MCC) is a cost-effective solution that consolidates one's cargo from different countries of origin to build Full Container Loads (FCL). MCC is most suitable for companies that import light volumes of goods from multiple countries but want to take advantage of the more economic FCL freight rates. Apart from costing some of the other advantages include (i) flexibility to choose suppliers from a wider range of origin countries without worrying about the logistics to final destination from each origin, (ii) ability to pick the most suitable suppliers from many different countries for one's business operations. The increase in one's sourcing options by MCC provides the kind of flexibility needed in competitive global markets. |
| Q-commerce | Q-commerce, also referred to as quick commerce, is a type of e-commerce where emphasis is on quick deliveries, typically in less than an hour. The companies providing Q-Commerce services might have vertically intergrated model or might be using third party delivery platforms (outsourced logistics). It has advantages like (i) competitve USP, (ii) potential to earn greater profit margins, (iii) better customer experience, (iv) guaranteed availability of products, (v) traceability, and (vi) scaleability. |
| ReverseLogistics | Reverse logistics is a type of supply chain management that moves goods from customers back to the sellers or manufacturers and may involve ciruclar economy principles (3Rs) viz. recycling, reuse (repurposing, reselling), reducing or repairing. In this regard, reverse commerce (or Recommerce) is the selling of previously owned items through physical or online marketplaces/distribution channels to buyers who reuse, recycle or resell them. |


Research Methodology
Mordor Intelligence follows a four-step methodology in all our reports.
- Step-1: Identify Key Variables: In order to build a robust forecasting methodology, the variables and factors identified in Step-1 are tested against available historical market numbers. Through an iterative process, the variables required for market forecast are set and the model is built on the basis of these variables.
- Step-2: Build a Market Model: Market-size estimations for the forecast years are in nominal terms. Inflation is considered to be a part of the pricing, and the average selling price (ASP) is varying throughout the forecast period for each country
- Step-3: Validate and Finalize: In this important step, all market numbers, variables and analyst calls are validated through an extensive network of primary research experts from the market studied. The respondents are selected across levels and functions to generate a holistic picture of the market studied.
- Step-4: Research Outputs: Syndicated Reports, Custom Consulting Assignments, Databases & Subscription Platforms


