GCC Courier, Express, and Parcel (CEP) Market Size and Share
Market Overview
| Study Period | 2018 - 2031 |
|---|---|
| Forecast Data Period | 2026 - 2031 |
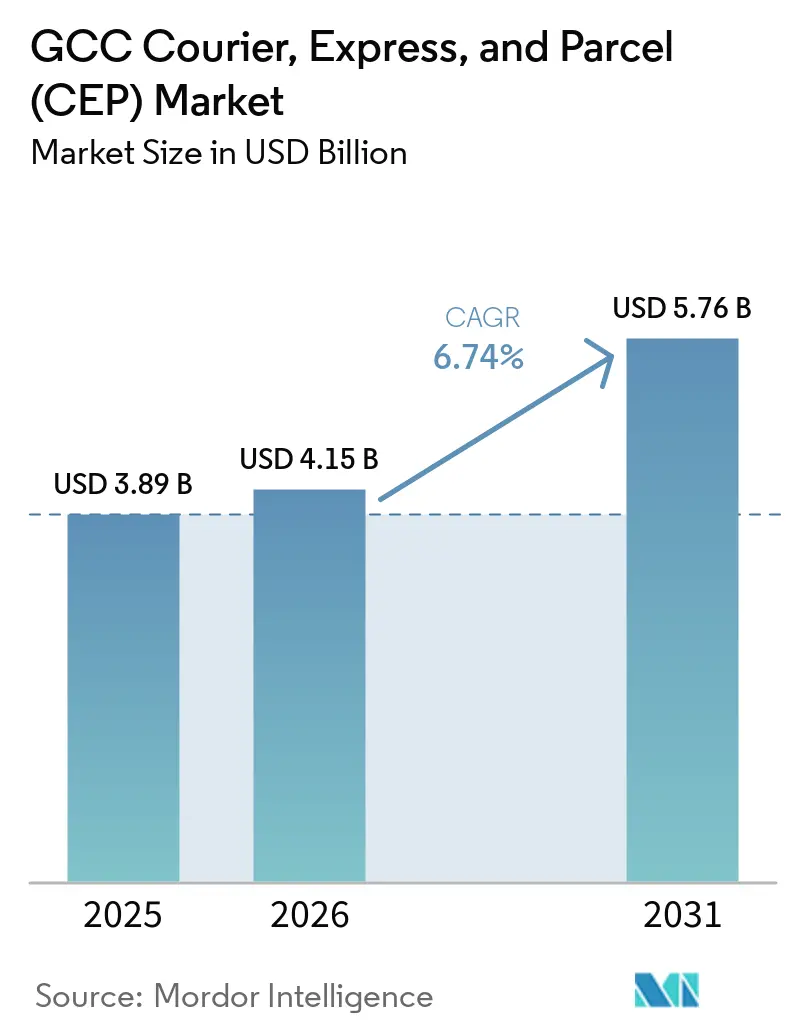
| Base Year Market Size (2025) | USD 3.89 Billion |
| Market Size (2026) | USD 4.15 Billion |
| Market Size (2031) | USD 5.76 Billion |
| Growth Rate (2026 - 2031) | 6.74% CAGR |
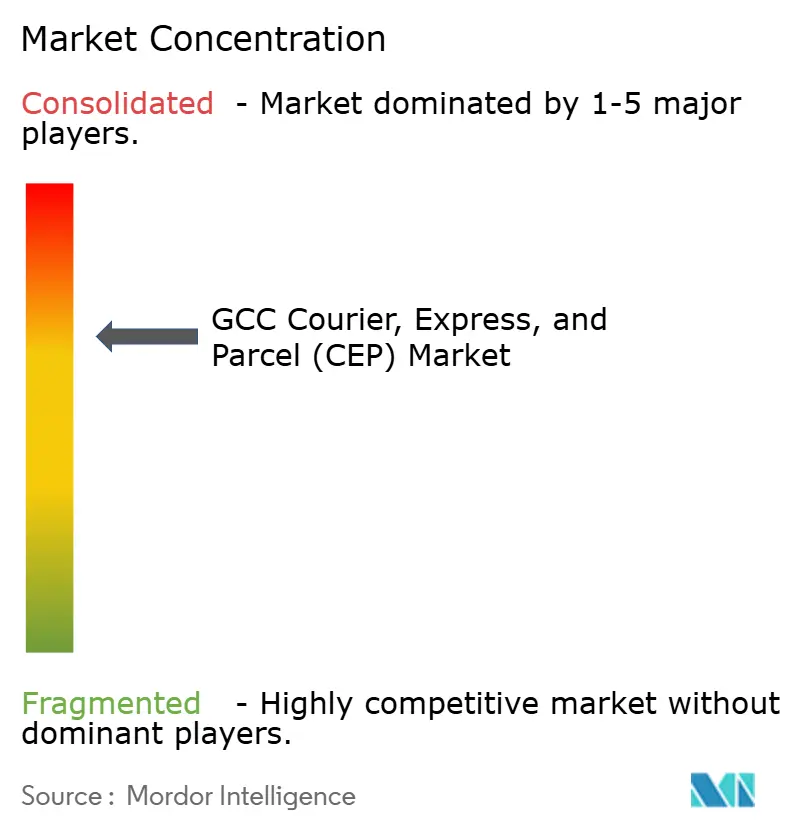
| Market Concentration | Medium |
Major Players
*Disclaimer: Major Players sorted in no particular order Image © Mordor Intelligence. Reuse requires attribution under CC BY 4.0. |
|
GCC Courier, Express, and Parcel (CEP) Market Analysis by Mordor Intelligence
The GCC courier, express, and parcel market size in 2026 is estimated at USD 4.15 billion, growing from 2025 value of USD 3.89 billion with 2031 projections showing USD 5.76 billion, growing at 6.74% CAGR over 2026-2031.
The GCC courier, express, and parcel market size trajectory underscores the region’s evolution into a vital global logistics gateway within the broader GCC freight and logistics market. Explosive e-commerce adoption, deepening cross-border trade ties, and multimodal infrastructure programs are combining to lift shipment volumes, diversify revenue streams, and compress service lead times. International volumes are expanding fastest as harmonized customs procedures cut clearance times, while same-day and on-demand delivery networks intensify competitive benchmarking around service speed and urban density economics. Modal diversification toward road transport is gathering pace, yet air cargo still anchors high-value time-definite traffic, exposing operators to fuel-price swings and geopolitical reroutings. Government-backed logistics parks, bonded zones, and digital single-window platforms continue to unlock scale, enabling operators to automate hubs, expand temperature-controlled capacity, and court specialized verticals such as healthcare and high-tech manufacturing.
Key Report Takeaways
- By destination, domestic shipments held 64.81% of GCC courier, express, and parcel market share in 2025, while international parcels are advancing at a 7.22% CAGR between 2026-2031.
- By speed of delivery, express services captured 33.20% of the GCC courier, express, and parcel market size in 2025 and are expanding at an 7.74% CAGR between 2026-2031.
- By model, business-to-consumer (B2C) accounted for 57.98% of 2025 value; consumer-to-consumer (C2C) is forecast to post the quickest 3.55% CAGR between 2026-2031.
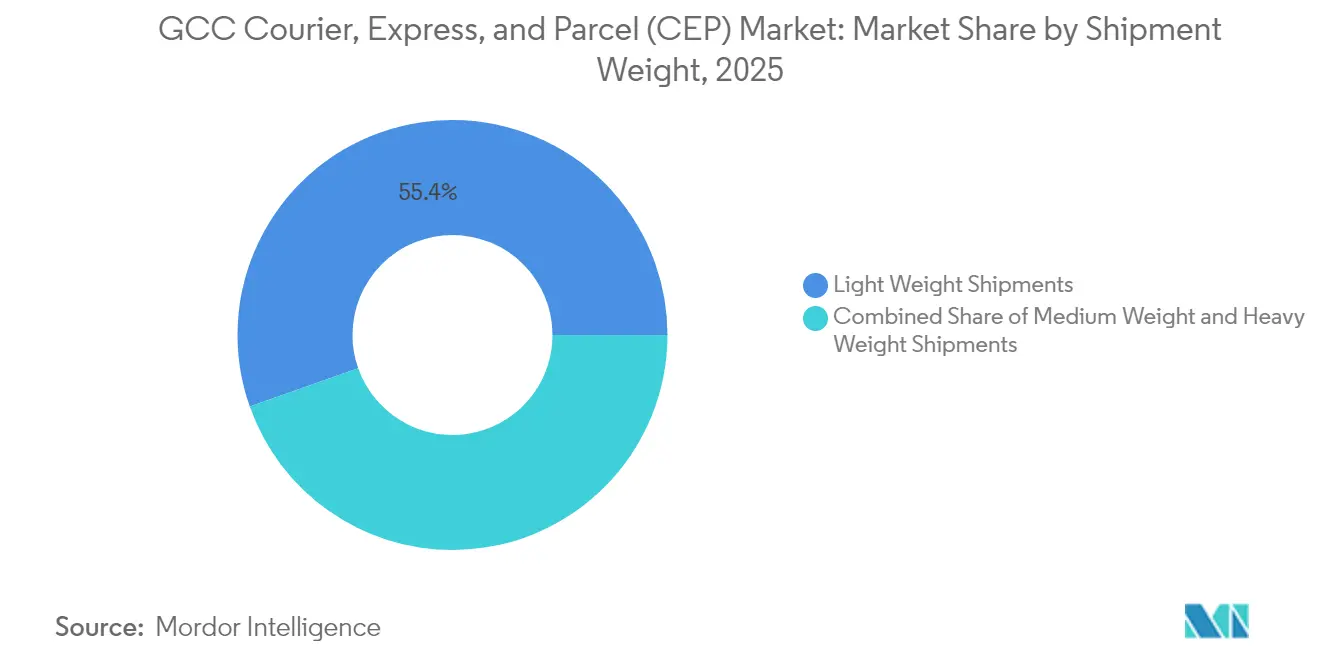
- By shipment weight, light weight parcels represented 55.40% of consignments in 2025, whereas heavy weight parcels are on track for a 6.10% CAGR between 2026-2031.
- By mode of transport, road freight is set to record a 7.05% CAGR between 2026-2031, outpacing the traditionally dominant air segment with 41.88% share of revenue in 2025.
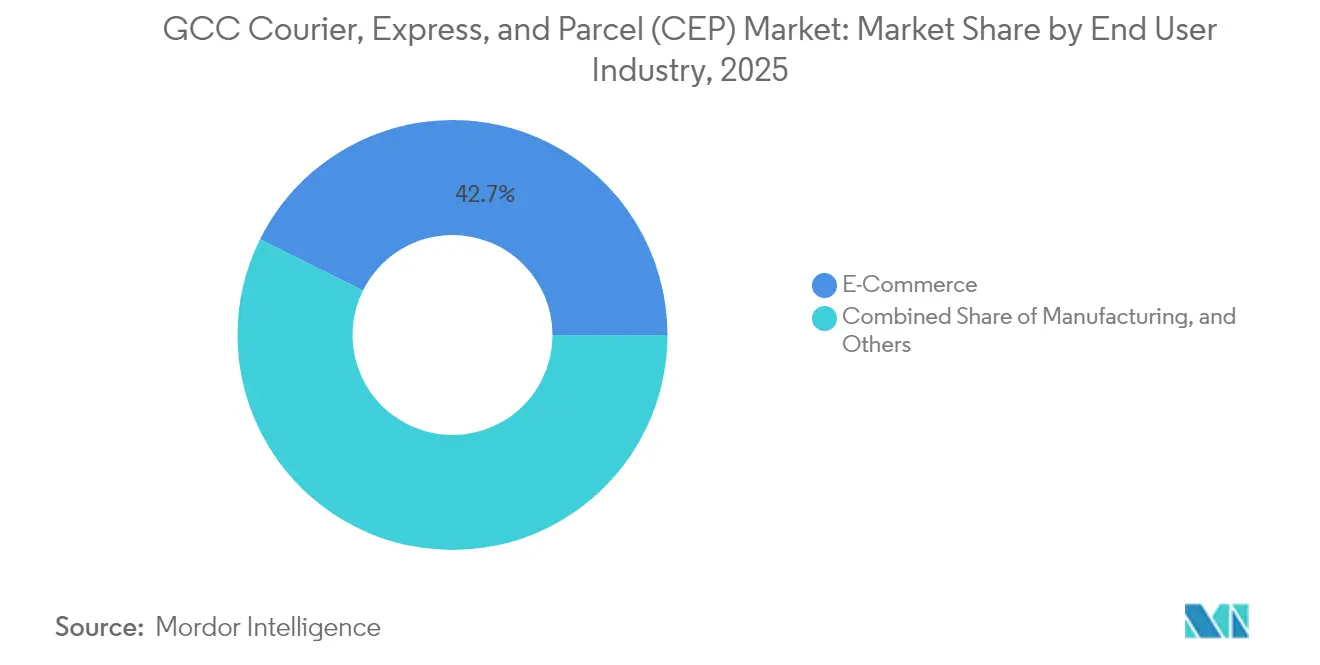
- By end user industry, healthcare logistics is projected to grow at a 7.29% CAGR between 2026-2031, challenging e-commerce’s 42.65% share in 2025 for future primacy.
- By geography, Saudi Arabia led with 34.92% revenue in 2025; the United Arab Emirates is poised for the fastest 7.62% CAGR between 2026-2031.
Note: Market size and forecast figures in this report are generated using Mordor Intelligence’s proprietary estimation framework, updated with the latest available data and insights as of 2026.
GCC Courier, Express, and Parcel (CEP) Market Trends and Insights
Drivers Impact Analysis*
| Driver | (~) % Impact on CAGR Forecast | Geographic Relevance | Impact Timeline |
|---|---|---|---|
| Rapid e-commerce uptake | +2.1% | UAE and Saudi Arabia at the core | Medium term (2-4 years) |
| Government-funded logistics infrastructure | +1.8% | Kingdom-centric with UAE and Qatar spillover | Long term (≥ 4 years) |
| On-demand same-day service proliferation | +1.4% | Major urban clusters across GCC | Short term (≤ 2 years) |
| Duty-paid cross-border e-commerce programs | +0.9% | GCC-wide, led by the UAE-Saudi corridor | Medium term (2-4 years) |
| Autonomous and robotic last-mile pilots | +0.6% | Early rollouts in UAE and Saudi Arabia | Long term (≥ 4 years) |
| Fulfillment-as-a-service models | +0.5% | Aviation hubs in UAE and Qatar | Medium term (2-4 years) |
| Source: Mordor Intelligence | |||


Rapid E-Commerce Uptake Across GCC
Accelerating digital retail adoption is reshaping shipment profiles, with B2C parcels already representing 58.55% of 2024 volume. Harmonized tariff codes and single-window customs portals are trimming clearance cycles and raising consumer confidence in cross-border purchases. Operators are embedding AI-enabled route planning and demand forecasting to cut delivery cost per stop, while malls and airlines unlock latent real estate by offering pay-as-you-go fulfillment capacity. The result is a denser last-mile network, growing repeat purchase frequency, and heightened pressure to guarantee sub-24-hour delivery windows[1]“Supreme Council 45th-Session Final Statement,” Gulf Cooperation Council Secretariat, gcc-sg.org.
Large-Scale Government Logistics Investment
National infrastructure blueprints ring-fence multibillion-dollar allocations for bonded zones, smart gates, and inland ports. Saudi Arabia’s USD 133.3 billion program funds multimodal corridors that connect industrial clusters with export gateways, while the UAE expands digital free zones to expedite e-commerce clearances. These public-sector injections lower throughput constraints, attract third-party logistics providers, and anchor foreign direct investment in warehouse automation and cold-chain fleets[2]“Unified Customs Tariff Implementation Update,” Gulf Cooperation Council Secretariat, gcc-sg.org.
Surge in On-Demand and Same-Day Delivery
Urban consumers are redefining “standard” service toward four-hour windows, catalyzing a wave of micro-fulfillment center build-outs. Ride-hailing and crowdsourced driver networks flex capacity during festival peaks, and dynamic pricing models spread demand across off-peak slots. Combined, these levers lift average daily stops per courier, reducing unit economics drag amid rising wages.
Duty-Paid Cross-Border Programs
Unified declaration formats and pre-arrival data interchange shave hours off border dwell time. Fixed-fee thresholds for low-value goods encourage SMEs to ship small consignments more frequently, lifting international parcel counts without proportionate compliance overhead. The policy tailwind dovetails with imminent free-trade accords that promise accelerated merchandise flows.
Restraints Impact Analysis*
| Restraint | (~) % Impact on CAGR Forecast | Geographic Relevance | Impact Timeline |
|---|---|---|---|
| Elevated last-mile cost structure | -1.2% | Region-wide, acute outside tier-1 cities | Short term (≤ 2 years) |
| Peak-season labor and capacity shortages | -0.8% | Saudi Arabia and UAE metro areas | Short term (≤ 2 years) |
| Restrictive drone-delivery regulation | -0.6% | UAE and Saudi Arabia, Qatar spillover | Medium term (2-4 years) |
| Non-standardized addressing | -0.4% | Saudi Arabia and smaller GCC states | Long term (≥ 4 years) |
| Source: Mordor Intelligence | |||
Persistently High Last-Mile Costs
Low address density beyond core metros forces longer routes, smaller drop clusters, and higher fuel burn per parcel. Escalating driver wages and vehicle compliance fees further compress margins, prompting operators to pool deliveries or deploy parcel lockers to limit doorstep runs[3]“2024 Cargo Throughput Results,” Dubai Airports, dubaiairports.ae.
Peak-Season Labor Bottlenecks
Ramadan, Eid, and year-end promotions can double daily volumes, yet temporary labor pools remain shallow. Surging demand for vans, sorting space, and cold-chain slots inflates spot-market rates, and under-utilized standby capacity weighs on annual margins[4]"UK-GCC free trade deal nears finish line, promises $10.8b boost to two-way trade." Gulf News, gulfnews.com.
*Our forecasts treat driver/restraint impacts as directional, not additive. The impact forecasts reflect baseline growth, mix effects, and variable interactions.
Segment Analysis
By End User Industry: E-Commerce Leadership Meets Healthcare Surge
E-commerce is the undisputed volume engine, accounting for 42.65% of 2025 demand. Flash-sale peaks align with regional shopping festivals, stressing network resilience yet offering lucrative surcharge opportunities. Return-rate mitigation has sparked investments in AI-driven fraud detection, smart packaging that reduces damage, and doorstep try-on services. Meanwhile, healthcare’s 7.29% CAGR between 2026-2031 is capturing board-level attention. Pharma majors are mandating GDP-certified routes, redundant cold-room inventories, and end-to-end temperature telemetry. DHL’s multi-billion-dollar commitment to life-science facilities adds credibility and sets new compliance benchmarks.
Primary industry and wholesale trade lanes continue to underpin heavyweight and palletized flows, benefiting from integrated multimodal solutions. Financial services rely on document and card dispatches, yet the digital switchover tempers future growth. Manufacturing’s just-in-sequence replenishment models require synchronized pick-up windows and zero-defect delivery, encouraging carriers to deploy control-tower analytics that flag variance in real-time.


By Destination: International Growth Gains Pace
International parcels are growing at a 7.22% CAGR between 2026-2031, outstripping domestic routes that nonetheless command 64.81% revenue share in 2025. Harmonized duty-paid frameworks and near-shoring of inventory into bonded fulfillment centers unlock faster clearances, turning the GCC courier, express, and parcel market into a pivotal bridge between Asian exporters and African consumers. Operators channel capital into cross-border e-hubs at Jebel Ali and King Salman Park, co-locating customs, sortation, and value-added services to compress transit times. Blockchain-anchored document flows and API-integrated tariff engines are trimming error-prone manual data entry, supporting the continued growth of the GCC international express service industry. Although domestic routes benefit from proximity and simplified documentation, their profitability hinges on conquering last-mile density hurdles that continue to suppress margins beyond tier-1 cities.
Local businesses prize domestic networks for predictable overnight coverage, yet shoppers are widening their horizons, lured by international marketplace assortments and falling landed-cost uncertainty. The GCC courier, express, and parcel market size tied to international lanes will accelerate as free-trade pacts mature and operators bundle ancillary services such as returns consolidation and duty-refund processing. In tandem, SMEs leverage cross-border dropshipping to test new markets without stocking inventory abroad, swelling small-parcel counts. Domestic incumbents respond by layering loyalty programs and subscription models to defend share, but the geographic rebalancing is unmistakable.
By Speed of Delivery: Express Services Gather Steam
Express consignments account for 33.20% of 2025 traffic yet generate outsize revenue thanks to premium tariffs. Same-day guarantees and next-flight-out options are now table stakes for electronics, fashion drops, and urgent spare-parts shipments. Healthcare and cold-chain verticals are especially rate-insensitive, requiring validated packaging, GDP-certified handling, and continuous temperature logging. Consequently, the express sub-segment’s 7.74% CAGR between 2026-2031 is pivotal to margin expansion across the GCC courier, express, and parcel market. Investments in high-throughput sorters capable of handling 20,000 parcels per hour and AI-driven hub scheduling shrink cut-off times and boost asset utilization.
Non-express traffic, while slower growing, still forms the value backbone with 66.80% share in 2025. Deferred services ride on cost-optimized line-haul runs and shared network infrastructure, ensuring fill factors that dilute fixed costs. To safeguard income as shippers trade up, non-express operators are revamping service portfolios with delivery-time guarantees and milestone visibility that blur the line between the two categories. Yet the gap in transfer pricing persists, sustaining robust yield differentials for express operators who can compress handover-to-delivery cycles without compromising reliability.
By Shipment Weight: Light Parcels Reign but Heavy Parcels Accelerate
Light parcels drive frequent small-ticket orders, representing 55.40% of revenue in 2025. Sophisticated dimension-weight pricing and automated volumetric scanners optimize revenue yield. Split-shipment strategies by e-retailers elevate light-parcel counts, necessitating rapid induction and sortation capabilities across hub networks. On the other end, heavy parcels are advancing at a 6.10% CAGR between 2026-2031, boosted by project cargo, medical equipment, and B2B e-procurement of white goods.
Medium parcels hold steady as the GCC courier, express, and parcel market share for furniture flat-packs and multi-SKU orders. To control handling costs, carriers deploy telescopic conveyors, mezzanine lifts, and ergonomically designed sort lanes. Specialized crews manage bulkier freight, adding installation or room-of-choice services that deepen revenue per stop. The cross-training of staff and modular fleet design spanning panel vans to 16-ton trucks ensure seamless scaling across weight bands without idle capacity spikes.
By Mode of Transport: Air Dominance Faces Road-Freight Renaissance
Air cargo underpins 41.88% of 2025 value, leveraging mega-hub connectivity at Dubai International, Doha’s Hamad International, and Riyadh’s King Khalid airports. High-frequency wide-body bellyhold capacity supports overnight lanes to Europe and Asia, keeping express lead times intact. Volatility in jet-fuel prices and conflict-related airspace re-routing, however, spur shippers to diversify toward road corridors now stitched together by upgraded border posts and unified GCC transit documents. Road’s 7.05% CAGR between 2026-2031 rides on improved hinterland highways, GPS-based e-tolling, and bonded trucking agreements that allow sealed trailers to transit multiple states with a single manifest.
Rail and sea remain niche, but pilot block-train services between Dammam and Jebel Ali hint at future intermodal options that could extend the GCC courier, express, and parcel market size into heavier parcel categories. Operators bundle customs brokerage, line-haul tracking, and final-mile handoffs into single service-level agreements, shielding shippers from modal complexity.
By Model: B2C Commands Center Stage
B2C parcels, at 57.98% share in 2025, are the lifeblood of the GCC courier, express, and parcel market. Marketplace holidays and flash-sale festivals lift daily parcel counts into the millions, requiring elastic route planning and customer-friendly rescheduling tools. Payment-on-delivery and easy returns remain popular across Saudi Arabia and Kuwait, compelling operators to develop cash-handling competencies and reverse logistics nodes. C2C flows are climbing modestly as preloved fashion and peer-to-peer gifting apps gain users with an estimated growth of 3.55% CAGR between 2026-2031. Meanwhile, B2B volumes persist in sectors such as automotive aftermarket and industrial MRO, where scheduled replenishment dominates.
The GCC courier, express, and parcel market size attributed to B2C is expected to keep widening as new cohorts of digital-native shoppers enter the workforce. Retailers are experimenting with ship-from-store models that slash delivery radii, converting brick-and-mortar outlets into micro-distribution nodes. Couriers are co-locating lockers in metro stations and community centers, capturing failed first-attempt deliveries while enhancing convenience. High expectations around real-time tracking and proactive delay notifications are pushing carriers to weave IoT sensors and cloud analytics into every leg of the journey.
Geography Analysis
Saudi Arabia dominates 2025’s revenue landscape with 34.92%, bolstered by a burgeoning middle class, sprawling geography, and USD 133.3 billion earmarked for multimodal corridors that dovetail with manufacturing diversification ambitions. Investment in inland dry ports and bonded e-commerce zones is pruning transit dwell times, while fee simplifications elevate SME export drives. The regulatory revamp is stitched into the Kingdom’s National Transport and Logistics Strategy, positioning the GCC courier, express, and parcel market for steady domestic expansion anchored around Riyadh-centric fulfillment.
The United Arab Emirates is sprinting ahead on growth with 7.62% share between 2026-2031, turning regulatory modernization into competitive advantage. The 12-digit integrated customs tariff, live since January 2025, standardizes HS codes across all seven emirates, reducing misclassification disputes and enabling fully automated duty assessments. Air-cargo throughput rose to 2.2 million tons in 2024 at Dubai International, while FedEx’s USD 350 million Dubai World Central expansion amplifies same-day regional cut-off horizons. Complementary road-freight corridors linking Abu Dhabi’s Khalifa Port to Saudi Arabia’s Al Batha crossing ensure redundancy and cost arbitrage options.
Qatar’s logistics ecosystem benefits from Hamad International’s capacity upgrades, a growing web of free zones, and the Third National Development Strategy’s focus on non-hydrocarbon diversification. Government incentives draw 3PLs to build GDP-compliant warehouses proximal to production lines, amplifying healthcare and high-tech import flows. Bahrain, Kuwait, and Oman contribute incremental volume through specialty trade—ranging from automotive parts transshipment to seafood export consolidation—sustaining a balanced geographic footprint for the broader GCC courier, express, and parcel market.
Competitive Landscape
The market tilts toward moderate consolidation, with the global trio of DHL, FedEx, and UPS anchoring cross-border express lanes, while regional stalwarts such as Aramex and SMSA Express harness local insight to compete vigorously on domestic turf. ADQ’s USD 1.2 billion acquisition of Aramex in July 2025 arms the company with state-backed capital, enabling network densification and platform modernization aligned with national trade-hub aspirations. Global integrators answer with automation blitzes: FedEx’s “One FedEx” realignment targets USD 4 billion in structural savings, redeploying capital into AI-guided sort centers and electric vehicle fleets.
White-space entrants leverage asset-light digital platforms to orchestrate crowdsourced fleets for hyperlocal fulfillment. PostEx is scaling invoice-financing and same-day delivery bundles aimed at SME retailers, while Ai-driven routing startups inject predictive ETAs and carbon-footprint dashboards into shipper portals. The healthcare vertical is emerging as a strategic battleground; DHL’s multiyear EUR 2 billion (USD 2.20 billion) outlay funds GDP-licensed nodes, validated shipper packaging, and deep-frozen mRNA vaccine lanes, raising the bar for compliance credentials.
Incumbents increasingly forge alliances with airport authorities and mall operators to extend fulfillment-as-a-service propositions. DP World’s logistics park near Jeddah aligns port handling with e-commerce warehousing, exemplifying convergence between maritime gateways and parcel networks. Competitive intensity thus pivots on network density, tech-enabled visibility, vertical expertise, and resilience under fuel and labor price shocks.
GCC Courier, Express, and Parcel (CEP) Industry Leaders
-
Aramex
-
DHL Group
-
FedEx
-
Emirates Post
-
Saudi Post
- *Disclaimer: Major Players sorted in no particular order

Recent Industry Developments
- July 2025: ADQ finalizes the USD 1.2 billion acquisition of Aramex, cementing a state-backed champion positioned for accelerated global expansion.
- June 2025: FedEx completes its “One FedEx” consolidation, unlocking USD 4.0 billion in overhead savings to fund hub automation and sustainability programs.
- February 2025: DHL earmarks EUR 2 billion (USD 2.20 billion) for its Health Logistics division through 2030, with 25% directed to the EMEA region, including new GDP-certified GCC facilities DHL.COM.
- February 2025: Dubai South and Expeditors International sign a 23,200 m² build-to-suit logistics facility agreement, expanding fulfillment capacity near Al Maktoum International Airport.


GCC Courier, Express, and Parcel (CEP) Market Report Scope
Domestic, International are covered as segments by Destination. Express, Non-Express are covered as segments by Speed Of Delivery. Business-to-Business (B2B), Business-to-Consumer (B2C), Consumer-to-Consumer (C2C) are covered as segments by Model. Heavy Weight Shipments, Light Weight Shipments, Medium Weight Shipments are covered as segments by Shipment Weight. Air, Road, Others are covered as segments by Mode Of Transport. E-Commerce, Financial Services (BFSI), Healthcare, Manufacturing, Primary Industry, Wholesale and Retail Trade (Offline), Others are covered as segments by End User Industry. Qatar, Saudi Arabia, UAE are covered as segments by Country.| Domestic |
| International |
| Express |
| Non-Express |
| Business-to-Business (B2B) |
| Business-to-Consumer (B2C) |
| Consumer-to-Consumer (C2C) |
| Heavy Weight Shipments |
| Light Weight Shipments |
| Medium Weight Shipments |
| Air |
| Road |
| Others |
| E-Commerce |
| Financial Services (BFSI) |
| Healthcare |
| Manufacturing |
| Primary Industry |
| Wholesale and Retail Trade (Offline) |
| Others |
| Qatar |
| Saudi Arabia |
| UAE |
| Rest of GCC |
| Destination | Domestic |
| International | |
| Speed of Delivery | Express |
| Non-Express | |
| Model | Business-to-Business (B2B) |
| Business-to-Consumer (B2C) | |
| Consumer-to-Consumer (C2C) | |
| Shipment Weight | Heavy Weight Shipments |
| Light Weight Shipments | |
| Medium Weight Shipments | |
| Mode of Transport | Air |
| Road | |
| Others | |
| End User Industry | E-Commerce |
| Financial Services (BFSI) | |
| Healthcare | |
| Manufacturing | |
| Primary Industry | |
| Wholesale and Retail Trade (Offline) | |
| Others | |
| Country | Qatar |
| Saudi Arabia | |
| UAE | |
| Rest of GCC |


Market Definition
- Courier, Express, and Parcel - The Courier, Express, and Parcel services, often called as CEP Market, refers to the logistics and postal service providers which specialize in moving small goods (parcels/packages). It captures the overall market size (USD) and market volume (number of parcels) of (1) the shipments/parcels/packages which are under 70kgs/ 154lbs weight, (2) Business Customer packages viz. Business-to-Business (B2B) & Business-to-Consumer (B2C) as well as private customer packages (C2C), (3) non-express parcel delivery services (Standard and Deferred) as well as express parcel delivery services (Day-Definite-Express and Time-Definite-Express), (4) domestic as well as international shipments.
- Demographics - To analyse total addressable market demand, population growth & forecasts have been studied and presented in this industry trend. It represents population distribution across categories like gender (male/female), development area (urban/rural), major cities among other key parameters like population density and final consumption expenditure (growth and share % of GDP). This data has been used for assessing the fluctations in demand & consumption expenditure, and the major hotspots (cities) of potential demand.
- Domestic Courier Market - Domestic Courier Market refers to the CEP shipments wherein the origin and destination is within the boundary of the geography studied (country or region as per the scope of report). It captures the market size (USD) and market volume (number of parcels) of (1) the shipments/parcels/packages which are under 70kgs/ 154lbs weight, including light weight shipments, medium weight shipments and heavy weight shipments (2) Business Customer packages viz. Business-to-Business (B2B) & Business-to-Consumer (B2C) as well as private customer packages (C2C), (3) non-express parcel delivery services (Standard and Deferred) as well as express parcel delivery services (Day-Definite-Express and Time-Definite-Express).
- E-Commerce - This end user industry segment captures the external (outsourced) logistics expenditure incurred by the e-tailers, through online sales channel, on Courier, Express, and Parcel (CEP) services. The scope includes (i) the supply chain of a company's online customer orders being fulfilled, (ii) the process of getting a product from the point of manufacturing to the point at which it is delivered to consumers. It involves managing inventory (deferred as well as time critical), shipping, and distribution.
- Export Trends and Import Trends - Overall logistics performance of an economy is positively and significantly (statistically) correlated to its trade performance (exports and imports). Hence, in this industry trend, total value of trade, major commodities/ commodity groups and the major trade partners, for the studied geography (country or region as per the scope of report) have been analysed alongside the impact of major trade/logistics infrastructure investments & regulatory environment.
- Financial Services (BFSI) - This end user industry segment captures the external (outsourced) logistics expenditure incurred by the BFSI players, on Courier, Express, and Parcel (CEP) services. CEP is important to the financial services industry in shipping of confidential documents and files. The establishments in this sector are engaged in (i) financial transactions (that is, transactions involving the creation, liquidation, or change in ownership of financial assets) or in facilitating financial transactions, (ii) financial intermediation, (iii) the pooling of risk by underwriting annuities and insurance, (iv) providing specialized services that facilitate or support financial intermediation, insurance and employee benefit programs, and (v) monetary control - the monetary authorities.
- Fuel Price - Fuel price spikes can cause delays and diruption for logistics service providers (LSPs), while drops in the same can result in higher short-term profitability and increased market rivalry to offer consumers with the best deals. Hence, the fuel price variations have been studied over the review period and presented along with the causes as well as market impacts.
- GDP Distribution by Economic Activity - Nominal Gross Domestic Product and distribution of the same, across major economic sectors in the geography studied (country or region as per scope of the report) have been studied and presented in this industry trend. As GDP is positively related to the profitability and growth of logistics industry, this data has been used in adjunction to the input-output tables/ supply-use tables for analyzing the potential major contributing sectors towards the logistics demand.
- GDP Growth by Economic Activity - Growth of Nominal Gross Domestic Product across major economic sectors, for the geography studied (country or region as per scope of the report) have been presented in this industry trend. This data has been utilized for assessing the growth of logistics demand from all the market end users (economic sectors considered here).
- Healthcare - This end user industry segment captures the external (outsourced) logistics expenditure incurred by the Healthcare players (Hospitals, clinics, mrdical centres) , on Courier, Express, and Parcel (CEP) services. The scope includes CEP services involved in the defrerred as well time critical movement of medical goods & supplies (surgical supplies and instruments, including gloves, masks, syringes, equipment). The establishments in this sector (i) include the ones providing medical care exclusively (ii) deliver services by trained professionals (iii) involve processes, including labor inputs of health practitioners with the requisite expertise (iv) are defined based on the educational degree held by the practitioners included in the industry.
- Inflation - Variations in both Wholesale Price Inflation (YoY change in producer price index) and Consumer Price Inflation have been presented in this industry trend. This data has been used to assess the inflationary environment as it plays a vital role in smooth functioning of the supply chain, directly impacting the logistics operational cost components e.g., pricing of tyres, driver wages & benefits, energy/fuel prices, maintenace costs, toll charges, warehousing rents, custom brokerage, forwarding rates, courier rates etc. hence impacting the overall freight and logistics market.
- Infrastructure - As infrastructure plays a vital role in an economy's logistics performance, variables like length of roads, distribution of road length by surface category (paved v/s unpaved), distribution of road length by road classification (expressways v/s highways v/s other roads), rail length, volume of containers handled by major ports and tonnage handled by major airports have been analysed and presented in this industry trend.
- International Express Service Market - International Express Service Market refers to the CEP shipments wherein the origin or destination is not within the boundary of the geography studied (country or region as per the scope of report). It captures the market size (USD) and market volume (number of parcels) of (1) the shipments/parcels/packages which are under 70kgs/ 154lbs weight, including light weight shipments, medium weight shipments and heavy weight shipments (ii) Inter-Region as well as Intra-Region Shipments
- Key Industry Trends - The report section named "Key Industry Trends" include all the key variables/parameters studied to better analyze the market size estimates and forecasts. All the trends have been presented in the form of data points (time series or latest available data points) along with analysis of the paramter in the form of concise market relevant commentary, for the geography studied (country or region as per the scope of report).
- Key Strategic Moves - The action taken by a company to differentiate from its competitor or used as a general strategy is referred to as a key strategic move (KSM). This includes (1) Agreements (2) Expansions (3) Financial Restructuring (4) Mergers and Acquisitions (5) Partnerships, and (6) Product Innovations. Key players (Logistics Service Providers, LSPs) in the market have been shortlisted, their KSM have been studied and presented in this section.
- Logistics Performance - Logistics Performance and Logistics Costs are the backbone of trade, and influences trade costs, making countries compete globally. Logistics performance is influenced by market wide adopted supply chain management strategies, government services, investments & policies, fuel/ energy costs, inflationary environment etc. Hence, in this industry trend, the logistics performance of the geography studied (country/ region as per the scope of report) has been analysed and presented over the review period.
- Manufacturing - This end user industry segment captures the external (outsourced) logistics expenditure incurred by the Manufacturing industry (including Hi-Tech/Technology) players, on Courier, Express, and Parcel (CEP) services. The end user players considered are the establishments primarily engaged in the chemical, mechanical or physical transformation of materials or substances into new products. Logistics Service Providers (LSPs) play a crucial role in maintaining a smooth flow of raw materials across the supply chain, enabling timely delivery of finished goods to distributors or end customers and storing & supplying the raw materials to clients for just-in-time manufacturing.
- Other End Users - Other end user segment captures the external (outsourced) logistics expenditure incurred by the construction, real estate, educational services, and professional services (administrative, waste management, legal, architectural, engineering, design, consulting, scientific R&D), on Courier, Express, and Parcel (CEP) services. Logistics Service Providers (LSPs) plays a crucial role in the reliable movement of time critical supplies and documents to/from these industries such as transporting any equipment or resources required, shipping confidential documents and files.
- Primary Industry - This end user industry segment captures the external (outsourced) logistics expenditure incurred by the AFF (Agriculture, Fishing, and Forestry) and Extraction indsutry (Oil &Gas, Quarrying and Mining) players, on Courier, Express, and Parcel (CEP) services. The end user players considered are the establishments (i) primarily engaged in growing crops, raising animals, harvesting timber, harvesting fish & other animals from their natural habitats and providing related support activities; (ii) that extract naturally occurring mineral solids, such as coal and ores; liquid minerals, such as crude petroleum; and gases, such as natural gas. Herein, Logistics Service Providers (LSPs) (i) play a crucial role in acquisition, storage, handling, transportation, and distribution activities for the optimal & continuous flow of inputs (seeds, pesticides, fertilizers, equipment, and water) from manufacturers or suppliers to the producers and smooth flow of output (produce, agro-goods) to distributors/ consumers; (ii) cover entire phases from upstream to downstream and play a crucial role in the transportation of machinery, drilling equipments, extracted minerals, crude oil & natural gas and refined/ processed products from one place to another. This includes both termperature controlled and non-temperature controlled logistics, as and when required according to the shelf life of goods being transported or stored.
- Producer Price Inflation - It indicates inflation from viewpoint of the producers viz. the average selling price received for their output over a period of time. Annual change (YoY) of producer price index is reported as wholesale price inflation in the "Inflation" industry trend. As WPI captures dynamic price movements in most comprehensive way, it is widely used by governments, banks, industry, business circles and is deemed important in formulation of trade, fiscal and other economic policies. The data has been used in adjunction to consumer price inflation for better understanding the inflationary environment.
- Segmental Revenue - Segmental Revenue has been triangulated or computed and presented for all the major players in the market. It refers to the courier, express, and parcel (CEP) market specific revenue earned by the company, over the base year of study, in the geography studied (country or region as per the scope of report). It is computed through the study and analysis of major parameters like financials, service portfolio, employee strength, fleet size, investments, number of countries present in, major economies of concern, etc. that have been reported by the company in its annual reports, webpage. For companies having scarce financial disclosures, paid databases like D&B Hoovers, Dow Jones Factiva have been resorted to and verified through industry/expert interactions.
- Transport and Storage Sector GDP - Value and growth of Transport and Storage Sector GDP has a direct relation to the freight and logistics market size. Hence, this variable has been studied and presented over the review period, in value terms (USD) and as share % of total GDP, in this industry trend. The data has been supported by concise and relevant commentary around the investments, developments, and current market scenario.
- Trends in E-Commerce Industry - Enhanced internet connectivity and boom in smartphone penetration, coupled with increasing disposable incomes, has led to a phenomenal growth in the e-commerce market globally. Online shoppers require fast and efficient delivery of their orders leading to an increase in the demand for logistics services especially e-commerce fulfilment services. Hence, the Gross Merchandise Value (GMV), historial and projected growth, breakup of major commodity groups in e-commerce industry for the studied geography (country or region as per scope of the report) have been analysed and presented in this industry trend.
- Trends in Manufacturing Industry - Manufacturing industry involves the transformation of raw materials into finished products, while logistics industry ensures the efficient flow of raw materials to the factory, and the transport of manufactured products to the distributors & consumers. Demand-Supply of both industries are highly cross-linked and critical for a seamless supply chain. Hence, the Gross Value Added (GVA), breakup of GVA into major manufacturing sectors, and growth of manufacturing industry over the review period have been analysed and presented, in this industry trend.
- Wholesale and Retail Trade (Offline) - This end user industry segment captures the external (outsourced) logistics expenditure incurred by the wholesalers and retailers, through offline sales channel, on Courier, Express, and Parcel (CEP) services. The end user players considered are the establishments primarily engaged in wholesaling or retailing merchandise, generally without transformation, and rendering services incidental to the sale of merchandise. Logistics Service Providers (LSPs) plays a crucial role in the reliable movement of supplies to and finished products from production houses to the distributors and finally to the end customer covering activites like material sourcing, transportation, order fulfillment, warehousing & storage, demand forecasting, inventory management etc.
| Keyword | Definition |
|---|---|
| Axle Load | The axle load refers to the total load (weight) bearing on the roadway through wheels connected to a given axle. Across the globe, there are systems in place to ensure axle load monitoring, wherein surpassing the defined limits set by the concerned regulatory authority can lead to penalty/fine. For transportation of goods via road this can be an important determinant of costs as knowledge about the axle load limits can be used to (i) load the vehicle optimally for maximizing profits (ii) avoid exceeding the same and hence the probable fines associated (iii) avoid wear and tear of the vehicle (iv) avoid damage to pavement resulting in noticeable public maintenance and repair costs (v) achieve better turnaround time. |
| Back Haul | Backhaul is the return movement of a transport vehicle from its original destination to its original point of departure, and can include full, partial, or empty truck loads (all or part of the way) depending on the visibility of the local freight ecosystem. In this regard, transportation of empty containers to the point of origin, known as deadheading is also a significant factor, considering the supply/container shortages across the geographies, resulting in cost escalation and under optimized profit potential attainment. Generally, the carriers offer discounts on the backhaul, to secure freight for the trip. |
| Bill of Lading (BOL) | A bill of lading is a legal contract document issued by a carrier to a shipper to acknowledge reception of their cargo, and is evidence for the contract of carriage between the two parties. Broadly it details the (i) type, quantity, and other specifications of the goods being carried (ii) destination, and terms & conditions of the shipment (iii) carrier and drivers with all the necessary information to process the shipment, which can be used for insurance and customs clearance purposes (iv) assurance that the consignment is damage-free and ready to be shipped to the consignee. In this regard, a house bill of lading (HBL) is a document issued by a freight forwarder or a non-vessel operating common carrier (NVOCC) to acknowledge receipt of items for shipment (to a shipper). If shipments from several shippers are involved a master bill of lading (MBL) might be involved which is a consolidated version of the same for all the shipments being taken care of by the carrier (to a common destination) and might be issued by the carrier to the freight forwarder or the shipper (depending on who books the transport). |
| Bunkering | Bunkering is the process of supplying fuel to power the propulsion system of a ship. It includes the logistics of loading and distributing the fuel among available shipboard tanks. In this regard, (i) Bunker fuel is technically any type of fuel oil used aboard ships. It gets its name from the containers on ships and in ports that it is stored in; in the days of steam they were coal bunkers but now they are bunker-fuel tanks, (ii) Bunker refers to the spaces (Tank) on board a vessel to store fuel, (iii) Bunker trader refers to a person dealing in trade of bunker (fuel), (iv) Bunker call is made when a cargo ship anchors or berths in a port to take on bunker oil or supplies, (v) Bunkering service is the supply of a requested quality and quantity of bunkers to a ship. Bunkering is signficant from point of view of freight rates applicable to the shipper as Bunker Contribution (BUC)/ Fuel Adjustment Factor (FAF)/ Bunker Adjustment Factor (BAF) are applied by shipping lines to offset the effect of fluctuations in the cost of bunkers. |
| Cabotage | Transport by a vehicle registered in a country, performed on the national territory of another country. Cabotage law may restrict domestic cargo traffic to be carried in its own nationally registered, and sometimes built and crewed vehicles, though regulations vary across industries/commodity groups/countries and sometimes specify maximum allowable percentage of cabotage that can be serviced by foreign registered fleet. |
| C-commerce | Collaborative commerce (also known as C-commerce), (i) describes electronically enabled business interactions among an enterprise’s internal personnel, business partners and customers throughout a trading community (industry, industry segment, supply chain or supply chain segment); (ii) is the optimization of supply and distribution channels to capitalize on the global economy by using new technology efficiently. Advantages of C-commerce, to detail few include (i) maximization of organization's efficiency and profitability (ii) technology integration with physical channels to allow companies to work together (iii) increased information exchange such as inventory and product specifications, using the web as an intermediary (iv) increased competitiveness by reaching a broader audience. Examples of C-commerce, also known as peer-to-peer commerce, include (i) companies that allow consumers to rent things from each other, or marketplaces, such as Meta (formerly Facebook) Marketplace, that allow the sale of used goods; (ii) DoorDash teamed up with many national brands, such as McDonald’s and Chipotle, to offer fast food delivery, building their business model on c-commerce. They have since expanded their delivery service from restaurants to retailers and even offer 'fleets' of drivers to businesses. |
| Courier | A business/company that delivers packages/parcels/shipments (upto 70 kgs) including quick door to door pickup and delivery service for goods or documents, domestically or internationally, on a commercial contract basis. Example, DHL Group, FedEx, United Parcel Service of America, Inc., USPS, International Distributions Services, J&T Express, SF Express among several others |
| Cross docking | Cross docking is a practice in logistics management that includes unloading incoming delivery vehicles and loading the materials directly into outbound delivery vehicles, omitting traditional warehouse logistical practices and saving time and money. It requires close synchronization of both inbound and outbound movements. It is highly significant in reduction of costs pertaining to warehousing & storage (and the associated Value Added Services). |
| Cross Trade | International transport between two different countries performed by a vehicle registered in a third country. A third country is a country other than the country of loading/embarkation and the country of unloading/disembarkation. Cross Trade law may restrict international cargo traffic to be carried by respective country's registered vehicles, and sometimes built and crewed vehicles, though regulations vary across industries/commodity groups/countries and sometimes specify maximum allowable percentage of cross trade that can be serviced by foreign registered fleet. |
| Customs Clearance | The process of declaring and clearing cargoes through customs. It includes the procedures involved in getting cargo released by Customs through designated formalities such as presenting import license/permit, payment of import duties and other required documentations by the nature of the cargo. In this regard, a customs broker is a person or company licensed by the respective department of the country to act on behalf of freight importers and exporters. |
| Dangerous Goods | Dangerous goods (or hazardous materials or HAZMAT) include flammable liquids/solids, gases (compressed, liquified, dissolved under pressure), corrosives, oxidising substances, explosive substances and articles, substances which on contact with water emit flammable gasses, organic peroxides, toxic substances, infectious substances, radioactive materials, miscellaneous dangerous goods and articles. |
| First mile Delivery | First mile delivery refers to the (i) first stage of the freight/shipment/cargo/courier transportation (ii) the transportation of goods from a merchant’s premises or warehouse to the next fulfillment centre/warehouse/hub from where the goods are forwarded (iii) shipping goods from local distribution centers to stores (For retailers) (iv) transportation of finished goods from a plant or a factory to a distribution center (For manufacturers), (v) pick up of goods from the end-customer’s home or store followed by movement to a warehouse or storage location (movers and packers), (vi) process where goods are picked up from a retailer and then transferred to third-party logistics providers or courier service providers to be delivered to the end-consumer (e-commerce). Once the package reaches the next warehouse or the courier’s hub, it is then sorted and transported further until it reaches the customer’s doorstep. Example, if one chooses UPS as a courier, first-mile delivery will be the product being delivered from manufacturer's/retailer's warehouse to the UPS’s warehouse/ fulfilment centre. |
| Last Mile Delivery | Last mile delivery refers to the very last step of the delivery process when a parcel is moved from a transportation hub (warehouse or a distribution center or fulfillment centre) to its final destination, which usually is a personal residence/retail store/ business, or parcel locker. It accounts for around half of the total cost involved in entire process of first mile, middle mile, and last mile delivery, though it can vary shipment to shipment, based on commodity, business model and similar factors. |
| Milkrun | A Milk Run is a delivery method used to transport mixed loads from various suppliers to one customer, using lean management principles applied to logistics. Instead of each supplier sending a truck every week to meet the needs of one customer, one truck (or vehicle) visits the suppliers to pick up the loads for that customer. This method of transport got its name from the dairy industry practice, where one tanker used to collect milk from several dairy farms for delivery to a milk processing company. A milk run can be a more efficient way to handle logistics but require proper planning. If the route involves products from different companies, there is need for an agreement about cost-sharing and other aspects of the cooperative delivery arrangement. Once the group settles these issues, this delivery method can save time and money for everyone by pooling operation costs and resources. |
| Multi country consolidation | Multi-Country Consolidation (MCC) is a cost-effective solution that consolidates one's cargo from different countries of origin to build Full Container Loads (FCL). MCC is most suitable for companies that import light volumes of goods from multiple countries but want to take advantage of the more economic FCL freight rates. Apart from costing some of the other advantages include (i) flexibility to choose suppliers from a wider range of origin countries without worrying about the logistics to final destination from each origin, (ii) ability to pick the most suitable suppliers from many different countries for one's business operations. The increase in one's sourcing options by MCC provides the kind of flexibility needed in competitive global markets. |
| Q-commerce | Q-commerce, also referred to as quick commerce, is a type of e-commerce where emphasis is on quick deliveries, typically in less than an hour. The companies providing Q-Commerce services might have vertically intergrated model or might be using third party delivery platforms (outsourced logistics). It has advantages like (i) competitve USP, (ii) potential to earn greater profit margins, (iii) better customer experience, (iv) guaranteed availability of products, (v) traceability, and (vi) scaleability. |
| ReverseLogistics | Reverse logistics is a type of supply chain management that moves goods from customers back to the sellers or manufacturers and may involve ciruclar economy principles (3Rs) viz. recycling, reuse (repurposing, reselling), reducing or repairing. In this regard, reverse commerce (or Recommerce) is the selling of previously owned items through physical or online marketplaces/distribution channels to buyers who reuse, recycle or resell them. |


Research Methodology
Mordor Intelligence follows a four-step methodology in all our reports.
- Step-1: Identify Key Variables: In order to build a robust forecasting methodology, the variables and factors identified in Step-1 are tested against available historical market numbers. Through an iterative process, the variables required for market forecast are set and the model is built on the basis of these variables.
- Step-2: Build a Market Model: Market-size estimations for the forecast years are in nominal terms. Inflation is considered to be a part of the pricing, and the average selling price (ASP) is varying throughout the forecast period for each country
- Step-3: Validate and Finalize: In this important step, all market numbers, variables and analyst calls are validated through an extensive network of primary research experts from the market studied. The respondents are selected across levels and functions to generate a holistic picture of the market studied.
- Step-4: Research Outputs: Syndicated Reports, Custom Consulting Assignments, Databases & Subscription Platforms


