Africa Confectionery Market Size and Share
Market Overview
| Study Period | 2021 - 2031 |
|---|---|
| Forecast Data Period | 2026 - 2031 |
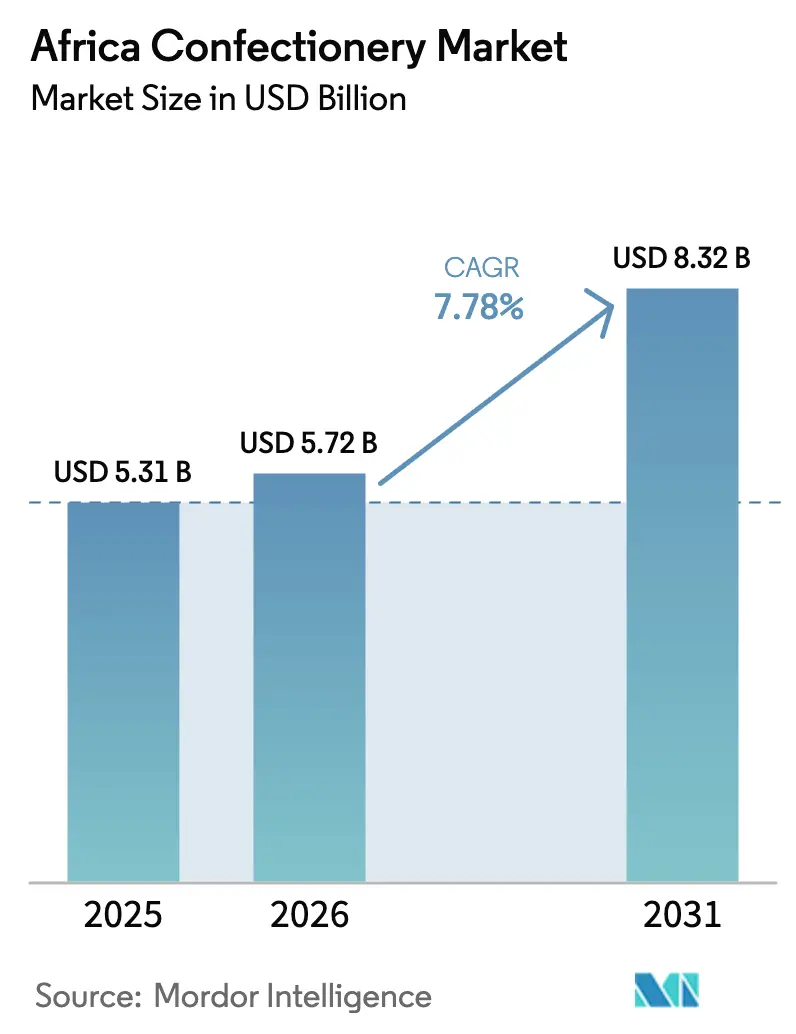
| Base Year Market Size (2025) | USD 5.31 Billion |
| Market Size (2026) | USD 5.72 Billion |
| Market Size (2031) | USD 8.32 Billion |
| Growth Rate (2026 - 2031) | 7.78% CAGR |
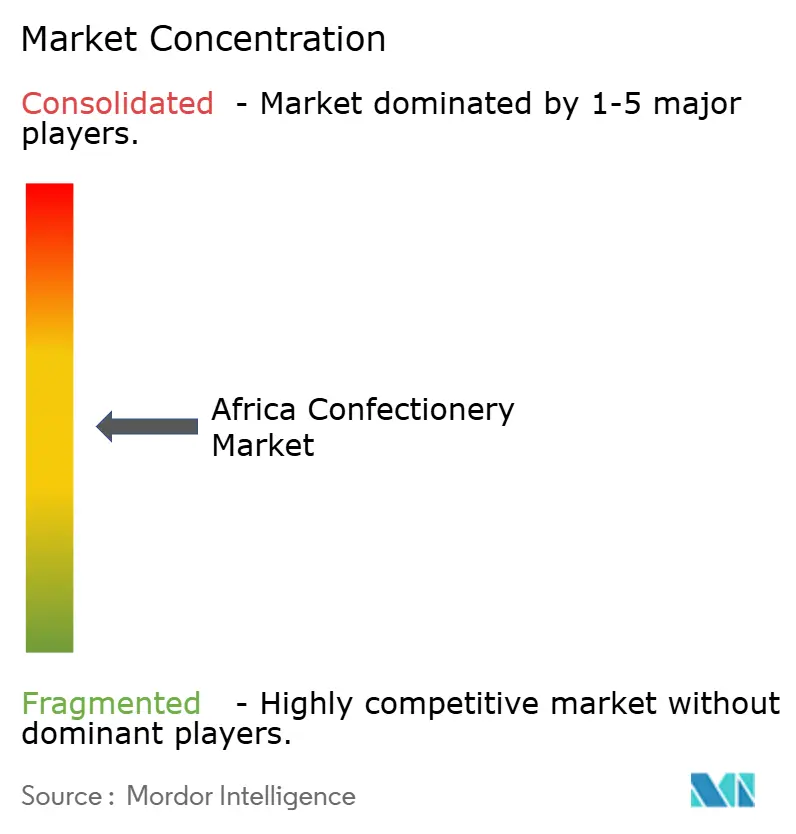
| Market Concentration | Medium |
Major Players*Disclaimer: Major Players sorted in no particular order Image © Mordor Intelligence. Reuse requires attribution under CC BY 4.0. |
|
Africa Confectionery Market Analysis by Mordor Intelligence
The African confectionery market size is expected to grow from USD 5.31 billion in 2025 to USD 5.72 billion in 2026 and is forecast to reach USD 8.32 billion by 2031 at 7.78% CAGR over 2026-2031. Urbanization, a youthful population, and rising disposable incomes are driving this expansion. Gen Z and Millennial consumers are demonstrating strong brand loyalty, drawn to innovative formats, unique flavors, and recognizable brands. Increasing health awareness is pushing the market towards sugar-free, low-calorie, and fortified confectionery products, appealing to health-conscious consumers. The premiumization trend, highlighted by the growing demand for dark chocolate and artisanal candies, is boosting consumption in urban and affluent areas. Manufacturers are focusing on portion-controlled packaging to align with daily purchasing habits, while premium chocolate variants are gaining popularity in metropolitan regions. Investments in regional cocoa processing are reducing reliance on imports, and digital retail channels are enhancing distribution reach. Although supply chain disruptions and currency fluctuations pose challenges, companies are protecting margins through portfolio premiumization, local sourcing, and the expansion of informal trade.
Key Report Takeaways
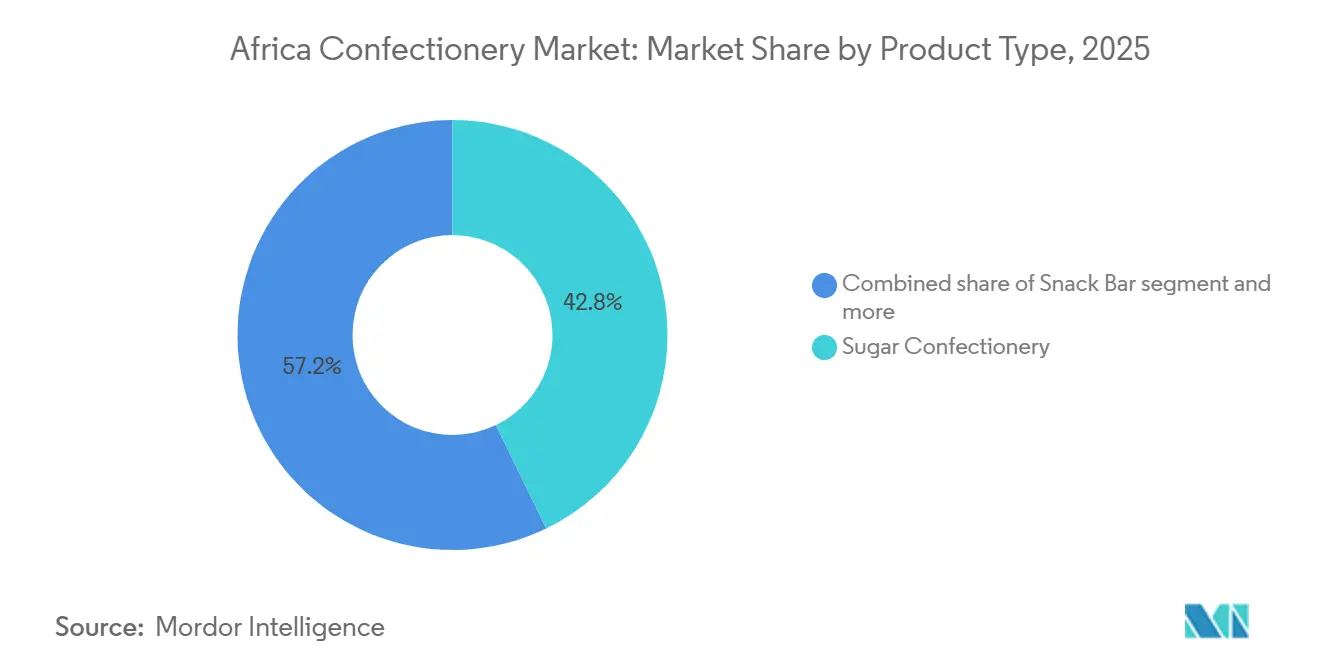
- By product type, sugar confectionery held 42.84% of the African confectionery market share in 2025, while snack bars are projected to post the fastest 8.38% CAGR through 2031.
- By packaging type, single-serve packs commanded 61.59% of 2025 sales, and multipacks are forecast to advance at an 8.12% CAGR to 2031.
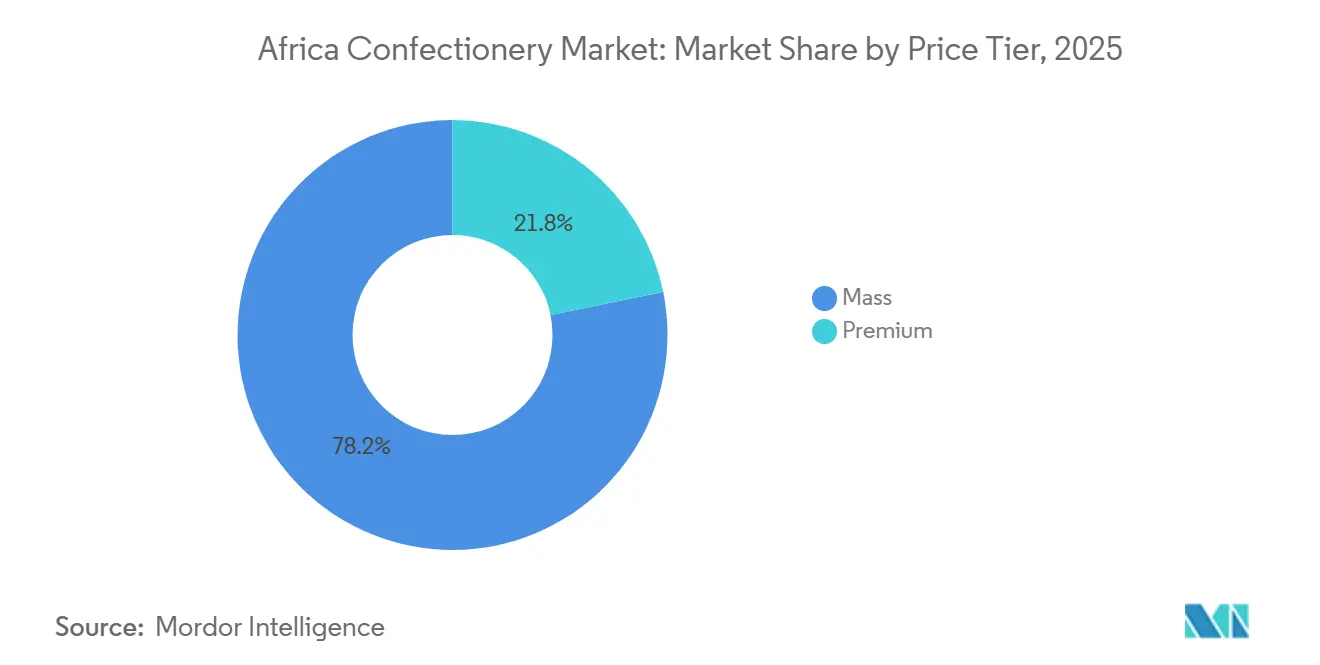
- By price tier, mass items contributed 78.21% of 2025 revenue, whereas premium lines are poised for an 8.51% CAGR across the outlook period.
- By distribution channel, supermarkets and hypermarkets controlled 44.21% of the 2025 base, and online retail is expected to expand at an 8.64% CAGR by 2031.
- By geography, South Africa accounted for 34.58% of 2025 spending, and Nigeria is anticipated to register an 8.96% CAGR to 2031.
Note: Market size and forecast figures in this report are generated using Mordor Intelligence’s proprietary estimation framework, updated with the latest available data and insights as of January 2026.
Africa Confectionery Market Trends and Insights
Drivers Impact Analysis*
| Driver | (~) % Impact on CAGR Forecast | Geographic Relevance | Impact Timeline |
|---|---|---|---|
| Increasing consumer interest in premium and dark chocolate variants | +1.2% | South Africa, Nigeria, Egypt | Medium term (2-4 years) |
| Product premiumisation through smaller affordable pack sizes | +0.9% | Global, strongest in urban centers | Short term (≤ 2 years) |
| Increasing brand loyalty, especially among Gen Z and Millennials | +1.1% | Nigeria, South Africa, Morocco | Long term (≥ 4 years) |
| Rising health consciousness driving demand for sugar-free, low-calorie, and premium artisanal confectionery | +0.8% | South Africa, urban Egypt and Morocco | Medium term (2-4 years) |
| Growth of regional cocoa-processing capacity | +1.3% | West Africa spillover to Central/East Africa | Long term (≥ 4 years) |
| Rapid urbanization reshaping consumption habits toward convenience | +1.5% | Nigeria, Egypt, Morocco, urban South Africa | Short term (≤ 2 years) |
| Source: Mordor Intelligence | |||


Premium Chocolate Variants Drive Market Sophistication
Urban markets in South Africa, Nigeria, and Egypt are driving a significant shift in consumer preferences across Africa's emerging middle class, with an increasing inclination toward premium and dark chocolate variants. This trend reflects a broader global movement, where consumers are actively seeking innovative and unique chocolate experiences that go beyond traditional offerings. The premiumization trend is particularly prominent in South African metropolitan areas, where higher household income levels support discretionary spending on indulgent and high-quality products. According to the World Bank, South Africa's GDP per capita reached USD 6,253.4 in 2024[1]Source: World Bank, "GDP per capita", www.worldbank.org, further highlighting the economic capacity for such consumer behavior. Dark chocolate has gained popularity among health-conscious consumers, who often associate its higher cocoa content with antioxidant benefits and overall wellness. This perception not only allows manufacturers to position their products at premium price points but also helps them establish strong brand differentiation in a competitive market. In response to this growing demand, local manufacturers are actively reformulating their existing product lines to include higher cocoa percentages. Additionally, they are introducing limited-edition variants specifically designed to cater to the sophisticated palates of discerning consumers, further capitalizing on the premiumization trend.
Affordable Pack Architecture Expands Market Access
In Africa, the strategy of product premiumization through smaller, affordable pack sizes is making premium confectionery more accessible to the region's price-sensitive consumers. This approach enables manufacturers to sustain a premium brand image while driving volume growth, even in markets where limited disposable income restricts the purchase of larger formats. Tiger Brands serves as a notable example of this strategy, implementing a township expansion plan aimed at reaching 130,000 informal retail outlets by 2029. The company focuses on offering optimized pack sizes and providing promotional support tailored to the unique economic dynamics of spaza shops. This strategy leverages psychological pricing principles, where consumers perceive smaller premium packs as offering better value compared to mass-market alternatives of similar price points. Additionally, the portable and lightweight packaging is designed to meet the needs of busy urban consumers who seek convenient snack options during commutes or work breaks. These easy-to-carry packs not only increase purchase frequency but also encourage consumers to try new products. By facilitating product sampling, these smaller packages help build brand familiarity and foster customer loyalty, which can eventually lead to consumers upgrading to larger pack sizes over time.
Generational Brand Loyalty Reshapes Competitive Dynamics
In Africa, Gen Z and Millennial consumers are demonstrating a notable increase in brand loyalty, surpassing the patterns observed in previous generations. This shift is providing early adopters of digital engagement strategies and social responsibility initiatives with a significant competitive advantage. This demographic group, which constitutes a large portion of Africa's population, is highlighted by United Nations data indicating that, in 2024, males aged 20-29 accounted for 8.3% of South Africa's population[2]Source: United Nations, "Population Pyramids of the World", www.un.org. These younger consumers are highly discerning, showing a readiness to pay a premium for brands that align with their core values, such as sustainability, authenticity, and social impact. Transparency and ethical sourcing are critical factors for this group, particularly in the confectionery market, where there is growing scrutiny over the origins of ingredients. Brands that effectively incorporate storytelling into their marketing strategies, connecting product heritage with local cultural elements while maintaining global quality standards, are achieving greater success. Over time, as these consumers enter their peak earning years, their loyalty strengthens, significantly influencing household purchasing behaviors and decisions.
Health-Conscious Formulations Capture Premium Segments
Health consciousness is rising across Africa's urban markets, driving demand for sugar-free, low-calorie, and premium artisanal confectionery products. South Africa leads this trend, supported by robust health awareness campaigns and regulatory frameworks. This shift aligns with WHO guidelines advocating reduced sugar consumption and coincides with South Africa's Health Promotion Levy, which has increased consumer awareness of sugar content in processed foods. With diabetes and chronic diseases becoming more prevalent, consumers are prioritizing healthier product options. In 2024, 25 million adults aged 20-79 in Africa are living with diabetes, with 18 million of them undiagnosed, according to the International Diabetes Federation[3]Source: International Diabetes Federation, "IDF Africa", idf.org. Manufacturers are addressing this by reformulating products to retain taste while reducing sugar content through alternative sweeteners and functional ingredients. Barry Callebaut's research shows that 61% of global consumers are interested in chocolates that support mental health, presenting opportunities for functional confectioneries that combine indulgence with wellness. Additionally, the premium positioning of health-focused products enables manufacturers to offset higher ingredient costs while establishing unique market positions.
Restraints Impact Analysis*
| Restraint | (~) % Impact on CAGR Forecast | Geographic Relevance | Impact Timeline |
|---|---|---|---|
| Supply chain fragility and logistics gaps | -1.8% | Pan-African, acute in landlocked markets | Short term (≤ 2 years) |
| Exchange-rate volatility impacting imported inputs | -1.2% | Import-dependent markets, Nigeria, Egypt | Short term (≤ 2 years) |
| Persistent informal trade eroding branded sales | -0.9% | Nigeria, Egypt, Morocco | Medium term (2-4 years) |
| Rising anti-sugar regulation and "sin-tax" proposals | -0.7% | South Africa implemented, spreading regionally | Long term (≥ 4 years) |
| Source: Mordor Intelligence | |||
Regional Cocoa Processing Capacity Transforms Supply Economics
The growth of regional cocoa-processing capacities is unlocking opportunities for backward integration, which could transform competitive dynamics and profit structures in Africa's confectionery market. In Nigeria, the partnership between IFC and Johnvents Foods signifies a strategic move toward increasing local value addition. This approach reduces dependence on imported cocoa derivatives while offering cost advantages to regional manufacturers. This shift aligns with West Africa's ongoing cocoa supply challenges, where production deficits have caused global cocoa butter and cocoa liquor prices to rise by 63% in 2024. Strengthening regional processing capabilities allows manufacturers to capture higher value chain margins and mitigate risks associated with international commodity price fluctuations. This trend supports import substitution strategies and enhances the ability of African manufacturers to compete more effectively with international brands in terms of cost and supply reliability.
Urbanization Accelerates Convenience-Oriented Consumption
Rapid urbanization across Africa is significantly transforming consumer behavior, particularly in the confectionery market, as urban populations increasingly prioritize convenience. This shift has led to a growing demand for on-the-go snacking solutions and impulse purchases. Urban consumers, on average, visit informal retail outlets, commonly referred to as 'spazas,' approximately four times per week, compared to just once weekly for supermarkets. This stark difference highlights a strong preference for purchasing options that are both accessible and convenient. Consequently, single-serve packaging formats and products designed for immediate consumption are gaining popularity over those intended for household sharing. To capitalize on this trend, manufacturers are strategically optimizing their distribution networks to ensure product availability at high-traffic urban locations. Additionally, they are focusing on developing innovative products specifically tailored for mobile consumption scenarios, aligning with the evolving needs of urban consumers.
*Our forecasts treat driver/restraint impacts as directional, not additive. The impact forecasts reflect baseline growth, mix effects, and variable interactions.
Segment Analysis
By Product Type: Sugar Confectionery Dominance Faces Snack Bar Disruption
In 2025, sugar confectionery holds a dominant 42.84% market share in Africa, underscoring the continent's longstanding affinity for hard candies, lollipops, and gummies. These treats, known for their prolonged enjoyment, come at price points that resonate with many consumers. Yet, it's the snack bars that are stealing the spotlight, charting an impressive 8.38% CAGR growth rate through 2031. This surge is largely fueled by a wave of health-conscious consumers gravitating towards functional nutrition and the allure of convenient meal replacements. Meanwhile, chocolate products, despite facing the ebb and flow of cocoa price fluctuations, continue to enjoy steady growth. Urban markets are particularly warming up to dark chocolate variants, with their premium positioning paving the way for expanded profit margins. Gums, while a mature category with consistent demand, see bubble gum thriving especially among the youth in Nigeria and Egypt, where social settings heavily influence buying choices.
These evolving segment dynamics echo a broader trend towards "snackification." Tiger Brands, attuned to this shift, has made it a central strategic focus. The company is channeling investments into product innovation and expanding its capacity to harness this trend. Urbanization is playing a pivotal role, with protein and cereal bars riding the wave. As city dwellers juggle busy schedules, the demand for on-the-go nutrition solutions has surged. Health-conscious consumers are gravitating towards fruit and nut bars, drawn by their natural ingredients and touted functional benefits. At the same time, traditional sugar confections like toffees and nougats continue to hold their ground, celebrated for their cultural significance in gifting and festivities across Africa's diverse markets.


By Packaging Type: Single-Serve Convenience Drives Volume Growth
In 2025, single-serve packaging holds a significant 61.59% market share, meeting African consumers' needs for portion control, affordability, and impulse purchases, particularly within the continent's informal retail channels. This packaging type enables manufacturers to set prices suited to daily purchasing power while expanding their reach through small retailers that typically lack the capacity for large inventories. On the other hand, multipacks are experiencing faster growth, with an 8.12% CAGR projected through 2031. This growth is driven by the rise of modern trade and urban households' preference for bulk purchases, supported by their access to refrigeration and storage facilities.
The transformation in packaging reflects evolving retail dynamics. Traditional trade continues to dominate in many African markets, accounting for over 70% of FMCG sales. This environment favors single-serve formats, which align well with daily purchasing behaviors and cash flow patterns. The increasing adoption of multipacks is closely linked to the growing presence of supermarkets and rising household incomes, enabling bulk purchases and associated cost benefits. Additionally, sustainability is beginning to shape packaging decisions, with manufacturers focusing on recyclable materials and reducing packaging waste. These efforts align with emerging environmental regulations and consumers' increasing demand for responsible consumption.
By Price Tier: Mass Market Resilience Amid Premium Acceleration
By 2025, mass market products are projected to hold a 78.21% market share in Africa, highlighting the region's price-sensitive consumer base where affordability is the key purchase driver across various demographics. Meanwhile, premium products are expected to grow at an 8.51% CAGR through 2031, reflecting a growing consumer inclination to spend more on superior quality, health benefits, and brand prestige. This market division offers manufacturers an opportunity to develop portfolio strategies that address both segments through distinct product lines and targeted distribution methods.
The growth of the premium segment is primarily concentrated in urban areas with higher disposable incomes. South Africa's metropolitan regions and Nigeria's commercial centers, in particular, are experiencing this trend, driven by aspirational consumption that influences brand preferences. At the same time, the resilience of the mass market underscores the importance of value engineering and efficient manufacturing to ensure affordability without sacrificing profitability. Manufacturers like Tiger Brands are actively investing in affordability strategies, such as optimizing pack sizes and sourcing locally, to protect their market share from low-cost competitors. Conversely, premium positioning allows for margin expansion by incorporating functional ingredients, sustainable packaging, and artisanal elements that appeal to health-conscious and environmentally aware consumers.
By Distribution Channel: Traditional Trade Dominance Challenges Digital Growth
By 2025, supermarkets and hypermarkets are expected to hold a 44.21% market share, leveraging their well-established supply chains and strong consumer trust. This dominance is particularly prominent in Africa's major urban markets. On the other hand, online retail channels are experiencing rapid growth, with an 8.64% CAGR projected through 2031. This growth is driven by advancements in digital infrastructure and evolving purchasing habits, especially among younger consumers. At the same time, convenience stores serve as key intermediaries, particularly in high-traffic urban areas where impulse purchases significantly contribute to confectionery sales throughout the day.
Africa's distribution landscape highlights its unique retail structure. While informal trade channels account for a considerable market share, they often lack the infrastructure and capital required to meet modern supply chain standards. The expansion of online retail is supported by increasing mobile payment adoption and improvements in last-mile delivery. However, challenges such as cold chain logistics and consumer concerns about product quality remain obstacles, particularly for temperature-sensitive confectionery products.
Geography Analysis
In 2025, South Africa holds a leading 34.58% share of the regional market, leveraging its robust retail infrastructure, higher per capita incomes, and sophisticated consumer preferences that favor premium products. The country's regulatory framework, particularly the Health Promotion Levy on sugar-sweetened beverages, is encouraging manufacturers to reformulate products toward healthier alternatives. This shift not only supports public health but also provides a competitive advantage to manufacturers with strong innovation capabilities. Additionally, the informal trade sector, especially spaza shops, significantly contributes to the confectionery market by driving volumes through frequent, small-value transactions that align with township consumption patterns.
Nigeria is the fastest-growing market in the region, with a projected 8.96% CAGR through 2031. Its population of 230 million, growing middle class, and increasing urbanization sustain the demand for packaged confectionery products. Growth is further supported by infrastructure investments and the expansion of regional cocoa processing capacities. For instance, the IFC-Johnvents Foods partnership positions Nigeria as a regional manufacturing hub. Consumers increasingly prefer affordable, single-serve formats that match their daily purchasing power, while informal retail channels dominate the FMCG sector. Although currency volatility challenges import-dependent manufacturers, local sourcing initiatives and backward integration strategies are improving cost efficiencies for domestic production.
Egypt and Morocco offer distinct market opportunities shaped by cultural preferences and economic development. Egypt's large population and improving retail infrastructure drive volume growth, though currency instability pressures margins for manufacturers reliant on imported ingredients. Morocco benefits from its proximity to European markets and established food processing capabilities, which support both domestic consumption and export opportunities. The "Rest of Africa" category includes a variety of markets, ranging from established economies like Ghana and Kenya to emerging ones where infrastructure limitations hinder distribution. However, demographic trends in these emerging markets indicate strong long-term growth potential. Additionally, regional trade agreements, such as the African Continental Free Trade Area, are expected to lower barriers and create opportunities for pan-African distribution strategies that capitalize on economies of scale across multiple markets.
Competitive Landscape
The African confectionery market exhibits moderate fragmentation with multinational corporations competing alongside established regional players and emerging local manufacturers across diverse price segments and distribution channels. While global giants like Nestlé, Mondelez, and Mars bolster their local production and distribution, regional stalwarts like Tiger Brands harness their market insights and cost efficiencies to maintain their foothold. Competitive dynamics shift across product categories and geographies: premium segments, with their brand equity and distribution intricacies, see heightened concentration, whereas the mass market thrives on fragmentation, driven by accessible entry points and price competition.
Leading the charge in Africa's confectionery arena are global titans such as Mondeléz International, Mars Incorporated, and Nestlé SA, alongside regional players like Tiger Brands and Chocoladefabriken Lindt and Sprüngli AG. These companies are not just competing; they're innovating, prioritizing clean-label ingredients, sustainable sourcing, and healthier product alternatives. They're also showcasing operational agility, pouring investments into manufacturing and distribution across pivotal African markets. Their strategies are multifaceted: forging collaborations with local entities, establishing direct ties with cocoa farmers, and embracing digital transformations to broaden their consumer outreach. Furthermore, they're tailoring products to regional tastes, setting up new production hubs, and bolstering their presence in both traditional and modern retail landscapes.
Companies are increasingly prioritizing local manufacturing, refining their supply chains, and elevating their product portfolios to navigate currency fluctuations and align with the rising consumer focus on health and sustainability. While technology adoption is still in its nascent stages, it's on the rise, with firms channeling resources into digital marketing, e-commerce, and enhancing supply chain transparency for better customer interaction and operational streamlining. There's a goldmine of opportunities in functional confectionery, eco-friendly packaging, and tapping into rural markets. While established players grapple with distribution hurdles in these areas, nimble local manufacturers, armed with innovative strategies, see a clear path forward.
Africa Confectionery Industry Leaders
-
Mars Incorporated
-
Mondelēz International Inc.
-
Nestlé SA
-
Tiger Brands
-
Chocoladefabriken Lindt and Sprüngli AG
- *Disclaimer: Major Players sorted in no particular order

Recent Industry Developments
- August 2025: Acumen has invested in Loom Craft Chocolate, a pioneering Nigerian company producing high-quality chocolate while helping smallholder cocoa farmers earn more from their harvests. This marks Acumen’s first investment in Nigeria’s chocolate sector and will support Loom Craft Chocolate’s plans to expand production, reach new markets, and provide deeper support for rural farmers through hands-on training and fair sourcing practices.
- July 2023: Under its brand, Mondelēz International Inc. launched three new special edition flavors that deliver indulgence with much-loved flavor combinations. The 150 g slabs include Dairy Milk Chocoladefabriken Lindt and Sprüngli AG launched a vegan chocolate range in South Africa. The products are available in two vegan flavors – Lindt Vegan Smooth Chocolate (made with oats and almonds to deliver a smooth, creamy texture) and Lindt Vegan Hazelnut Chocolate (made with roasted hazelnuts and premium vegan chocolate for a nutty flavor).Fudge Cookie Crumble, Fudge Mint Crisp, and Dream Coconut and Hazelnut Bliss.
- April 2023: Under the ONE brand, The Hershey Company launched the Peanut Butter and Jelly Flavored Protein Bar. The ONE Limited Edition Peanut Butter and Jelly flavored bars are packed with 20 g of protein, 1 g of sugar, and the familiar taste of peanut butter and strawberry jelly flavors.


Africa Confectionery Market Report Scope
Chocolate, Gums, Snack Bar, Sugar Confectionery are covered as segments by Confections. Convenience Store, Online Retail Store, Supermarket/Hypermarket, Others are covered as segments by Distribution Channel. Egypt, Nigeria, South Africa are covered as segments by Country.| Chocolate | Dark Chocolate | |
| Milk and White Chocolate | ||
| Gums | Bubble Gum | |
| Chewing Gum | Sugar Chewing Gum | |
| Sugar-free Chewing Gum | ||
| Snack Bar | Cereal Bar | |
| Fruit and Nut Bar | ||
| Protein Bar | ||
| Sugar Confectionery | Hard Candy | |
| Lollipops | ||
| Mints | ||
| Pastilles, Gummies and Jellies | ||
| Toffees and Nougats | ||
| Others | ||
| Single-serve |
| Multipacks |
| Mass |
| Premium |
| Supermarket / Hypermarket |
| Convenience Store |
| Online Retail Store |
| Others |
| South Africa |
| Nigeria |
| Egypt |
| Morocco |
| Rest of Africa |
| By product Type | Chocolate | Dark Chocolate | |
| Milk and White Chocolate | |||
| Gums | Bubble Gum | ||
| Chewing Gum | Sugar Chewing Gum | ||
| Sugar-free Chewing Gum | |||
| Snack Bar | Cereal Bar | ||
| Fruit and Nut Bar | |||
| Protein Bar | |||
| Sugar Confectionery | Hard Candy | ||
| Lollipops | |||
| Mints | |||
| Pastilles, Gummies and Jellies | |||
| Toffees and Nougats | |||
| Others | |||
| By Packaging type | Single-serve | ||
| Multipacks | |||
| By Price Tier | Mass | ||
| Premium | |||
| By Distribution Channel | Supermarket / Hypermarket | ||
| Convenience Store | |||
| Online Retail Store | |||
| Others | |||
| By Country | South Africa | ||
| Nigeria | |||
| Egypt | |||
| Morocco | |||
| Rest of Africa | |||


Market Definition
- Milk and White Chocolate - Milk chocolates is a solid chocolate made with milk (in the form of either milk powder, liquid milk, or condensed milk) and cocoa solids. White chocolate is made from cocoa butter and milk and contains no cocoa solids whatsoever. The scope includes regular chocolates, low-sugar, and sugar-free variants
- Toffees & Nougats - Toffees include hard, chewy, and small or one-bite candies marketed with labels as toffee or toffee-like confectionery. Nougat is a chewy confection with almond, sugar, and egg white as a basic ingredient; and it originated in Europe and Middle East countries.
- Cereals Bars - A snack composed of breakfast cereal that has been compressed into a bar shape and is held together with a form of edible adhesive. The scope includes snack bars made with cereals such as rice, oats, corn, etc. mixed with a binding syrup. These also include products labeled as cereal bars, cereal treat bars, or grain bars.
- Chewing Gum - This is a preparation for chewing, usually made of flavored and sweetened chicle or such substitutes as polyvinyl acetate. The types of chewing gums included in the scope are sugar-chewing gums and sugar-free chewing gums
| Keyword | Definition |
|---|---|
| Dark Chocolate | Dark chocolate is a form of chocolate containing cocoa solids and cocoa butter without the milk. |
| White Chocolate | White chocolate is the type of chocolate containing the highest percentage of milk solids, typically around or over 30 percent. |
| Milk Chocolate | Milk chocolate is made from dark chocolate that has a low cocoa solid content and higher sugar content, plus a milk product. |
| Hard Candy | A candy made of sugar and corn syrup boiled without crystallizing. |
| Toffees | A hard, chewy, often brown sweet that is made from sugar boiled with butter. |
| Nougats | A chewy or brittle candy containing almonds or other nuts and sometimes fruit. |
| Cereal bar | A cereal bar is a bar-shaped food product, made by pressing cereals and usually dried fruit or berries, which are in most cases held together by glucose syrup. |
| Protein bar | Protein bars are nutrition bars that contain a high proportion of protein to carbohydrates/fats. |
| Fruit & Nut bar | These are often based on dates with other dried fruit and nut additions and, in some cases, flavorings. |
| NCA | The National Confectioners Association is an American trade organization that promotes chocolate, candy, gum and mints, and the companies that make these treats. |
| CGMP | Current good manufacturing practices are those conforming to the guidelines recommended by relevant agencies. |
| Unstandardized foods | Unstandardized foods are those that do not have a standard of identity or that deviate from a prescribed standard in any manner. |
| GI | The glycemic index (GI) is a way of ranking carbohydrate-containing foods based on how slowly or quickly they are digested and increase blood glucose levels over a period of time |
| Skimmed milk powder | Skimmed milk powder is obtained by removing water from pasteurized skim milk by spray-drying. |
| Flavanols | Flavanols are a group of compounds found in cocoa, tea, apples, and many other plant-based foods and beverages. |
| WPC | Whey protein concentrate- the substance obtained by the removal of sufficient nonprotein constituents from pasteurized whey so that the finished dry product contains greater than 25% protein. |
| LDL | Low density Lipoprotein- the bad cholesterol |
| HDL | High density Lipoprotein- the good cholesterol |
| BHT | butylated Hydroxytoluene is a lab-made chemical that is added to foods as a preservative. |
| Carrageenan | Carrageenan is an additive used to thicken, emulsify, and preserve foods and drinks. |
| Free form | Not containing certain ingredients, such as gluten, dairy, or sugar. |
| Cocoa butter | It is a fatty substance obtained from cocoa beans, used in the manufacture of confectionery. |
| Pastellies | A type of of Brazilian candy made from sugar, eggs, and milk. |
| Draggees | Small, round candies that are coated with a hard sugar shell |
| CHOPRABISCO | Royal Belgian Association of the chocolate, pralines, biscuit, and confectionery industry- A trade association that represents the Belgian chocolate industry. |
| European Directive 2000/13 | A European Union directive that regulates the labeling of food products |
| Kakao-Verordnung | The German chocolate ordinance, a set of regulations that define what can be labeled as "chocolate" in Germany. |
| FASFC | Federal Agency for the Safety of the Food Chain |
| Pectin | A natural substance that is derived from fruits and vegetables. It is used in confectionery to create a gel-like texture. |
| Invert sugars | A type of sugar that is made up of glucose and fructose. |
| Emulsifier | A substance that helps to mix to liquids that does not mix together. |
| Anthocyanins | A type of flavonoid that is responsible for the red, purple, and blue colors of confectionery. |
| Functional Foods | Foods that have been modified to provide additional health benefits beyond basic nutrition. |
| Kosher certificate | This certification verifies that the ingredients, production process including all machinery, and/or food-service process complies with the standards of Jewish dietary law |
| Chicory root extract | A natural extract from the chicory root that is a good source of fiber, calcium, phosphorous, and folate |
| RDD | Recommended daily dose |
| Gummies | A chewy gelatin-based candy that is often flavored with fruit. |
| Nutraceuticals | Food or dietary supplements that are claimed to have health benefits. |
| Energy bars | Snack bars that are high in carbohydrates and calories are designed to provide energy on the go. |
| BFSO | Belgian Food Safety Organization for the food chain. |


Research Methodology
Mordor Intelligence follows a four-step methodology in all our reports.
- Step-1: Identify Key Variables: In order to build a robust forecasting methodology, the variables and factors identified in Step 1 are tested against available historical market numbers. Through an iterative process, the variables required for market forecast are set, and the model is built on the basis of these variables.
- Step-2: Build a Market Model: Market-size estimations for the forecast years are in nominal terms. Inflation is not a part of the pricing, and the average selling price (ASP) is kept constant throughout the forecast period for each country.
- Step-3: Validate and Finalize: In this important step, all market numbers, variables, and analyst calls are validated through an extensive network of primary research experts from the market studied. The respondents are selected across levels and functions to generate a holistic picture of the market studied.
- Step-4: Research Outputs: Syndicated Reports, Custom Consulting Assignments, Databases & Subscription Platforms


