Europe Biocontrol Agents Market Size and Share
Market Overview
| Study Period | 2018 - 2031 |
|---|---|
| Forecast Data Period | 2026 - 2031 |
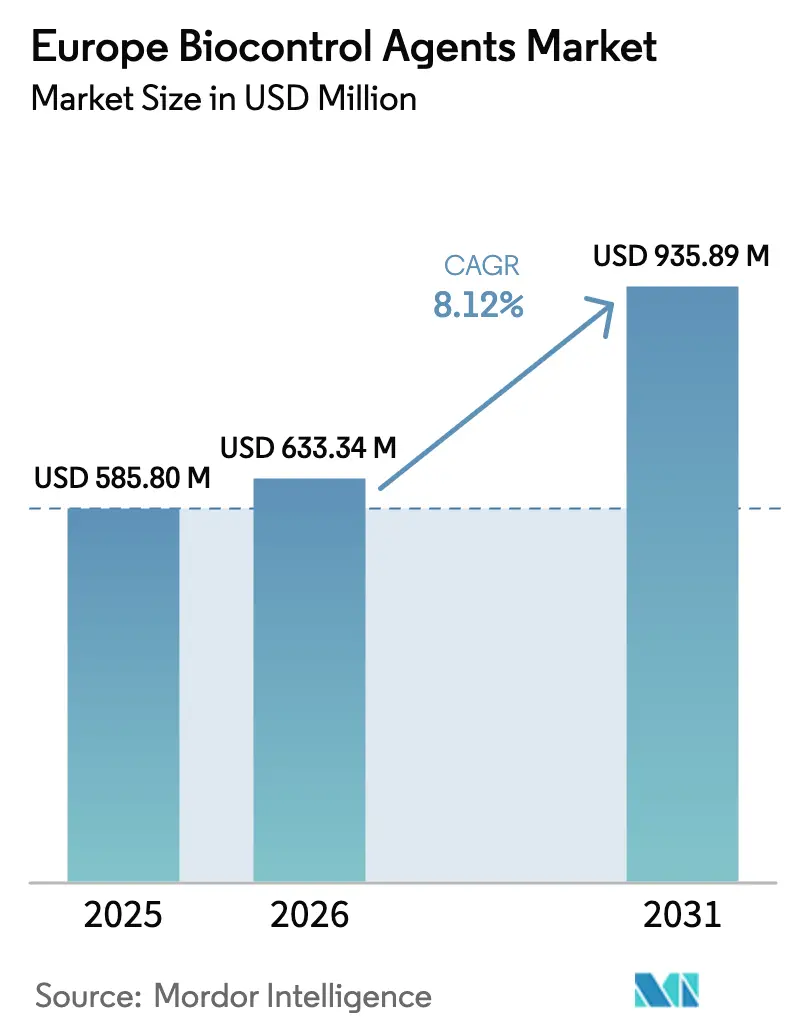
| Base Year Market Size (2025) | USD 585.8 Million |
| Market Size (2026) | USD 633.34 Million |
| Market Size (2031) | USD 935.89 Million |
| Growth Rate (2026 - 2031) | 8.12% CAGR |
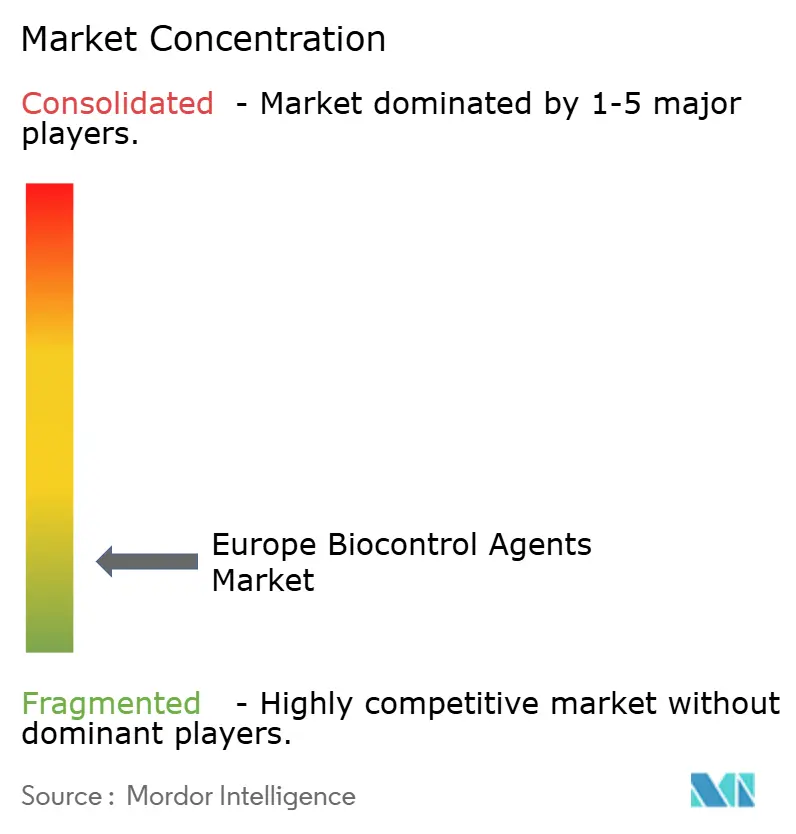
| Market Concentration | Low |
Major Players *Disclaimer: Major Players sorted in no particular order Image © Mordor Intelligence. Reuse requires attribution under CC BY 4.0. | |
Europe Biocontrol Agents Market Analysis by Mordor Intelligence
The Europe biocontrol agents market size was valued at USD 585.8 million in 2025 and estimated to grow from USD 633.34 million in 2026 to reach USD 935.89 million by 2031, at a CAGR of 8.12% during the forecast period (2026-2031). Heightened regulatory pressure against synthetic pesticides, led by the European Union’s restrictions on neonicotinoids and glyphosate, is accelerating adoption of biological alternatives and widening the addressable Europe biocontrol agents market.[1]Source: European Commission, “Neonicotinoids,” Food Safety, ec.europa.eu Rapid growth in organic farming acreage, which reached 16.9 million hectares in 2024, strengthens demand as growers seek certified residue-free solutions.[2]Source: European Commission, “Neonicotinoids,” Food Safety, ec.europa.eu Protected horticulture areas in the Netherlands and Spain offer ideal closed-environment conditions for beneficial insects and microbes, raising deployment success rates to 90% and above.[3]Source: Statistics Netherlands, “Greenhouse Horticulture Area Stable,” CBS, cbs.nl Advances in artificial-intelligence-guided release drones and sensor platforms further differentiate the Europe biocontrol agents industry by boosting field efficacy and lowering input costs, while Common Agricultural Policy eco-schemes help narrow price gaps with chemical products through per-hectare subsidies.
Key Report Takeaways
- By form, macrobials led with 98.15% revenue share in 2025 and will advance at an 8.21% CAGR through 2031, underscoring their entrenched role in the Europe biocontrol agents market.
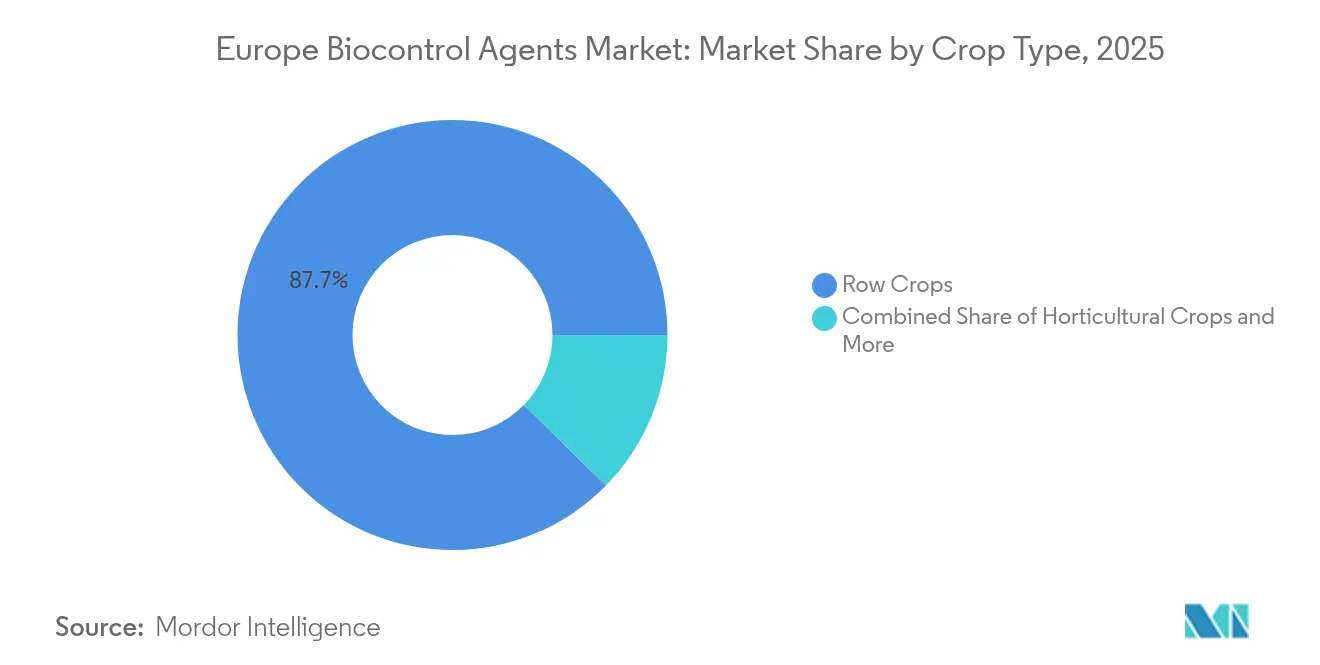
- By crop type, row crops accounted for 87.65% of the Europe biocontrol agents market size in 2025, while horticultural crops are projected to grow at a 10.56% CAGR to 2031 as greenhouse investments accelerate.
- By geography, Russia commanded 55.25% of the Europe biocontrol agents market share in 2025, whereas Germany is set to expand at a 8.74% CAGR over 2026-2031 on the back of its National Action Plan for sustainable crop protection.
Note: Market size and forecast figures in this report are generated using Mordor Intelligence’s proprietary estimation framework, updated with the latest available data and insights as of 2026.
Europe Biocontrol Agents Market Trends and Insights
Drivers Impact Analysis*
| Driver | (~) % Impact on CAGR Forecast | Geographic Relevance | Impact Timeline |
|---|---|---|---|
| Stringent European Union ban on chemical pesticides | +2.1% | European Union-wide, strongest in Germany, France, Netherlands | Medium term (2-4 years) |
| Growing organic farming acreage in Europe | +1.8% | Austria, Denmark, Sweden leading, expanding to Eastern Europe | Long term (≥ 4 years) |
| Favorable Common Agricultural Policy (CAP) subsidies for sustainable inputs | +1.4% | European Union member states, particularly beneficial for smaller farms | Short term (≤ 2 years) |
| Rapid expansion of protected horticulture | +1.2% | Netherlands, Spain, Belgium, expanding to Poland, Romania | Medium term (2-4 years) |
| AI-driven precision release drones for beneficial insects | +0.9% | Advanced markets: Netherlands, Germany, France | Long term (≥ 4 years) |
| Biotech start-ups commercializing phage-based bio-insecticides | +0.8% | Innovation hubs: Netherlands, Germany, United Kingdom, France | Long term (≥ 4 years) |
| Source: Mordor Intelligence | |||
Growing Organic Farming Acreage in Europe
Certified organic land reached 16.9 million hectares in 2024, equal to 9.1% of total farmland. Austria leads with a 26.5% share, followed by Estonia at 25.4% and Sweden at 20.8%, making these countries living laboratories for biological control programs. Retailers pay 20-40% price premiums for organic produce, which offsets higher input costs and strengthens purchasing power for growers. The European Green Deal’s Farm to Fork roadmap aims for 25% organic acreage by 2030, a policy shift that could triple biological demand. These dynamics create a predictable pipeline for manufacturers expanding their share of the Europe biocontrol agents market.
Favorable Common Agricultural Policy (CAP) Subsidies for Sustainable Inputs
The Common Agricultural Policy 2023-2027 period allocates EUR 387 billion (USD 419 billion) to direct payments and rural funds, with up to 25% reserved for eco-schemes supporting integrated pest management. Member states offer EUR 50-150 per hectare (USD 54-162 per hectare) to farms using approved biological agents, trimming cost barriers by as much as 50%. Germany introduced top-up payments for operations that certify full biocontrol programs, while France links subsidies to documented pesticide reductions. These measures rapidly improve the price competitiveness of biological products against chemical standards. Subsidy certainty also helps producers finance additional capacity, which broadens product availability across the Europe biocontrol agents market.
Rapid Expansion of Protected Horticulture
Protected cultivation covered 285,000 hectares in 2024, led by the Netherlands at 10,500 hectares and Spain’s Almería region, adding 2,000 hectares each year. Greenhouse environments enable 85-90% pest control efficacy with beneficial insects compared with 60-70% in open fields, translating into strong grower confidence. Automated climate systems maintain optimal humidity and temperature, conditions that lengthen the active life of predators and parasitoids. Rising energy efficiency and water-saving technologies push more vegetable production under glass in Poland and Romania. Each hectare moving into protected cultivation raises the attach rate for biological inputs, further scaling revenues in the Europe biocontrol agents market.
AI-Driven Precision Release Drones for Beneficial Insects
New drone platforms pair multispectral cameras with real-time algorithms to map pest hot spots and dispatch macro-predators only where needed. Early adopters in Netherlands and Germany report 30% lower unit costs and improved establishment rates compared with manual distribution. The technology reduces labor demand during peak seasons, helping offset Europe’s rising wage pressures. Fine-tuned releases also limit non-target impacts, a factor that reassures regulators and retailers alike. Vendors embedding these tools into service packages gain clear competitive differentiation within the Europe biocontrol agents market.
Restraints Impact Analysis*
| Restraint | (~) % Impact on CAGR Forecast | Geographic Relevance | Impact Timeline |
|---|---|---|---|
| Lengthy European Union-wide mutual recognition registration process | -1.9% | European Union-wide, particularly affecting smaller biocontrol companies | Medium term (2-4 years) |
| Limited farmer awareness outside north-western Europe | -1.5% | Eastern Europe, Southern Italy, rural Spain, Portugal | Short term (≤ 2 years) |
| Shelf-life and cold-chain constraints for macrobials | -1.2% | Distribution-intensive markets: Russia, Turkey, remote regions | Short term (≤ 2 years) |
| Uncertain performance in extreme climatic variability | -0.8% | Mediterranean regions, areas with increasing weather volatility | Long term (≥ 4 years) |
| Source: Mordor Intelligence | |||
Lengthy European Union-Wide Mutual Recognition Registration Process
Approvals under Regulation 1107/2009 often take 7-9 years and cost EUR 2-5 million (USD 2.2-5.4 million) per active ingredient. This timeline is three times longer than pathways in Brazil and the United States, delaying cash flows for innovative firms. Smaller biotechnology start-ups face disproportionate hurdles because they lack the regulatory staff and capital reserves of larger competitors. The European Commission’s 2024 strategic dialogue proposed a fast-track route for low-risk biological substances, but member state resistance clouds timing of any reforms. Until streamlined rules materialize, slow approvals continue to dampen potential growth within the Europe biocontrol agents market.
Limited Farmer Awareness Outside North-Western Europe
While adoption in Netherlands, Belgium, and Denmark exceeds 40%, penetration lingers below 15% in many Eastern and Mediterranean regions. Public extension services in Romania and Bulgaria dedicate less than 5% of training budgets to biological crop protection, limiting knowledge transfer. Chemical suppliers fill the information vacuum and reinforce grower reliance on familiar synthetics. Language gaps also constrain uptake because most manuals and labels remain in English or German. Until national programs fund specialized advisory networks, uneven awareness will restrain expansion of the Europe biocontrol agents market.
*Our forecasts treat driver/restraint impacts as directional, not additive. The impact forecasts reflect baseline growth, mix effects, and variable interactions.
Segment Analysis
By Form: Macrobials sustain clear dominance while microbials gather speed
Macrobials accounted for 98.15% of the Europe biocontrol agents market share in 2025, confirming their entrenched role in field and protected systems. The segment is advancing at an 8.21% CAGR through 2031 as continuous improvements in mass-rearing and packaging maintain high survival rates from rearing facility to farm gate. Entomopathogenic nematodes such as Steinernema and Heterorhabditis species lead soil-pest programs in potato and vegetable crops across Northern Europe, delivering reliable wireworm and fungus gnat suppression. Parasitoid wasps including Trichogramma and Aphidius species dominate greenhouse releases where tight climate control boosts establishment success above 90%. The wide dealer network built over three decades ensures weekly availability of fresh organisms, which counters perishability concerns in core markets such as Germany, France, and the Netherlands.
Microbials presently occupy a small revenue base but are expanding faster than the macro segment as formulation science unlocks longer shelf life and broader pest spectrums. The European Food Safety Authority’s streamlined low-risk pathway cut microbial approval time to near five years, spurring new launches of Bacillus thuringiensis strains for caterpillar control and Pseudomonas-based seed treatments for soilborne diseases. Fungal products built on Trichoderma and Beauveria bassiana now move from niche organics into mainstream fruit programs where residue-sensitive retailers push for zero detectable chemicals. Because most new registrations target high-value crops, microbials enhance the Europe biocontrol agents market size disproportionately to their volume footprint. Growing venture funding for phage-based bio-insecticides signals additional microbial momentum that will widen the addressable acreage after 2026.


By Crop Type: Row crops keep scale leadership while horticulture accelerates
Row crops commanded 87.65% of the Europe biocontrol agents market size in 2025, a position earned through sheer acreage in cereals and oilseeds across France, Germany, and Poland. Widespread Trichogramma releases in wheat and barley, coupled with microbial seed dressings in rapeseed, drive repeat purchases that lock in demand even as chemical options tighten. Integration with drone-guided distribution has trimmed labor costs by 25% on expansive Eastern European farms, ensuring cost parity with reduced-dose synthetic programs. National protein-crop plans that promote soybean and field pea acreage introduce symbiotic rhizobia inoculants that fit naturally with biological insect regimes, further bolstering volumes.
Horticultural crops are forecast to grow at a 10.56% CAGR to 2031, the fastest in the Europe biocontrol agents market, underpinned by protected-environment vegetables and premium fruit exports. Dutch tomato and cucumber growers already replace 90-95% of former chemical sprays with multi-agent biological programs that merge predators, parasitoids, and microbial biopesticides in the same rotation. Spain’s Almería greenhouses add 2,000 hectares each year, immediately adopting full biological packages to comply with retailer residue limits. Apple and pear orchards in France deploy mating disruption and predatory bugs to cut synthetic insecticides by half while safeguarding export access to residue-sensitive markets such as Germany and Scandinavia. As greenhouse acreage migrates east into Poland and Romania, each added hectare creates a recurrent revenue stream for suppliers, reinforcing momentum across the Europe biocontrol agents market.
Geography Analysis
Russia remained the largest national contributor with 55.25% Europe biocontrol agents market share in 2025, reflecting the country’s vast 47 million-hectare cereal belt and federal subsidies that cover up to 70% of biological input costs for certified farms. Government import-substitution mandates reduced chemical crop-protection imports and created opportunities for domestic biocontrol production. As a result, the increased adoption of Trichogramma cards and nematode granules boosted growers' confidence in the ability of local supply chains to meet demand. The program’s stability supports a positive outlook, with Russia anticipated to maintain the largest biocontrol agents market size in Europe over the forecast period.
Germany delivered the fastest expansion pace and is forecast to sustain a 8.74% CAGR through 2031, powered by the National Action Plan that targets a 50% pesticide reduction by 2030. Federal and state authorities fund public-private research hubs such as the Julius Kühn Institute, which commercialize precision-guidance tools for macro predator releases. German growers adopt these tools rapidly because a significant portion of farms already operate GPS guidance that syncs with biological application maps, keeping costs on par with restrained synthetic programs. Strong extension support lifts adoption in vegetables and field crops, reinforcing the dynamism of the Germany-based portion of the Europe biocontrol agents market.
France, Italy, and the Netherlands together account for a significant share, and each country leverages distinct policy levers that favor biological inputs. France ties ECOPHYTO grant payments to verifiable chemical-use cuts, which elevates biocontrol as the default compliance path for wine, apple, and field-crop farmers. Italy relies on its substantial organic land base to pull demand for microbial fungicides and beneficial insects that satisfy export residue limits. The Netherlands maintains technological leadership in protected horticulture, where almost every square meter of the greenhouse cluster integrates continuous predator and parasitoid programs with climate sensors. These three markets, although smaller than Russia by acreage, deliver outsized revenue growth and significantly expand the aggregate Europe biocontrol agents market size by 2031.
Competitive Landscape
The European biocontrol agents market is highly fragmented, with the top five producers together holding a significant share of 2024 revenue. Koppert B.V., Biobest Group NV, Bioline AgroSciences Ltd (Eurazeo), Bioplanet France, and E-NEMA GmbH lead because they combine broad product portfolios with nationwide advisory teams that drive on-farm integration of multiple biological modes of action. Smaller regional firms thrive by tailoring native predator strains and locally isolated microbes to specific climate zones, which allows faster registration within national reference laboratories. As a result, local suppliers often defend pockets of share in Eastern Europe and Mediterranean fruit belts where microclimates differ sharply from Northern conditions. This regional fragmentation limits the pricing power of large multinationals and supports competitive parity across product categories.
Innovation intensity is rising, shown by a 35% uptick in biocontrol patent applications at the European Patent Office during 2024. Technology differentiation centers on formulation stability, AI-supported application hardware, and novel biological targets such as phage-based insect control. Syngenta won the first European Union authorization for a bacteriophage bio-insecticide that maintains full efficacy for two weeks in field vegetables. Koppert B.V. commissioned a new macrobial rearing facility in Poland that includes automated feeding and sorting, which trims unit costs by 20% and improves batch consistency. Biobest rolled out sensor-driven release devices that pair with decision dashboards to cut over-application and maximize predator survival during dispatch.
Acquisitions and strategic alliances accelerate portfolio breadth because lengthy regulatory timelines penalize greenfield development. BASF SE purchased BioCeres Crop Solutions’ European assets and gained immediate entry into microbial fungicides and seed treatment lines for cereals and vegetables. Certis Biologicals opened a USD 43 million research center in the Netherlands and partnered with Wageningen University to develop climate-resilient predators and fungi. Andermatt used initial public offering proceeds to expand direct sales channels, which improves technical support for growers and builds loyalty. These moves reflect a race to bundle products with data-rich advisory services, positioning suppliers to capture cross-selling opportunities in the Europe biocontrol agents market.
Europe Biocontrol Agents Industry Leaders
Koppert B.V.
Bioline AgroSciences Ltd (Eurazeo)
Biobest Group NV
E-NEMA GmbH
Bioplanet France
- *Disclaimer: Major Players sorted in no particular order

Recent Industry Developments
- June 2025: Corteva Agriscience and Micropep announced a multi-year partnership to co-develop sustainable biocontrol solutions utilizing Micropep’s peptide-based technology. The partnership focuses on advancing next-generation biological crop protection products for European and global markets.
- March 2025: Certis Biologicals announced that its product NemaClean, a biocontrol nematicide derived from the fungus Purpureocillium lilacinum strain PL11, received its first EU authorization in the Netherlands. This approval permits its application in cucurbits and solanaceous crops, representing a key milestone for Certis in enhancing its biological product portfolio in Europe.
- February 2025: The International Biocontrol Manufacturers Association (IBMA), which includes members such as e-nema GmbH, welcomed the European Union's renewed commitment in 2025 to enhance access and regulatory support for biocontrol solutions. This initiative reflects increased EU support for sustainable crop protection and the broader adoption of biological control agents.


Europe Biocontrol Agents Market Report Scope
Macrobials, Microbials are covered as segments by Form. Cash Crops, Horticultural Crops, Row Crops are covered as segments by Crop Type. France, Germany, Italy, Netherlands, Russia, Spain, Turkey, United Kingdom are covered as segments by Country.| Macrobials | By Organism | Entamopathogenic Nematodes |
| Parasitoids | ||
| Predators | ||
| Microbials | By Organism | Bacterial Biocontrol Agents |
| Fungal Biocontrol Agents | ||
| Other Microbials |
| Cash Crops |
| Horticultural Crops |
| Row Crops |
| France |
| Germany |
| Italy |
| Netherlands |
| Russia |
| Spain |
| Turkey |
| United Kingdom |
| Rest of Europe |
| Form | Macrobials | By Organism | Entamopathogenic Nematodes |
| Parasitoids | |||
| Predators | |||
| Microbials | By Organism | Bacterial Biocontrol Agents | |
| Fungal Biocontrol Agents | |||
| Other Microbials | |||
| Crop Type | Cash Crops | ||
| Horticultural Crops | |||
| Row Crops | |||
| Geography | France | ||
| Germany | |||
| Italy | |||
| Netherlands | |||
| Russia | |||
| Spain | |||
| Turkey | |||
| United Kingdom | |||
| Rest of Europe | |||


Market Definition
- AVERAGE DOSAGE RATE - The average application rate is the average volume of biocontrol agents applied per hectare of farmland in the respective region/country.
- CROP TYPE - Crop type includes Row crops (Cereals, Pulses, Oilseeds), Horticultural Crops (Fruits and vegetables) and Cash Crops (Plantation Crops, Fibre Crops and Other Industrial Crops)
- FUNCTION - The Crop Protection function of agirucultural biological include products that prevent or control various biotic and abiotic stress.
- TYPE - Biocontrol agents are the natural predators and parasitoids used to control various pests. Biocontrol agents include both microbials (Microorganisms) and macrobials (Insects).
| Keyword | Definition |
|---|---|
| Cash Crops | Cash crops are non-consumable crops sold as a whole or part of the crop to manufacture end-products to make a profit. |
| Integrated Pest Management (IPM) | IPM is an environment-friendly and sustainable approach to control pests in various crops. It involves a combination of methods, including biological controls, cultural practices, and selective use of pesticides. |
| Bacterial biocontrol agents | Bacteria used to control pests and diseases in crops. They work by producing toxins harmful to the target pests or competing with them for nutrients and space in the growing environment. Some examples of commonly used bacterial biocontrol agents include Bacillus thuringiensis (Bt), Pseudomonas fluorescens, and Streptomyces spp. |
| Plant Protection Product (PPP) | A plant protection product is a formulation applied to crops to protect from pests, such as weeds, diseases, or insects. They contain one or more active substances with other co-formulants such as solvents, carriers, inert material, wetting agents or adjuvants formulated to give optimum product efficacy. |
| Pathogen | A pathogen is an organism causing disease to its host, with the severity of the disease symptoms. |
| Parasitoids | Parasitoids are insects that lay their eggs on or within the host insect, with their larvae feeding on the host insect. In agriculture, parasitoids can be used as a form of biological pest control, as they help to control pest damage to crops and decrease the need for chemical pesticides. |
| Entomopathogenic Nematodes (EPN) | Entomopathogenic nematodes are parasitic roundworms that infect and kill pests by releasing bacteria from their gut. Entomopathogenic nematodes are a form of biocontrol agents used in agriculture. |
| Vesicular-arbuscular mycorrhiza (VAM) | VAM fungi are mycorrhizal species of fungus. They live in the roots of different higher-order plants. They develop a symbiotic relationship with the plants in the roots of these plants. |
| Fungal biocontrol agents | Fungal biocontrol agents are the beneficial fungi that control plant pests and diseases. They are an alternative to chemical pesticides. They infect and kill the pests or compete with pathogenic fungi for nutrients and space. |
| Biofertilizers | Biofertilizers contain beneficial microorganisms that enhance soil fertility and promote plant growth. |
| Biopesticides | Biopesticides are natural/bio-based compounds used to manage agricultural pests using specific biological effects. |
| Predators | Predators in agriculture are the organisms that feed on pests and help control pest damage to the crops. Some common predator species used in agriculture include ladybugs, lacewings, and predatory mites. |
| Biocontrol agents | Biocontrol agents are living organisms used to control pests and diseases in agriculture. They are alternatives to chemical pesticides and are known for their lesser impact on the environment and human health. |
| Organic Fertilizers | Organic fertilizer is composed of animal or vegetable matter used alone or in combination with one or more non-synthetically derived elements or compounds used for soil fertility and plant growth. |
| Protein hydrolysates (PHs) | Protein hydrolysate-based biostimulants contain free amino acids, oligopeptides, and polypeptides produced by enzymatic or chemical hydrolysis of proteins, primarily from vegetal or animal sources. |
| Biostimulants/Plant Growth Regulators (PGR) | Biostimulants/Plant Growth Regulators (PGR) are substances derived from natural resources to enhance plant growth and health by stimulating plant processes (metabolism). |
| Soil Amendments | Soil Amendments are substances applied to soil that improve soil health, such as soil fertility and soil structure. |
| Seaweed Extract | Seaweed extracts are rich in micro and macronutrients, proteins, polysaccharides, polyphenols, phytohormones, and osmolytes. These substances boost seed germination and crop establishment, total plant growth and productivity. |
| Compounds related to biocontrol and/or promoting growth (CRBPG) | Compounds related to biocontrol or promoting growth (CRBPG) are the ability of a bacteria to produce compounds for phytopathogen biocontrol and plant growth promotion. |
| Symbiotic Nitrogen-Fixing Bacteria | Symbiotic nitrogen-fixing bacteria such as Rhizobium obtain food and shelter from the host, and in return, they help by providing fixed nitrogen to the plants. |
| Nitrogen Fixation | Nitrogen fixation is a chemical process in soil which converts molecular nitrogen into ammonia or related nitrogenous compounds. |
| ARS (Agricultural Research Service) | ARS is the U.S. Department of Agriculture's chief scientific in-house research agency. It aims to find solutions to agricultural problems faced by the farmers in the country. |
| Phytosanitary Regulations | Phytosanitary regulations imposed by the respective government bodies check or prohibit the importation and marketing of certain insects, plant species, or products of these plants to prevent the introduction or spread of new plant pests or pathogens. |
| Ectomycorrhizae (ECM) | Ectomycorrhiza (ECM) is a symbiotic interaction of fungi with the feeder roots of higher plants in which both the plant and the fungi benefit through the association for survival. |


Research Methodology
Mordor Intelligence follows a four-step methodology in all our reports.
- Step-1: Identify Key Variables: In order to build a robust forecasting methodology, the variables and factors identified in Step-1 are tested against available historical market numbers. Through an iterative process, the variables required for market forecast are set and the model is built on the basis of these variables.
- Step-2: Build a Market Model: Market-size estimations for the forecast years are in nominal terms. Inflation is not a part of the pricing, and the average selling price (ASP) is kept constant throughout the forecast period.
- Step-3: Validate and Finalize: In this important step, all market numbers, variables and analyst calls are validated through an extensive network of primary research experts from the market studied. The respondents are selected across levels and functions to generate a holistic picture of the market studied.
- Step-4: Research Outputs: Syndicated Reports, Custom Consulting Assignments, Databases & Subscription Platforms.


