Market Overview
| Study Period | 2018 - 2031 |
|---|---|
| Forecast Data Period | 2026 - 2031 |
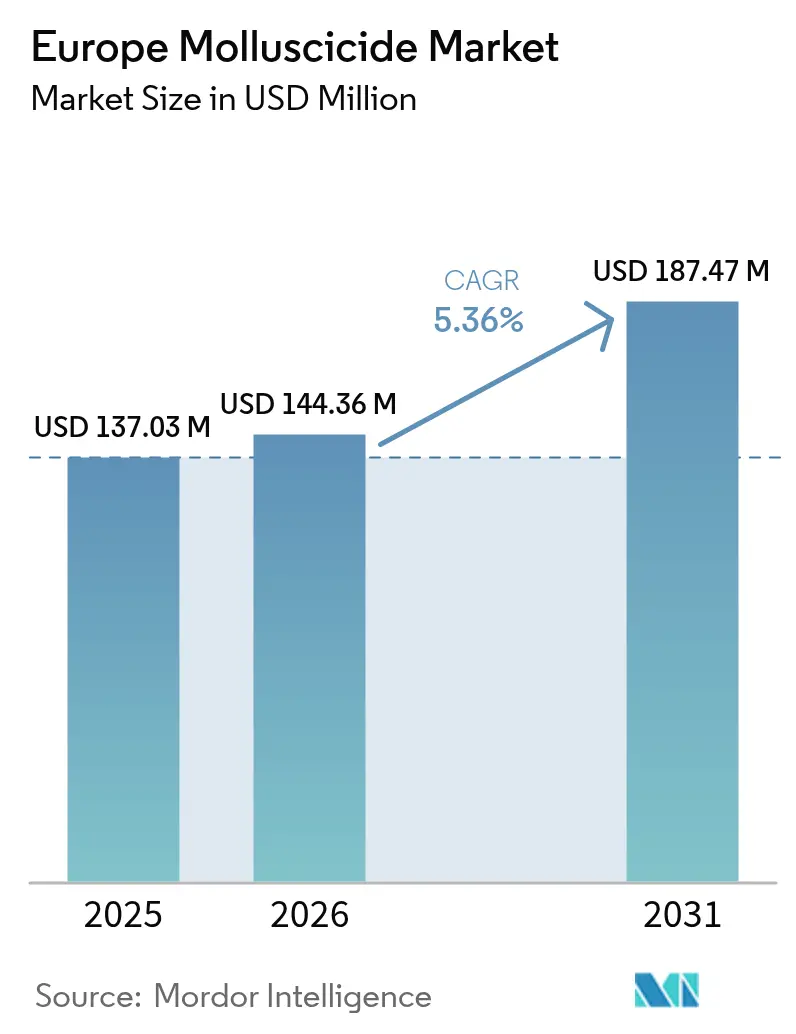
| Base Year Market Size (2025) | USD 137.03 Million |
| Market Size (2026) | USD 144.36 Million |
| Market Size (2031) | USD 187.47 Million |
| Growth Rate (2026 - 2031) | 5.36% CAGR |
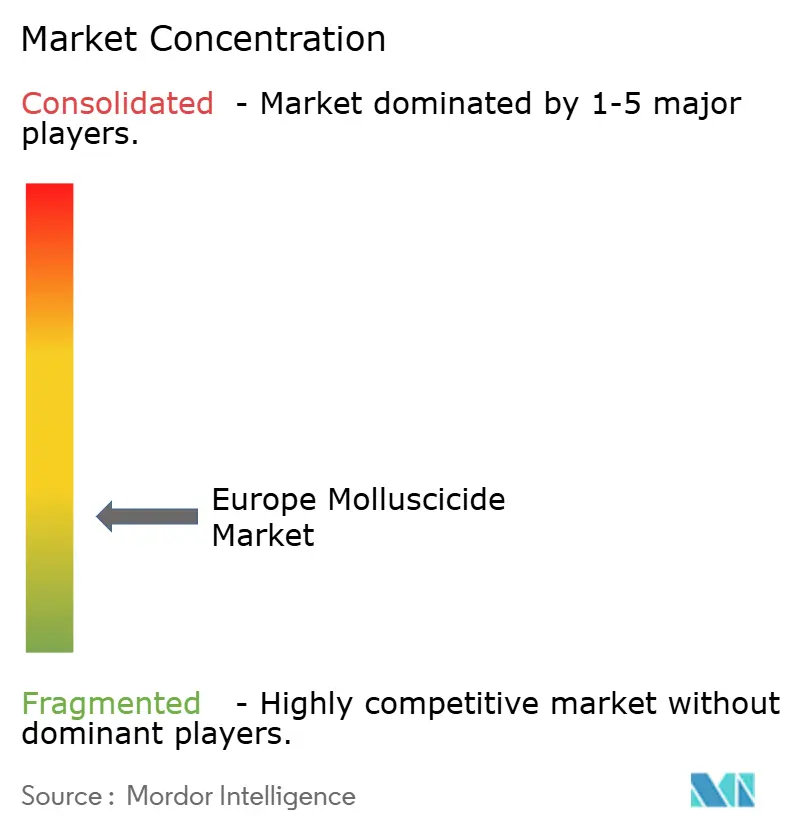
| Market Concentration | Low |
Major Players *Disclaimer: Major Players sorted in no particular order Image © Mordor Intelligence. Reuse requires attribution under CC BY 4.0. | |
Europe Molluscicide Market Analysis by Mordor Intelligence
The Europe molluscicide market size in 2026 is estimated at USD 144.36 million, growing from 2025 value of USD 137.03 million with 2031 projections showing USD 187.47 million, growing at 5.36% CAGR over 2026-2031. This growth trajectory reflects the continent's agricultural sector grappling with intensifying slug and snail pressure amid wetter spring seasons, while simultaneously navigating the European Union 2026 phase-out mandate for metaldehyde. The regulatory transition creates both disruption and opportunity, as iron-phosphate formulations gain traction across organic farming segments and precision agriculture technologies reduce application costs by up to 40% [1]Source: Agriculture and Horticulture Development Board, “Integrated Slug Control,” ahdb.org.uk . Consolidation remains limited due to national registration rules that differ across Europe, leaving room for new biological and robotic solutions. Raw-material cost swings for iron phosphate and retailer moves toward chemical-free produce pose near-term headwinds, RNA interference research and autonomous granular robots support the long-term trajectory.
Key Report Takeaways
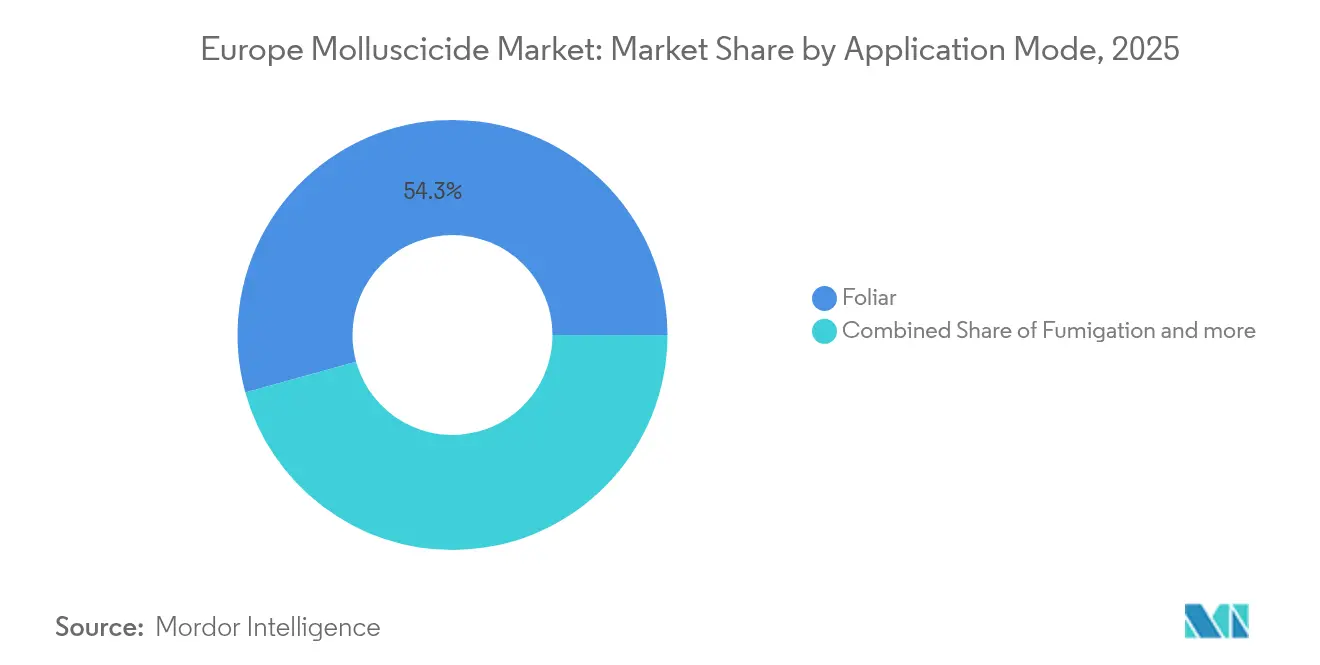
- By application mode, foliar treatments led with 54.30% of Europe molluscicide market share in 2025 and are poised to progress at a 5.47% CAGR through 2031.
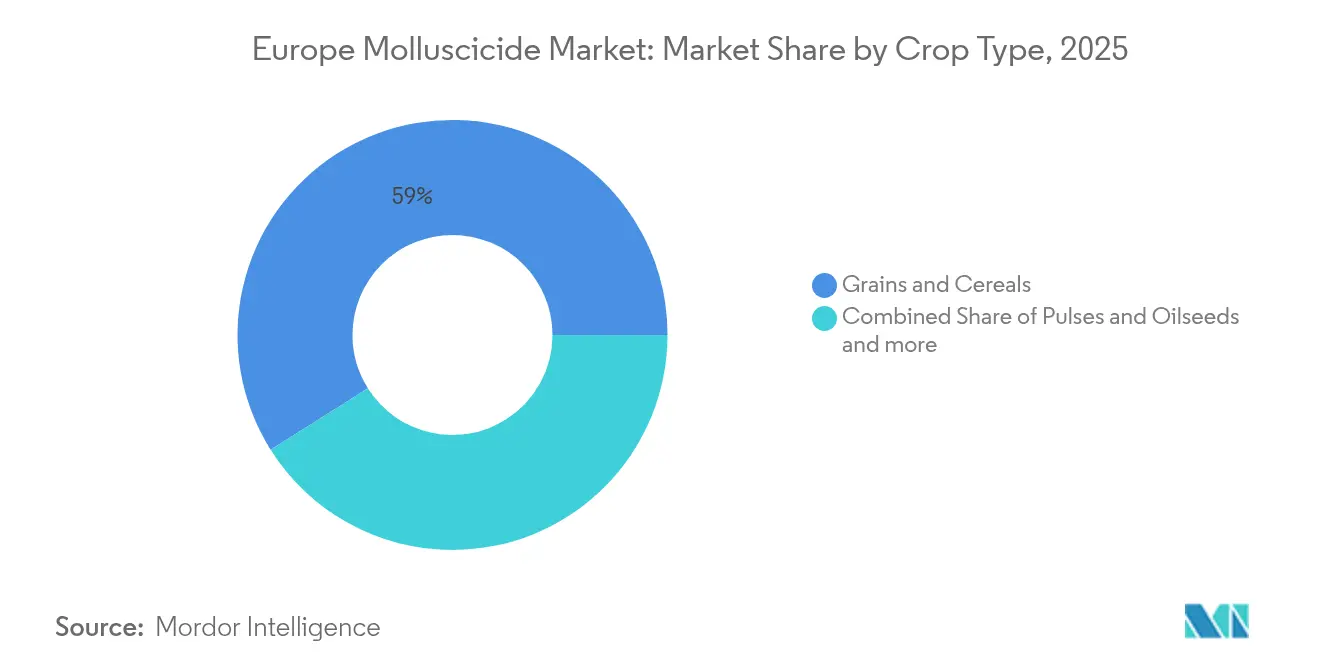
- By crop type, grains and cereals accounted for 58.95% of the Europe molluscicide market size in 2025, while pulses and oilseeds are forecast to grow at a 5.41% CAGR between 2026 and 2031.
- By geography, France held 14.65% of Europe molluscicide market share in 2025, whereas Russia is projected to expand at the fastest 8.05% CAGR to 2031.
Note: Market size and forecast figures in this report are generated using Mordor Intelligence’s proprietary estimation framework, updated with the latest available data and insights as of 2026.
Europe Molluscicide Market Trends and Insights
Drivers Impact Analysis*
| Driver | (~) % Impact on CAGR Forecast | Geographic Relevance | Impact Timeline |
|---|---|---|---|
| Surge in slug and snail infestations after wetter spring seasons | +1.2% | Western Europe's core, spillover to Central Europe | Short term (≤ 2 years) |
| Integrated pest-management mandates boosting targeted molluscicide usage | +0.9% | European Union-wide, strongest in France and Germany | Medium term (2-4 years) |
| Regulatory approval of iron-phosphate formulations expanding addressable acreage | +0.8% | European Union organic farming regions, Netherlands leadership | Medium term (2-4 years) |
| Precision granular-broadcast robots lowering labor cost and boosting adoption | +0.6% | Northern Europe, early gains in the Netherlands and Germany | Long term (≥ 4 years) |
| RNA-interference based mollusk control technologies entering pilot trials | +0.4% | European Union research hubs, field trials in France and Germany | Long term (≥ 4 years) |
| Greenhouse demand for drip-compatible liquid molluscicides in high-value crops | +0.5% | Mediterranean Europe, Netherlands, protected cultivation | Medium term (2-4 years) |
| Source: Mordor Intelligence | |||


Surge in Slug and Snail Infestations After Wetter Spring Seasons
Climate-driven moisture patterns across Europe are fundamentally reshaping mollusk population dynamics, with spring precipitation increases of 15-20% in key agricultural regions creating optimal breeding conditions for gastropod pests. The European Environment Agency's 2024 climate assessment documents how shifting precipitation patterns concentrate rainfall into shorter, more intense periods, creating the prolonged soil moisture conditions that trigger explosive slug reproduction cycles [2]Source: European Environment Agency, “European Climate Risk Assessment,” eea.europa.eu . This climatic shift particularly impacts cereal production zones across Northern France, Germany, and the UK, where traditional pest management calendars no longer align with peak infestation periods. The European molluscicide market, therefore, leans on predictive analytics to synchronize applications with peak gastropod activity.
Integrated Pest-Management Mandates Boosting Targeted Molluscicide Usage
The European Union Farm to Fork Strategy implementation through national IPM frameworks is paradoxically driving more sophisticated molluscicide usage rather than blanket reductions, as farmers seek targeted solutions that comply with pesticide reduction goals while maintaining yield protection. Germany's National Action Plan on Plant Protection, updated in 2024, specifically mandates threshold-based molluscicide applications integrated with cultural and biological controls, creating demand for precision formulations and application technologies. This regulatory architecture increases the European molluscicide market penetration of higher-margin precision products and reduces indiscriminate metaldehyde broadcast.
Regulatory Approval of Iron-Phosphate Formulations Expanding Addressable Acreage
Iron-phosphate molluscicides are unlocking previously inaccessible segments of organic farming and environmentally sensitive areas, with ADAMA's new Feralla active ingredient receiving European Union registration in 2024 for use in organic production systems. The compound carries no buffer-zone water restrictions and gains acceptance within 50 meters of organic plots, adding an estimated 25% more eligible farmland. Organic lettuce and brassica growers, who often endured 40% field losses, nowadays adopt bait stations that degrade into iron and phosphate nutrients. Demand also rises in riparian zones where metaldehyde runoff once breached water-quality limits. The European molluscicide market thus pivots toward lower-toxicity chemistry that aligns with eco-scheme audits and retailer residue standards.
Precision Granular-Broadcast Robots Lowering Labor Cost and Boosting Adoption
Autonomous field robots equipped with GPS-guided granular application systems are transforming molluscicide deployment economics, reducing labor costs by 40% while improving placement accuracy and reducing active ingredient usage per hectare. The UK's Agriculture and Horticulture Development Board documented how precision robots enable targeted bait placement along crop rows and field margins where slug activity concentrates, rather than blanket field applications that waste product and increase environmental exposure. As autonomy spreads, the Europe molluscicide market gains from a service model in which robotics firms partner with agrochemical distributors on pay-per-hectare contracts.
Restraints Impact Analysis*
| Restraint | (~) % Impact on CAGR Forecast | Geographic Relevance | Impact Timeline |
|---|---|---|---|
| Europe phase-out of metaldehyde creating registration uncertainty | -0.7% | European Union-wide, the strongest impact was in the United Kingdom and France | Short term (≤ 2 years) |
| Rising consumer demand for chemical-free produce | -0.5% | Western Europe retail markets | Medium term (2-4 years) |
| Predator-beetle conservation programs lowering pest pressure | -0.3% | Agro-ecological zones in France and Germany | Long term (≥ 4 years) |
| Iron-phosphate raw-material price volatility squeezing margins | -0.4% | Global supply chains affecting European Union manufacturers | Short term (≤ 2 years) |
| Source: Mordor Intelligence | |||
Europe Phase-Out of Metaldehyde Creating Registration Uncertainty
Metaldehyde sales licenses are set to lapse in 2026, forcing companies to shift their inventory while navigating transitional label rules. United Kingdom growers experienced supply gaps in 2024 once early restrictions tightened water-quality thresholds, prompting emergency ferric phosphate authorizations [3]Source: Agriculture and Horticulture Development Board, “Integrated Slug Control,” ahdb.org.uk . Small manufacturers face high dossier costs when reformulated, which raises the exit risk. Distributors must stock dual chemistries for the interim, adding logistics complexity. The European molluscicide market, therefore, bears compliance costs that erode near-term margins yet accelerate the shift toward greener actives.
Rising Consumer Demand for Chemical-Free Produce
Supermarkets in Germany, France, and the Netherlands expand zero-pesticide labels that exclude synthetic slug baits. Growers supplying these chains are pivoting toward mechanical traps or biological nematodes, thereby reducing chemical throughput. Although premium prices offset part of the revenue loss, the overall European molluscicide market volume dips as certification uptake rises. Suppliers respond with carbon-neutral bait lines and recyclable packaging to align with retail scorecards, but adoption varies across regions.
*Our forecasts treat driver/restraint impacts as directional, not additive. The impact forecasts reflect baseline growth, mix effects, and variable interactions.
Segment Analysis
By Application Mode: Foliar Applications Drive Market Leadership
Foliar application mode commands 54.30% market share in 2025, with growth projected at 5.47% CAGR through 2031, reflecting its compatibility with existing spray infrastructure and integrated pest management protocols. The dominance stems from the ability of foliar applications to target both adult slugs and juvenile stages simultaneously, while enabling tank-mixing with fungicides and insecticides during routine crop protection programs.
The segment's dominance is further reinforced by its superior performance in providing precise control of mollusks directly onto the foliage, ensuring effective reach to pest populations while minimizing exposure to non-target organisms. The foliar application method is particularly favored due to its long-lasting effect, with active ingredients adhering to plant surfaces and providing residual protection against mollusks for extended periods. Additionally, the segment is experiencing the fastest growth rate in the market, driven by increasing adoption among farmers due to its proven efficacy and ease of application across different crop types.


By Crop Type: Grains and Cereals Dominate Usage Patterns
Grains and cereals capture 58.95% market share in 2025, driven by extensive slug damage in wheat, barley, and oat production systems across Northern European agricultural zones. The segment's growth is particularly driven by the need for effective pest management solutions in wheat cultivation, as slugs can cause significant damage to newly planted seeds and seedlings. The adoption of advanced agricultural pesticide formulations, particularly those based on ferric phosphate, is likely to accelerate as farmers seek more environmentally sustainable yet effective solutions for protecting their grain crops from mollusk damage.
Pulses and oilseeds emerge as the fastest-growing segment, with a 5.41% CAGR, reflecting the expansion of rapeseed and sunflower cultivation in Eastern Europe, where climate shifts favor these crop rotations. The pulses & oilseeds segment is particularly significant due to the growing demand for rapeseed and the critical need for mollusk management in these crops. European Union common Agricultural Policy reforms in 2024 incentivize crop diversification through eco-scheme payments, potentially shifting molluscicide demand toward pulse and oilseed segments as farmers adopt more complex rotations.
Geography Analysis
France leads European molluscicide consumption with 14.65% market share in 2025, reflecting its extensive cereal production and intensive agricultural systems that favor slug proliferation during wet spring seasons. The country's agricultural policy framework emphasizes compliance with integrated pest management under CAP eco-scheme requirements, driving the adoption of precision application technologies and environmentally compatible formulations.
Germany follows closely with significant market presence concentrated in its northern agricultural regions, where slug pressure intensifies during prolonged moisture periods that characterize the changing European climate. The German National Action Plan on Plant Protection, updated in 2024, mandates threshold-based molluscicide applications that favor targeted products over broadcast treatments.
Russia emerges as the fastest-growing market, with an 8.05% CAGR through 2031, driven by agricultural modernization programs and the expansion of cultivation of slug-susceptible crops in regions previously considered too cold for significant gastropod populations. Climate shifts enable northward expansion of mollusk ranges, creating new pest pressure in agricultural zones that historically required minimal slug control measures.
Competitive Landscape
The European molluscicide market exhibits a fragmented structure, comprising a mix of global agrochemical conglomerates and specialized regional players, such as ADAMA Agricultural Solutions Ltd., W. Neudorff GmbH KG, Arxada, Mitsui & Co. Ltd (Certis Belchim), and Doff Portland Ltd. Major agricultural solution providers maintain significant market presence through their established distribution networks and comprehensive product portfolios, while specialized regional players leverage their local market knowledge and focused product development capabilities. The market demonstrates moderate consolidation, with the top players collectively holding a notable but not dominant market share, indicating room for competition and new entrants.
The industry has witnessed strategic consolidation through mergers and acquisitions, particularly among larger agrochemical companies seeking to strengthen their position in specific regions or expand their product offerings. These M&A activities have been driven by the need to achieve economies of scale, enhance research and development capabilities, and expand distribution networks. Companies are increasingly focusing on developing specialized solutions for specific crop segments and geographical regions, leading to strategic partnerships and collaborations with local distributors and research institutions.
Biotech start-ups funnel venture capital into RNA-interference sequences, partnering with agrochemical majors for scale-up and regulatory navigation. Robotic hardware companies collaborate with pellet formulators to provide service bundles that include bait plus application as a managed offering. National registration variance still fragments the market, tighter European Union data requirements may squeeze sub-scale players over the next five years. Midsize companies that lack R&D depth but hold local licenses could become acquisition targets as larger firms chase distribution synergies and dossier libraries.
Europe Molluscicide Industry Leaders
ADAMA Agricultural Solutions Ltd.
W. Neudorff GmbH KG
Arxada
Mitsui & Co. Ltd (Certis Belchim)
Doff Portland Ltd
- *Disclaimer: Major Players sorted in no particular order

Recent Industry Developments
- April 2025: ADAMA Agricultural Solutions received European Union regulatory approval for Feralla, a next-generation iron-phosphate molluscicide formulation designed for organic farming applications. The product features enhanced weatherability and extended field persistence compared to first-generation ferric phosphate compounds, addressing key efficacy concerns in European climate conditions.
- July 2024: The European Commission implemented new plant health regulations targeting invasive Pomacea species (apple snails) with mandatory control measures across member states. The regulations require immediate notification of infestations and coordinated response protocols that may increase molluscicide demand in affected regions.
- March 2022: A new company called Certis Belchim BV was formed by Mitsui & Co. Ltd by merging its recently acquired Belchim Crop Protection and its European subsidiary Certis Europe. This was done in accordance with the terms of a definitive agreement.


Europe Molluscicide Market Report Scope
Chemigation, Foliar, Fumigation, Soil Treatment are covered as segments by Application Mode. Commercial Crops, Fruits & Vegetables, Grains & Cereals, Pulses & Oilseeds, Turf & Ornamental are covered as segments by Crop Type. France, Germany, Italy, Netherlands, Russia, Spain, Ukraine, United Kingdom are covered as segments by Country.Application Mode
| Foliar |
| Soil Treatment |
| Chemigation |
| Fumigation |
Crop Type
| Commercial Crops |
| Fruits & Vegetables |
| Grains & Cereals |
| Pulses & Oilseeds |
| Turf & Ornamental |
Geography
| Germany |
| France |
| Spain |
| Russia |
| Italy |
| United Kingdom |
| Netherlands |
| Ukraine |
| Rest of Europe |
| Application Mode | Foliar |
| Soil Treatment | |
| Chemigation | |
| Fumigation | |
| Crop Type | Commercial Crops |
| Fruits & Vegetables | |
| Grains & Cereals | |
| Pulses & Oilseeds | |
| Turf & Ornamental | |
| Geography | Germany |
| France | |
| Spain | |
| Russia | |
| Italy | |
| United Kingdom | |
| Netherlands | |
| Ukraine | |
| Rest of Europe |


Market Definition
- Function - Molluscicides are chemicals used to control or prevent mollusks from damaging the crop and prevent yield loss.
- Application Mode - Foliar, Seed Treatment, Soil Treatment, Chemigation, and Fumigation are the different type of application modes through which crop protection chemicals are applied to the crops.
- Crop Type - This represents the consumption of crop protection chemicals by Cereals, Pulses, Oilseeds, Fruits, Vegetables, Turf, and Ornamental crops.
| Keyword | Definition |
|---|---|
| IWM | Integrated weed management (IWM) is an approach to incorporate multiple weed control techniques throughout the growing season to give producers the best opportunity to control problematic weeds. |
| Host | Hosts are the plants that form relationships with beneficial microorganisms and help them colonize. |
| Pathogen | A disease-causing organism. |
| Herbigation | Herbigation is an effective method of applying herbicides through irrigation systems. |
| Maximum residue levels (MRL) | Maximum Residue Limit (MRL) is the maximum allowed limit of pesticide residue in food or feed obtained from plants and animals. |
| IoT | The Internet of Things (IoT) is a network of interconnected devices that connect and exchange data with other IoT devices and the cloud. |
| Herbicide-tolerant varieties (HTVs) | Herbicide-tolerant varieties are plant species that have been genetically engineered to be resistant to herbicides used on crops. |
| Chemigation | Chemigation is a method of applying pesticides to crops through an irrigation system. |
| Crop Protection | Crop protection is a method of protecting crop yields from different pests, including insects, weeds, plant diseases, and others that cause damage to agricultural crops. |
| Seed Treatment | Seed treatment helps to disinfect seeds or seedlings from seed-borne or soil-borne pests. Crop protection chemicals, such as fungicides, insecticides, or nematicides, are commonly used for seed treatment. |
| Fumigation | Fumigation is the application of crop protection chemicals in gaseous form to control pests. |
| Bait | A bait is a food or other material used to lure a pest and kill it through various methods, including poisoning. |
| Contact Fungicide | Contact pesticides prevent crop contamination and combat fungal pathogens. They act on pests (fungi) only when they come in contact with the pests. |
| Systemic Fungicide | A systemic fungicide is a compound taken up by a plant and then translocated within the plant, thus protecting the plant from attack by pathogens. |
| Mass Drug Administration (MDA) | Mass drug administration is the strategy to control or eliminate many neglected tropical diseases. |
| Mollusks | Mollusks are pests that feed on crops, causing crop damage and yield loss. Mollusks include octopi, squid, snails, and slugs. |
| Pre-emergence Herbicide | Preemergence herbicides are a form of chemical weed control that prevents germinated weed seedlings from becoming established. |
| Post-emergence Herbicide | Postemergence herbicides are applied to the agricultural field to control weeds after emergence (germination) of seeds or seedlings. |
| Active Ingredients | Active ingredients are the chemicals in pesticide products that kill, control, or repel pests. |
| United States Department of Agriculture (USDA) | The Department of Agriculture provides leadership on food, agriculture, natural resources, and related issues. |
| Weed Science Society of America (WSSA) | The WSSA, a non-profit professional society, promotes research, education, and extension outreach activities related to weeds. |
| Suspension concentrate | Suspension concentrate (SC) is one of the formulations of crop protection chemicals with solid active ingredients dispersed in water. |
| Wettable powder | A wettable powder (WP) is a powder formulation that forms a suspension when mixed with water prior to spraying. |
| Emulsifiable concentrate | Emulsifiable concentrate (EC) is a concentrated liquid formulation of pesticide that needs to be diluted with water to create a spray solution. |
| Plant-parasitic nematodes | Parasitic Nematodes feed on the roots of crops, causing damage to the roots. These damages allow for easy plant infestation by soil-borne pathogens, which results in crop or yield loss. |
| Australian Weeds Strategy (AWS) | The Australian Weeds Strategy, owned by the Environment and Invasives Committee, provides national guidance on weed management. |
| Weed Science Society of Japan (WSSJ) | WSSJ aims to contribute to the prevention of weed damage and the utilization of weed value by providing the chance for research presentation and information exchange. |


Research Methodology
Mordor Intelligence follows a four-step methodology in all our reports.
- Step-1: Identify Key Variables: In order to build a robust forecasting methodology, the variables and factors identified in Step-1 are tested against available historical market numbers. Through an iterative process, the variables required for market forecast are set and the model is built on the basis of these variables.
- Step-2: Build a Market Model: Market-size estimations for the forecast years are in nominal terms. Inflation is not a part of the pricing, and the average selling price (ASP) is kept constant throughout the forecast period.
- Step-3: Validate and Finalize: In this important step, all market numbers, variables and analyst calls are validated through an extensive network of primary research experts from the market studied. The respondents are selected across levels and functions to generate a holistic picture of the market studied.
- Step-4: Research Outputs: Syndicated Reports, Custom Consulting Assignments, Databases & Subscription Platforms


