Biological Control Market Size and Share
Market Overview
| Study Period | 2021 - 2031 |
|---|---|
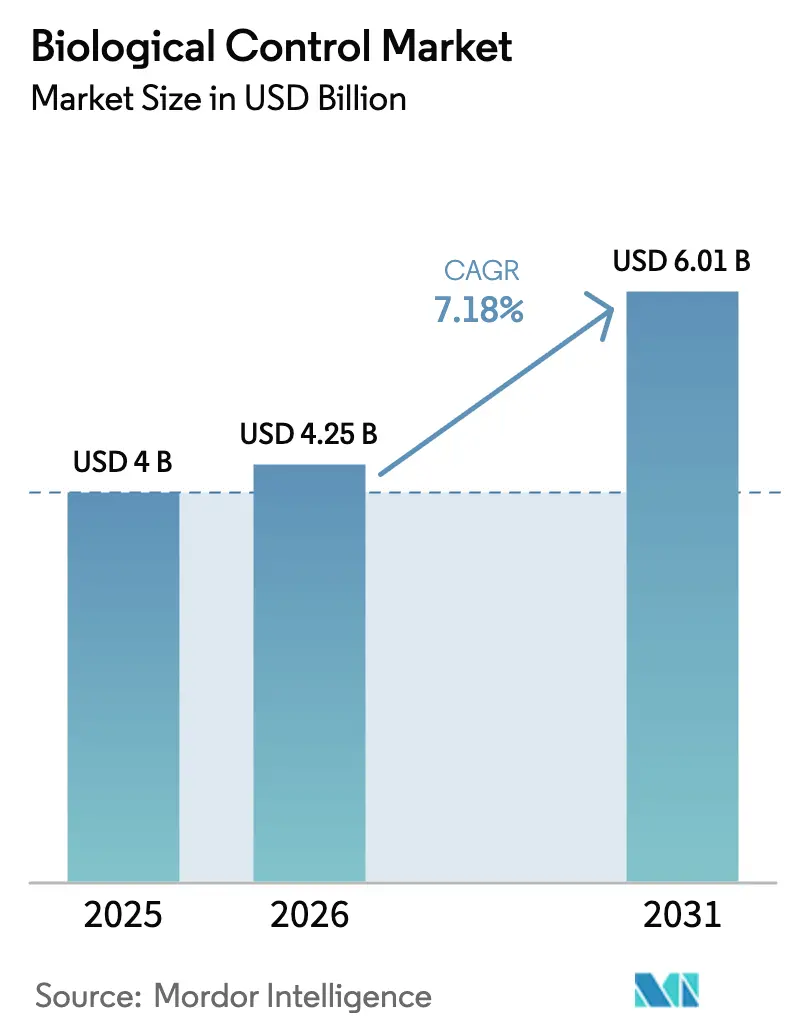
| Market Size (2026) | USD 4.25 Billion |
| Market Size (2031) | USD 6.01 Billion |
| Growth Rate (2026 - 2031) | 7.18% CAGR |
| Fastest Growing Market | Africa |
| Largest Market | Asia Pacific |
| Market Concentration | Low |
Major Players *Disclaimer: Major Players sorted in no particular order Image © Mordor Intelligence. Reuse requires attribution under CC BY 4.0. | |
Biological Control Market Analysis by Mordor Intelligence
The biological control market size is anticipated to grow from USD 4.00 billion in 2025 to USD 4.25 billion in 2026 and is forecast to reach USD 6.01 billion by 2031 at 7.18% CAGR over 2026-2031. The Asia-Pacific region is projected to dominate revenue, driven by intensive horticulture practices in key countries. Increasing regulatory restrictions on high-toxicity pesticides, retailer requirements for pesticide-free supply chains, and advancements in robotics that reduce macrobial rearing costs are boosting global demand. Developments in artificial intelligence for strain discovery have significantly shortened microbial product development timelines, fostering opportunities for new market entrants. While consolidation among input suppliers persists, mid-sized innovators are leveraging regional distribution networks and crop-specific expertise to differentiate themselves.
Key Report Takeaways
- By form, macrobials led the biological control market with 97.7% revenue share in 2025, and microbials are forecast to expand at an fastest growing rate of 8.8% CAGR over 2026-2031.
- By crop type, row crops accounted for 76.7% share of the biological control market size in 2025, while horticultural crops are advancing at an fastest 8.3% CAGR from 2026-2031.
- By region, Asia-Pacific held 66.9% of the biological control market share in 2025, whereas Africa records the fastest projected CAGR at 10.6% from 2026-2031.
Note: Market size and forecast figures in this report are generated using Mordor Intelligence’s proprietary estimation framework, updated with the latest available data and insights as of 2026.
Global Biological Control Market Trends and Insights
Drivers Impact Analysis*
| Driver | (~) % Impact on CAGR Forecast | Geographic Relevance | Impact Timeline |
|---|---|---|---|
| Stringent bans on high-toxicity synthetic pesticides | +1.80% | European Union, United Kingdom, United States, and India | Medium term (2-4 years) |
| Rising global demand for certified-organic produce | +1.50% | European Union, United States, Asia-Pacific premium segments | Long term (≥ 4 years) |
| Government subsidies for integrated pest management (IPM) adoption and biological inputs | +1.20% | European Union, India, Brazil, United Kingdom, select United States states | Medium term (2-4 years) |
| Insect-rearing automation slashing cost of macrobials | +1.00% | Netherlands, Israel, United States and scaling globally | Short term (≤ 2 years) |
| Breakthrough predatory bacterial platforms targeting phytopathogens | +0.90% | India, China, Japan with spill-over to South America and Africa | Long term (≥ 4 years) |
| AI-driven discovery of soil-microbiome consortia accelerating product pipelines | +0.80% | North America and European Union R&D hubs with trials in Brazil, Argentina, India | Long term (≥ 4 years) |
| Source: Mordor Intelligence | |||
Stringent Bans on High-Toxicity Synthetic Pesticides
Global regulatory bodies are expediting the phase-out of organophosphates and neonicotinoids, catalyzing immediate substitution opportunities for biological solutions. On August 6, 2024, the EPA issued an emergency order to suspend all registrations of the pesticide Dimethyl Tetrachloroterephthalate (DCPA or Dacthal), representing the first such emergency action in almost 40 years. The action was taken due to significant and irreversible health risks to unborn babies, particularly alterations in fetal thyroid hormone levels resulting from exposure to the herbicide. Similarly, the United States Environmental Protection Agency restricted chlorpyrifos tolerances on a few crops in December 2024[1]Source: United States Environmental Protection Agency, “Chlorpyrifos,” epa.gov. In India, several legacy active ingredients were prohibited under the Insecticides Act, increasing near-term acreage available for biocontrol adoption. These policy moves encourage manufacturers to accelerate product launches and spur farmers to recalibrate crop-protection programs toward IPM frameworks. Regulatory frameworks are driving procurement towards low-toxicity solutions.
Rising Global Demand for Certified-Organic Produce
Global retail sales of organic food and drink hit an all-time high of 145.0 billion euros (approximately USD 153–155 billion) in 2024 with major markets being the United States, Germany, and China, according to the Research Institute of Organic Agriculture (FiBL) and International Federation of Organic Agriculture Movements (IFOAM) – Organics International, as published in February 2026. Retailers, including Walmart, Tesco, and Carrefour, have committed to sourcing a portion of their fresh produce from organic or residue-free programs in the coming years. Supermarkets enforce residue-free supplier policies, pushing growers to adopt biological inputs that preserve certification. Organic certification bars most synthetic pesticides yet permits macrobials and microbials, creating a captive customer base. Premium farm-gate prices, typically 20-40% above conventional produce, offset higher biological agent costs and facilitate deeper penetration in high-value horticulture.
Government Subsidies for Integrated Pest Management (IPM) Adoption and Biological Inputs
Public incentives lower the entry barrier for smallholders and commercial farms alike. The UK's Sustainable Farming Incentive (SFI) provides payments to farmers in England for implementing environmentally sustainable practices, including soil health management, hedgerow protection, and biodiversity enhancement[2]Source: UK Government, “Sustainable Farming Incentive,” gov.uk. India's Paramparagat Krishi Vikas Yojana (PKVY) provides total financial assistance of INR 31,500 (USD 346.4) per hectare over three years. The PKVY scheme offers comprehensive support to organic farmers, covering production, processing, certification, and marketing through a cluster-based approach. The Common Agricultural Policy (CAP) for 2023–2027 prioritizes green and sustainable farming practices, with a focus on reducing pesticide usage and enhancing environmental management. Brazil introduced a comprehensive Harvest Plan valued at BRL 516.2 billion (USD 95 billion) in 2025, aimed at promoting sustainable practices. The plan includes incentives such as reduced interest rates for producers who adopt biological inputs and comply with sustainability guidelines. Such incentives result in higher adoption of biological inputs, boosting the market growth.
Breakthrough Predatory Bacterial Platforms Targeting Phytopathogens
Next-generation Bacillus and Pseudomonas strains attack difficult plant pathogens such as Xanthomonas and Ralstonia. AgBiome's recently registered Pseudomonas isolate effectively reduced bacterial wilt in tomato fields, achieving results comparable to copper fungicides without leaving residues. BASF’s Serifel, based on Bacillus amyloliquefaciens strain MBI 600, quickly gained a significant share in the European crop protection market, specifically used for high-value fruit and vegetable crops, as it is favored for its high concentration and multi-mode efficacy in combating diseases such as Botrytis. Field studies in strawberries confirm biological parity with synthetic controls while preserving pollinator populations. These pathogens utilize unique active predation mechanisms, reducing reliance on chemical treatments and offering a solution to antimicrobial resistance.
Restraints Impact Analysis*
| Restraint | (~) % Impact on CAGR Forecast | Geographic Relevance | Impact Timeline |
|---|---|---|---|
| Short commercial shelf-life for many living products | -0.9% | Global, severe in tropical zones | Short term (≤ 2 years) |
| Protracted multi-agency registration timelines | -0.7% | Global, acute in emerging markets | Medium term (2-4 years) |
| Limited sterile fermentation capacity for next-generation microbials | -0.5% | North America, Europe, advanced Asia-Pacific | Long term (≥ 4 years) |
| Micro-climate-driven efficacy variability undermining farmer confidence | -0.4% | Regions with erratic weather | Medium term (2-4 years) |
| Source: Mordor Intelligence | |||
Short Commercial Shelf-Life for Many Living Products
Most macrobial and microbial biocontrol agents are living organisms whose viability declines rapidly at temperatures exceeding 25 °C. Even under refrigerated conditions, their viability is maintained for only 2-4 weeks, necessitating costly cold-chain logistics systems. This requirement significantly limits market penetration in regions with unreliable electricity supply. A substantial percentage of products arrive damaged in Africa due to inadequate cold-chain infrastructure, highlighting the significant investment required in agricultural logistics[3]Source: Food and Agriculture Organization of the United Nations, “Biological Control Logistics in Africa,” fao.org. While recent advancements in encapsulation methods and cryoprotectant formulations have shown the potential to double product shelf life in pilot studies, these improvements remain far from achieving the multi-year stability offered by synthetic chemical alternatives. Until more durable formulations are developed and scaled, landed prices will remain above levels acceptable to growers.
Protracted Multi-Agency Registration Timelines
Overlapping regulatory reviews by the Environmental Protection Agency (EPA), European Food Safety Authority (EFSA), and national biosafety authorities delay product launches, with approval timelines significantly extended in the European Union and the United States. The European and Mediterranean Plant Protection Organization (EPPO) requires detailed dossiers covering host specificity, environmental fate, and non-target effects for each macrobial species, leading to high data-generation costs. In the United States, the EPA mandates ecological risk assessments for microbial biopesticides, further extending registration timelines compared to conventional active ingredients. In India, the Central Insecticides Board and Registration Committee (CIBRC) introduced biosafety guidelines requiring multi-location field trials over two crop cycles, causing additional delays and discouraging multinational firms from prioritizing the Indian market. These regulatory challenges slow the pace of innovation, prompting firms to focus on markets with more streamlined approval processes, such as Brazil and Australia.
*Our forecasts treat driver/restraint impacts as directional, not additive. The impact forecasts reflect baseline growth, mix effects, and variable interactions.
Segment Analysis
By Form: Macrobials Remain Dominant while Microbials Accelerate
Macrobials maintained their commanding 97.7% market share of the biological control market in 2025, while microbials are emerging as the fastest with an 8.8% forecast CAGR from 2026-2031. Macrobials anchored by widespread use of predatory mites, parasitoid wasps, and entomopathogenic nematodes in greenhouses and row-crop programs. Growers value the visible presence of natural enemies, often detecting pest knockdown within one week, which reinforces confidence and repeat purchases. The segment's dominance stems from proven efficacy in field applications and farmer familiarity with release protocols for predatory insects and parasitoids.
Bacterial biocontrols, such as Bacillus subtilis, is growing due to their effectiveness in seed coatings and foliar disease suppression. Recent regulatory approvals for multi-strain microbial products are expanding application possibilities, particularly in high-value horticultural crops, where precision application justifies premium pricing. Fungal agents, including Trichoderma and Beauveria, are widely used in crops like cocoa, coffee, and cotton to address root pathogens and sucking insect issues. The shift toward microbials reflects technological advances in fermentation processes and formulation stability that are addressing historical limitations of bacterial and fungal biocontrol agents. Increasing regulatory approvals for microbial active substances indicate growing institutional support, which is anticipated to sustain the faster growth of microbials compared to macrobials.


By Crop Type: Row Crops Lead and Horticulture Surges
Row crops command a dominant 76.7% market share of the biological control market in 2025, driven by extensive adoption across corn, soybean, and wheat production systems, where biocontrol agents address persistent pest pressure while maintaining commodity pricing competitiveness. Bacillus and Trichoderma seed treatments covered a significant portion of global maize hectares, supported by strong evidence of their role in nutrient cycling and disease control. Entomopathogenic nematodes have been effective in protecting potato and maize crops from soil-dwelling larvae in key regions. Subsidies in certain countries have further reduced the per-hectare cost gap with generic synthetic alternatives. The segment's leadership reflects the scale economics of biocontrol application across large acreages and established integrated pest management protocols that incorporate biological agents as resistance management tools.
Horticultural crops are experiencing fastest expansion at 8.3% CAGR from 2026-2031, contributing significantly to the growth of the biological control market. The production of greenhouse tomatoes, peppers, and cucumbers predominantly depends on macrobials, with input costs offset by price premiums for residue-free produce. Bacterial agents, such as Bacillus amyloliquefaciens, have gained notable market share in European pome-fruit production, highlighting a transition away from copper-based fungicides. The segment's growth trajectory reflects consumer willingness to pay premium prices for organic and low-residue produce, creating economic incentives for growers to adopt higher-cost biocontrol solutions. Cash crops like coffee and cocoa now constitute a significant portion of the demand and are anticipated to benefit further as certification schemes continue to expand.

Geography Analysis
Asia-Pacific commanded 66.9% of the biological control market in 2025, driven by India's distribution of macrobial units through national organic programs and China's mandate to reduce chemical pesticide use. Japan reported significant reliance on predatory mites and parasitoids in greenhouse tomato cultivation, surpassing adoption levels in Europe. Additionally, Southeast Asian governments trained extension agents under a project emphasizing integrated pest management. The extensive scale of protected horticulture ensures that Asia-Pacific remains the leading region in the biological control market.
Africa posts the fastest 10.6% CAGR from 2026-2031 supported by donor-funded programs targeting fall armyworm and desert locust control. The International Centre of Insect Physiology and Ecology supplied biological control agents to maize growers, reducing synthetic pesticide use. South Africa allocated resources for citrus and grape programs, while Egypt expanded Trichogramma releases across cotton and maize cultivation. However, cold-chain gaps continue to threaten product viability, though infrastructure projects are underway to address this issue.
North America contributed a significant share of global turnover in 2025 and is anticipated to grow steadily. Environmental Protection Agency restrictions on certain chemical pesticides are prompting fruit, nut, and vegetable producers to adopt macrobials and microbials. California approved new biological labels catering to the organic sector. Canada reduced approval timelines for low-risk microbials, while Mexico expanded the use of predatory mites in avocado orchards to comply with residue limits. These policy changes are anticipated to sustain steady regional growth.


Competitive Landscape
The biological control market remains highly fragmented in 2025, with Koppert Biological Systems Inc., BioFirst Group, Bioline AgroSciences Ltd. (Eurazeo), Biobee Biological Systems Ltd, and Novonesis Group. collectively accounting for only a modest share of total revenue in the biological control market. Despite this, numerous specialized players thrive in crop-specific and regional niches. Koppert Biological Systems leads with a diverse portfolio of macrobial species and a broad distribution network. Biobest combines its pollination franchise with substantial predatory mite production capacity. Bioline AgroSciences leverages cooperative networks in Europe, while Biobee and Viridaxis also maintain notable market positions.
Vertical integration remains a key strategic theme in the market. Koppert Biological Systems has implemented robotics to reduce production costs, enabling greater pricing flexibility compared to synthetic insecticides. Novonesis Group, formed through a merger, focuses on scaling microbial production with extensive strain management and fermentation capacity. AgBiome’s platform uses machine learning to accelerate development cycles, challenging competitors reliant on traditional discovery methods. Patent filings indicate a strong focus on novel microbial strains.
Significant opportunities exist in addressing soil-borne disease control for cereals and post-harvest fruit protection, particularly as fungicide bans create urgent demand. Marrone Bio Innovations and UPL Biologicals are targeting underserved regions through localized manufacturing and registration support. Valent BioSciences is investing in new production facilities to expand microbial capacity. As production costs decline and efficacy improves, competition is anticipated to shift toward advisory services and logistics capabilities rather than solely focusing on active-ingredient portfolios.
Biological Control Industry Leaders
Koppert Biological Systems Inc.
BioFirst Group
Bioline AgroSciences Ltd (Eurazeo)
Novonesis Group
Biobee Biological Systems Ltd
- *Disclaimer: Major Players sorted in no particular order


Recent Industry Developments
- September 2025: Bioline AgroSciences Ltd acquired Viridaxis SA, strengthening its position in biological pest control. The deal enhances Bioline’s portfolio of beneficial insects for sustainable agriculture across Europe.
- February 2025: PI Industries and Centre for Cellular and Molecular Platforms (C-CAMP) have partnered to accelerate innovation in biocontrol technologies for sustainable agriculture. The initiative will support startups developing biological crop protection solutions, including biocontrol agents, through funding and technical guidance.
- January 2025: Koppert has introduced Limonica, a new predatory mite product combining two mite species for enhanced pest control. Designed for greenhouse crops, it offers improved resilience and effectiveness against thrips and whiteflies.


Global Biological Control Market Report Scope
Biological control agents are living organisms utilized to manage or eliminate pests. These include natural enemies such as predators, parasitoids, and pathogens, as well as antagonists that combat plant diseases and organisms used for weed control. The Biological Control Market Report is Segmented by Form (Macrobials, Microbials), by Crop Type (Cash Crops, Horticultural Crops, and Row Crops), and by Geography (Africa, Asia-Pacific, Europe, Middle East, North America, and South America). The Market Forecasts are Provided in Terms of Value (USD) and Volume (Metric Tons).
| Macrobials | By Organism | Entamopathogenic Nematodes |
| Parasitoids | ||
| Predators | ||
| Microbials | By Organism | Bacterial Biocontrol Agents |
| Fungal Biocontrol Agents | ||
| Other Microbials |
| Cash Crops |
| Horticultural Crops |
| Row Crops |
| Africa | By Country | Egypt |
| Nigeria | ||
| South Africa | ||
| Rest of Africa | ||
| Asia-Pacific | By Country | Australia |
| China | ||
| India | ||
| Indonesia | ||
| Japan | ||
| Philippines | ||
| Thailand | ||
| Vietnam | ||
| Rest of Asia-Pacific | ||
| Europe | By Country | France |
| Germany | ||
| Italy | ||
| Netherlands | ||
| Russia | ||
| Spain | ||
| Turkey | ||
| United Kingdom | ||
| Rest of Europe | ||
| Middle East | By Country | Iran |
| Saudi Arabia | ||
| Rest of Middle East | ||
| North America | By Country | Canada |
| Mexico | ||
| United States | ||
| Rest of North America | ||
| South America | By Country | Argentina |
| Brazil | ||
| Rest of South America |
| By Form | Macrobials | By Organism | Entamopathogenic Nematodes |
| Parasitoids | |||
| Predators | |||
| Microbials | By Organism | Bacterial Biocontrol Agents | |
| Fungal Biocontrol Agents | |||
| Other Microbials | |||
| By Crop Type | Cash Crops | ||
| Horticultural Crops | |||
| Row Crops | |||
| By Region | Africa | By Country | Egypt |
| Nigeria | |||
| South Africa | |||
| Rest of Africa | |||
| Asia-Pacific | By Country | Australia | |
| China | |||
| India | |||
| Indonesia | |||
| Japan | |||
| Philippines | |||
| Thailand | |||
| Vietnam | |||
| Rest of Asia-Pacific | |||
| Europe | By Country | France | |
| Germany | |||
| Italy | |||
| Netherlands | |||
| Russia | |||
| Spain | |||
| Turkey | |||
| United Kingdom | |||
| Rest of Europe | |||
| Middle East | By Country | Iran | |
| Saudi Arabia | |||
| Rest of Middle East | |||
| North America | By Country | Canada | |
| Mexico | |||
| United States | |||
| Rest of North America | |||
| South America | By Country | Argentina | |
| Brazil | |||
| Rest of South America | |||


Market Definition
- AVERAGE DOSAGE RATE - The average application rate is the average volume of biocontrol agents applied per hectare of farmland in the respective region/country.
- CROP TYPE - Crop type includes Row crops (Cereals, Pulses, Oilseeds), Horticultural Crops (Fruits and vegetables) and Cash Crops (Plantation Crops, Fibre Crops and Other Industrial Crops)
- FUNCTION - The Crop Protection function of agirucultural biological include products that prevent or control various biotic and abiotic stress.
- TYPE - Biocontrol agents are the natural predators and parasitoids used to control various pests. Biocontrol agents include both microbials (Microorganisms) and macrobials (Insects).
| Keyword | Definition |
|---|---|
| Cash Crops | Cash crops are non-consumable crops sold as a whole or part of the crop to manufacture end-products to make a profit. |
| Integrated Pest Management (IPM) | IPM is an environment-friendly and sustainable approach to control pests in various crops. It involves a combination of methods, including biological controls, cultural practices, and selective use of pesticides. |
| Bacterial biocontrol agents | Bacteria used to control pests and diseases in crops. They work by producing toxins harmful to the target pests or competing with them for nutrients and space in the growing environment. Some examples of commonly used bacterial biocontrol agents include Bacillus thuringiensis (Bt), Pseudomonas fluorescens, and Streptomyces spp. |
| Plant Protection Product (PPP) | A plant protection product is a formulation applied to crops to protect from pests, such as weeds, diseases, or insects. They contain one or more active substances with other co-formulants such as solvents, carriers, inert material, wetting agents or adjuvants formulated to give optimum product efficacy. |
| Pathogen | A pathogen is an organism causing disease to its host, with the severity of the disease symptoms. |
| Parasitoids | Parasitoids are insects that lay their eggs on or within the host insect, with their larvae feeding on the host insect. In agriculture, parasitoids can be used as a form of biological pest control, as they help to control pest damage to crops and decrease the need for chemical pesticides. |
| Entomopathogenic Nematodes (EPN) | Entomopathogenic nematodes are parasitic roundworms that infect and kill pests by releasing bacteria from their gut. Entomopathogenic nematodes are a form of biocontrol agents used in agriculture. |
| Vesicular-arbuscular mycorrhiza (VAM) | VAM fungi are mycorrhizal species of fungus. They live in the roots of different higher-order plants. They develop a symbiotic relationship with the plants in the roots of these plants. |
| Fungal biocontrol agents | Fungal biocontrol agents are the beneficial fungi that control plant pests and diseases. They are an alternative to chemical pesticides. They infect and kill the pests or compete with pathogenic fungi for nutrients and space. |
| Biofertilizers | Biofertilizers contain beneficial microorganisms that enhance soil fertility and promote plant growth. |
| Biopesticides | Biopesticides are natural/bio-based compounds used to manage agricultural pests using specific biological effects. |
| Predators | Predators in agriculture are the organisms that feed on pests and help control pest damage to the crops. Some common predator species used in agriculture include ladybugs, lacewings, and predatory mites. |
| Biocontrol agents | Biocontrol agents are living organisms used to control pests and diseases in agriculture. They are alternatives to chemical pesticides and are known for their lesser impact on the environment and human health. |
| Organic Fertilizers | Organic fertilizer is composed of animal or vegetable matter used alone or in combination with one or more non-synthetically derived elements or compounds used for soil fertility and plant growth. |
| Protein hydrolysates (PHs) | Protein hydrolysate-based biostimulants contain free amino acids, oligopeptides, and polypeptides produced by enzymatic or chemical hydrolysis of proteins, primarily from vegetal or animal sources. |
| Biostimulants/Plant Growth Regulators (PGR) | Biostimulants/Plant Growth Regulators (PGR) are substances derived from natural resources to enhance plant growth and health by stimulating plant processes (metabolism). |
| Soil Amendments | Soil Amendments are substances applied to soil that improve soil health, such as soil fertility and soil structure. |
| Seaweed Extract | Seaweed extracts are rich in micro and macronutrients, proteins, polysaccharides, polyphenols, phytohormones, and osmolytes. These substances boost seed germination and crop establishment, total plant growth and productivity. |
| Compounds related to biocontrol and/or promoting growth (CRBPG) | Compounds related to biocontrol or promoting growth (CRBPG) are the ability of a bacteria to produce compounds for phytopathogen biocontrol and plant growth promotion. |
| Symbiotic Nitrogen-Fixing Bacteria | Symbiotic nitrogen-fixing bacteria such as Rhizobium obtain food and shelter from the host, and in return, they help by providing fixed nitrogen to the plants. |
| Nitrogen Fixation | Nitrogen fixation is a chemical process in soil which converts molecular nitrogen into ammonia or related nitrogenous compounds. |
| ARS (Agricultural Research Service) | ARS is the U.S. Department of Agriculture's chief scientific in-house research agency. It aims to find solutions to agricultural problems faced by the farmers in the country. |
| Phytosanitary Regulations | Phytosanitary regulations imposed by the respective government bodies check or prohibit the importation and marketing of certain insects, plant species, or products of these plants to prevent the introduction or spread of new plant pests or pathogens. |
| Ectomycorrhizae (ECM) | Ectomycorrhiza (ECM) is a symbiotic interaction of fungi with the feeder roots of higher plants in which both the plant and the fungi benefit through the association for survival. |


Research Methodology
Mordor Intelligence follows a four-step methodology in all our reports.
- Step-1: Identify Key Variables: In order to build a robust forecasting methodology, the variables and factors identified in Step-1 are tested against available historical market numbers. Through an iterative process, the variables required for market forecast are set and the model is built on the basis of these variables.
- Step-2: Build a Market Model: Market-size estimations for the forecast years are in nominal terms. Inflation is not a part of the pricing, and the average selling price (ASP) is kept constant throughout the forecast period.
- Step-3: Validate and Finalize: In this important step, all market numbers, variables and analyst calls are validated through an extensive network of primary research experts from the market studied. The respondents are selected across levels and functions to generate a holistic picture of the market studied.
- Step-4: Research Outputs: Syndicated Reports, Custom Consulting Assignments, Databases & Subscription Platforms.


