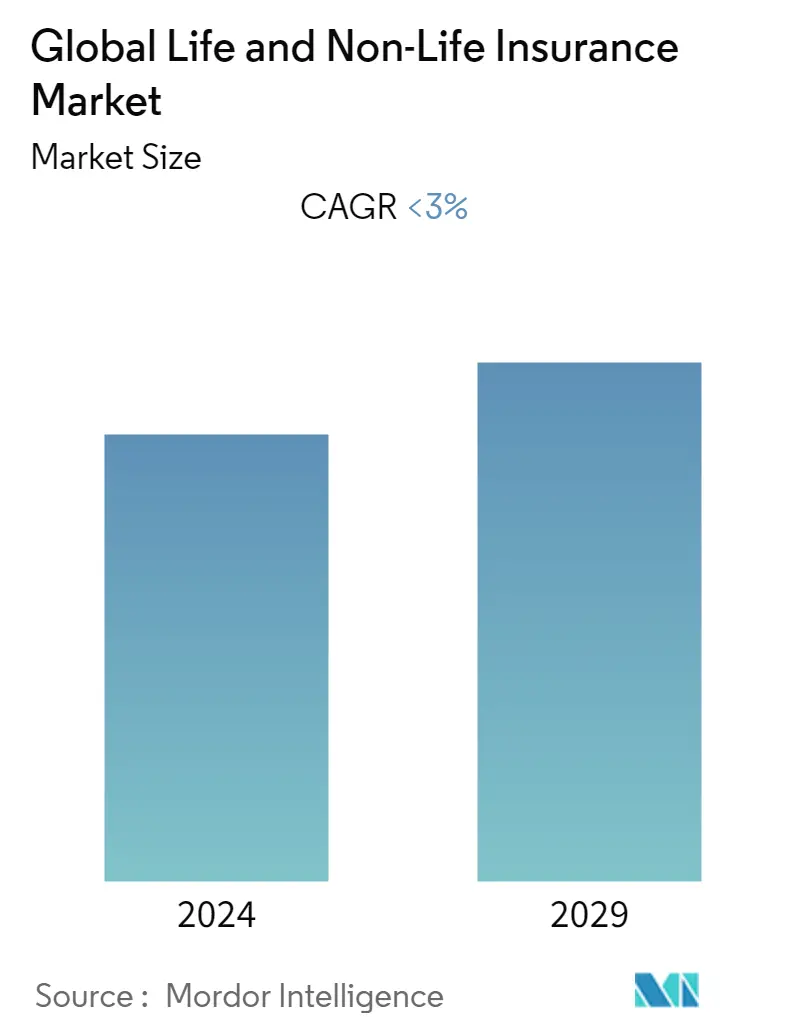
Life and Non-Life Insurance Market Size
| Study Period | 2020 - 2029 |
| Base Year For Estimation | 2023 |
| CAGR | < 3.00 % |
| Fastest Growing Market | Asia Pacific |
| Largest Market | North America |
| Market Concentration | Low |
Major Players/global-life-and-non-life-insurance-market--growth,-trends,-and-forecast-(2020---2025)_Picture20.webp)
*Disclaimer: Major Players sorted in no particular order |
Need a report that reflects how COVID-19 has impacted this market and its growth?
Life and Non-Life Insurance Market Analysis
- The Global Life and Non-Life Insurance market are estimated to grow at a CAGR of approximately 3% during the forecast period.
- Global insurance premiums passed the USD 5 trillion mark for the first time in 2018, equivalent to more than 6% of world gross domestic product, growth came generally from property/casualty insurance expansion in China and other emerging Asian markets. In terms of Global insurance premiums, Asia Pacific holds 32.4%, North America 30.8% and Europe 31.6% in 2018. North America and Europe had the highest insurance penetration rates in 2017, measured by premiums as a percentage of GDP, with 7.1% and 6.5% of GDP, respectively. Asia, which includes the Middle East, and Oceania tied in third place with 5.6%. While Taiwan (21.3%), Hong Kong (17.9%), South Korea (11.6%), Japan (8.6%) and Singapore (8.2%) recorded rates above those seen in North America, about half of the countries in Asia have rates of less than 3% of GDP, with large, populous economies such as Pakistan and Bangladesh registering rates under 1%. Latin America and the Caribbean, as well as Africa, hold the most potential for catch-up growth, with penetration rates of 3.06% and 2.96%, respectively.
- The insurTech sector has seen much technological and investment development over the past few years. Traditional insurance business lines such as health, auto, and commercial are being revolutionized by new digital-centric startups. New technologies such as AI and IoT are re-architecting insurance data, the foundation of the insurance industry.
Life and Non-Life Insurance Market Trends
This section covers the major market trends shaping the Life & Non-Life Insurance Market according to our research experts:
Global M&A Activity in Insurance Industry:
There were 382 completed mergers and acquisitions (M&A) worldwide in the insurance sector in 2018, up 9% (from 350) from the previous year. With 196 deals in the second half of the year, following 186 in the first six months, there have now been three consecutive six-month periods of M&A growth for the first time since 2009.While the Americas remained the most active region for insurance sector M&A with 189 deals in 2018, there was a minor drop off in deal activity in the Americas in the second half of the year with 92 transactions, down from 97 in the first six months. In 2018 there were 18 mega-deals valued in excess of USD 1 billion, including the year’s largest, AXA’s USD 15.1 billion acquisition of XL Catlin. APAC’s M&A activity in insurance sector were up by 40% in 2018 compared to previous year, APAC region is an emerging market.
/global-life-and-non-life-insurance-market--growth,-trends,-and-forecast-(2020---2025)_t1.webp)
Significant growth in insurtech adoption:
Insurtech adoption has seen significant growth from 8% in 2015 to almost 50% in 2019. The use of technology in insurance can make products more affordable, business more profitable and provide access to new risk pools, insurance companies are integrating digital technologies into their traditional processes and everyday workflows in order to reduce manual efforts, time and costs. Insurance saw an increase in investment increase at 36.5% CAGR between 2014 and 2017. Insurance sector participants sometimes use the term more broadly to encompass the application of digital technology to all stages of the insurance supply chain. As the insurance sectors of developing and emerging markets become more sophisticated, it can be expected that digital solutions will filter down through the insurance supply chain, driving operational efficiency and ultimately profitability, as is already being seen in more advanced markets.
/global-life-and-non-life-insurance-market--growth,-trends,-and-forecast-(2020---2025)_t2.webp)
Life and Non-Life Insurance Industry Overview
The report covers the major players operating in the Global Life and Non-Life Insurance market. The market is fragmented, technology adoption in insurance sector, government initiatives towards changes in insurance regulatory like MTPL (motor third party liability) and many other factors can drive the market during the forecast period.
Life and Non-Life Insurance Market Leaders
Massachusetts Mutual Life Insurance Company
Unitedhealth Group Incorporated
Berkshire Hathaway Inc.
Ping An Insurance (Group) Company of China, Ltd.
CHINA LIFE INSURANCE COMPANY LIMITED
*Disclaimer: Major Players sorted in no particular order
/global-life-and-non-life-insurance-market--growth,-trends,-and-forecast-(2020---2025)_Picture19.webp)
Life and Non-Life Insurance Market Report - Table of Contents
-
1. INTRODUCTION
-
1.1 Study Deliverables
-
1.2 Study Assumptions
-
1.3 Scope of the Study
-
-
2. RESEARCH METHODOLOGY
-
3. EXECUTIVE SUMMARY
-
4. MARKET DYNAMICS
-
4.1 Market Overview
-
4.2 Market Drivers
-
4.3 Market Restraints
-
4.4 Porters 5 Force Analysis
-
4.4.1 Threat of New Entrants
-
4.4.2 Bargaining Power of Buyers/Consumers
-
4.4.3 Bargaining Power of Suppliers
-
4.4.4 Threat of Substitute Products
-
4.4.5 Intensity of Competitive Rivalry
-
-
-
5. MARKET SEGMENTATION
-
5.1 By Insurance Type
-
5.1.1 Life Insurance
-
5.1.1.1 Individual
-
5.1.1.2 Group
-
-
5.1.2 Non-Life Insurance
-
5.1.2.1 Home
-
5.1.2.2 Motor
-
5.1.2.3 Others
-
-
-
5.2 By channel of distribution
-
5.2.1 Direct
-
5.2.2 Agency
-
5.2.3 Banks
-
5.2.4 Others
-
-
5.3 Geography
-
5.3.1 North America
-
5.3.1.1 US
-
5.3.1.2 Canada
-
5.3.1.3 Mexico
-
5.3.1.4 Rest of NA
-
-
5.3.2 Europe
-
5.3.2.1 Germany
-
5.3.2.2 UK
-
5.3.2.3 France
-
5.3.2.4 Russia
-
5.3.2.5 Spain
-
5.3.2.6 Rest of NA
-
-
5.3.3 Asia Pacific
-
5.3.3.1 India
-
5.3.3.2 China
-
5.3.3.3 Japan
-
5.3.3.4 Rest of AP
-
-
5.3.4 South America
-
5.3.4.1 Brazil
-
5.3.4.2 Argentina
-
-
5.3.5 Middle East
-
5.3.5.1 UAE
-
5.3.5.2 Saudi Arabia
-
5.3.5.3 Rest
-
-
-
-
6. COMPETITIVE LANDSCAPE
-
6.1 Vendor Market Share
-
6.2 Mergers & Acquisitions
-
6.3 Company Profiles
-
6.3.1 Massachusetts Mutual Life Insurance Company
-
6.3.2 Unitedhealth Group Incorporated
-
6.3.3 Berkshire Hathaway Inc.
-
6.3.4 Ping An Insurance (Group) Company of China, Ltd.
-
6.3.5 Cigna Corporation
-
6.3.6 CHINA LIFE INSURANCE COMPANY LIMITED
-
6.3.7 Anthem, Inc.
-
6.3.8 AETNA HEALTH INSURANCE (THAILAND) PUBLIC COMPANY LIMITED
-
6.3.9 The People's Insurance Company (Group) of China Limited
-
6.3.10 NIPPON LIFE INSURANCE COMPANY
-
- *List Not Exhaustive
-
-
7. MARKET OPPORTUNITIES AND FUTURE TRENDS
Life and Non-Life Insurance Industry Segmentation
This report aims to provide a detailed analysis of the Global Life and Non-Life Insurance market. It focuses on the market dynamics, emerging trends in the segments and regional markets, and insights on various product and application types. Also, it analyses the key players and the competitive landscape in the Global Life and Non-Life Insurance market.
| By Insurance Type | |||||
| |||||
|
| By channel of distribution | |
| Direct | |
| Agency | |
| Banks | |
| Others |
| Geography | ||||||||
| ||||||||
| ||||||||
| ||||||||
| ||||||||
|
Life and Non-Life Insurance Market Research FAQs
What is the current Global Life and Non-Life Insurance Market size?
The Global Life and Non-Life Insurance Market is projected to register a CAGR of less than 3% during the forecast period (2024-2029)
Who are the key players in Global Life and Non-Life Insurance Market?
Massachusetts Mutual Life Insurance Company, Unitedhealth Group Incorporated, Berkshire Hathaway Inc., Ping An Insurance (Group) Company of China, Ltd. and CHINA LIFE INSURANCE COMPANY LIMITED are the major companies operating in the Global Life and Non-Life Insurance Market.
Which is the fastest growing region in Global Life and Non-Life Insurance Market?
Asia Pacific is estimated to grow at the highest CAGR over the forecast period (2024-2029).
Which region has the biggest share in Global Life and Non-Life Insurance Market?
In 2024, the North America accounts for the largest market share in Global Life and Non-Life Insurance Market.
What years does this Global Life and Non-Life Insurance Market cover?
The report covers the Global Life and Non-Life Insurance Market historical market size for years: 2020, 2021, 2022 and 2023. The report also forecasts the Global Life and Non-Life Insurance Market size for years: 2024, 2025, 2026, 2027, 2028 and 2029.
Life & Non-Life Insurance Industry Report
Statistics for the 2024 Life & Non-Life Insurance market share, size and revenue growth rate, created by Mordor Intelligence™ Industry Reports. Life & Non-Life Insurance analysis includes a market forecast outlook to 2029 and historical overview. Get a sample of this industry analysis as a free report PDF download.
