Energy & Power
30th JulyUnlocking Market Potential for Solid-State Transformers
3 Min Read
The Indonesia Power Market Report is Segmented by Power Source (Thermal, Nuclear, and Renewables) and End-User (Utilities, Commercial and Industrial, and Residential). The Market Sizes and Forecasts are Provided in Terms of Installed Capacity (GW).
Market Overview
| Study Period | 2020 - 2030 |
|---|---|
| Base Year For Estimation | 2024 |
| Forecast Data Period | 2025 - 2030 |
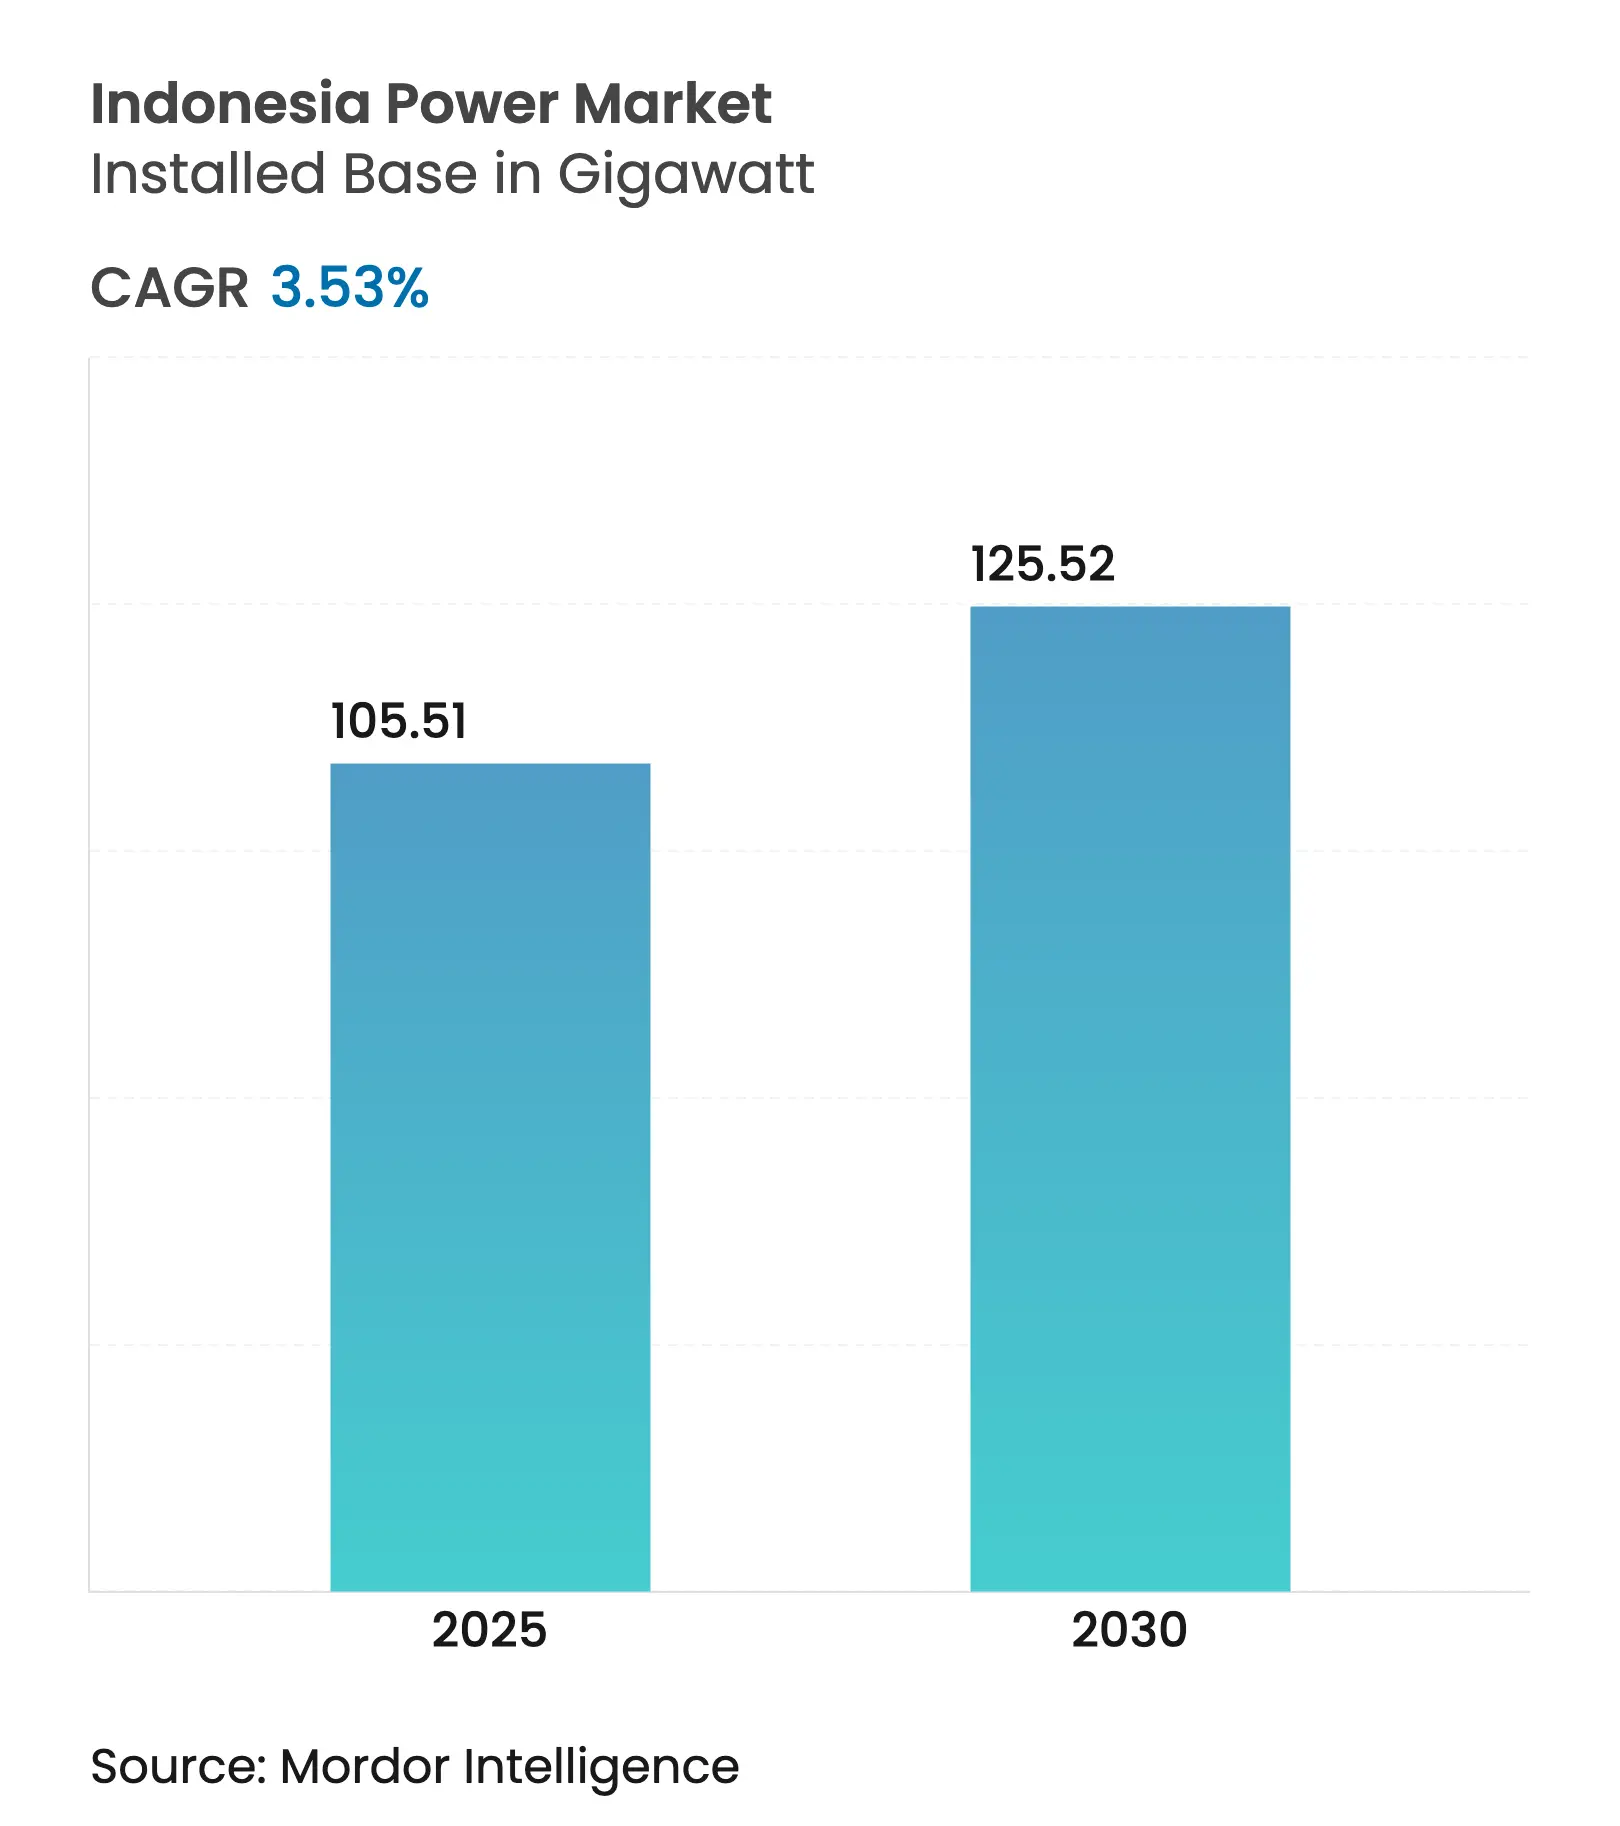
| Market Volume (2025) | 105.51 gigawatt |
| Market Volume (2030) | 125.52 gigawatt |
| CAGR | 3.53 % |
| Market Concentration | High |
Major Players *Disclaimer: Major Players sorted in no particular order. Image © Mordor Intelligence. Reuse requires attribution under CC BY 4.0. |
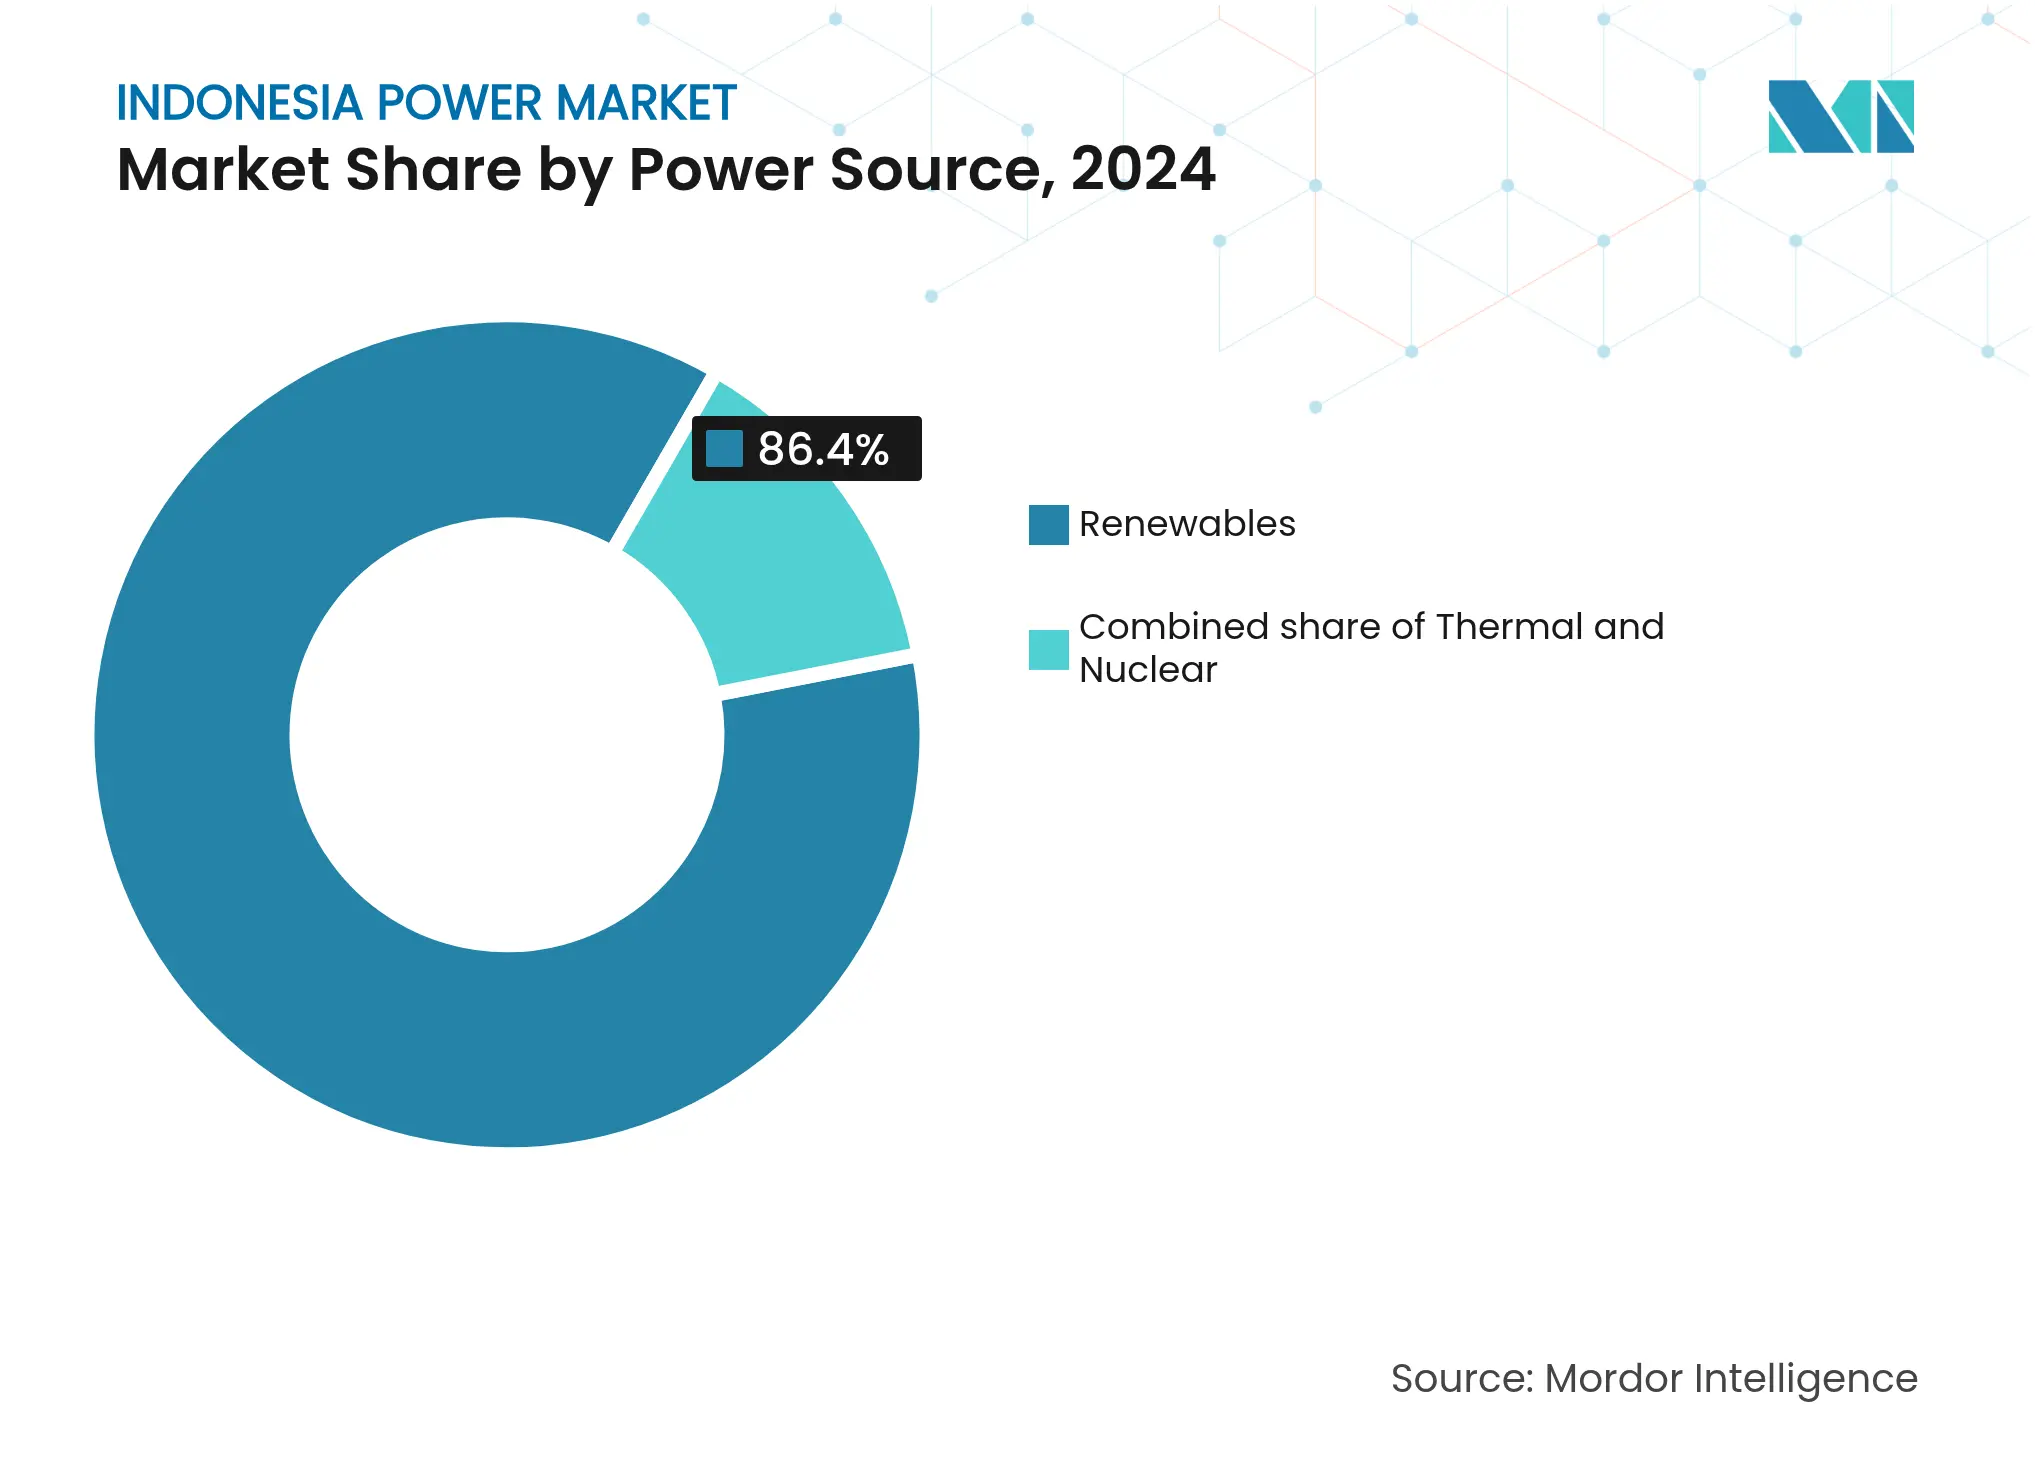
Renewables dominated with an 86.4% Indonesia power market share in 2024 and are also the fastest-growing power source, propelled by the USD 20 billion Just Energy Transition Partnership that accelerates coal retirements. Java-Bali continues to absorb most demand, yet PLN’s USD 112 billion transmission-backbone plan will integrate underused geothermal and hydro capacity in Sumatra, Sulawesi, and Kalimantan.(1)PT PLN, “Annual Report 2025,” pln.co.id Corporate buyers are reshaping the demand profile: captive rooftop solar installations deliver sub-four-year paybacks and are cutting daytime grid load. At the same time, foreign-equity liberalization above 10 MW is attracting international developers, though PLN’s monopsony buying power and tariff caps still compress margins.
Key Report Takeaways
Drivers Impact Analysis
| Driver | (~) % Impact on CAGR Forecast | Geographic Relevance | Impact Timeline | |||
|---|---|---|---|---|---|---|
Government push for renewable-energy capacity auctions Government push for renewable-energy capacity auctions | 1.2% | National, with concentration in Java, Sumatra, Sulawesi | Medium term (2-4 years) | (~) % Impact on CAGR Forecast:1.2% | Geographic Relevance:National, with concentration in Java, Sumatra, Sulawesi | Impact Timeline:Medium term (2-4 years) |
Growing electricity demand from new industrial parks Growing electricity demand from new industrial parks | 0.9% | Java (Karawang, Bekasi, Cikarang), Kalimantan (Batam FTZ) | Short term (≤2 years) | |||
Rapid adoption of captive rooftop solar in C&I segment Rapid adoption of captive rooftop solar in C&I segment | 0.7% | Java-Bali urban corridors, spillover to Surabaya, Medan | Short term (≤2 years) | |||
Upgrade of inter-island transmission backbone (PLN RUPTL 2024-33) Upgrade of inter-island transmission backbone (PLN RUPTL 2024-33) | 0.5% | Sumatra-Java HVDC, Sulawesi-Kalimantan subsea links | Long term (≥4 years) | |||
JETP-funded accelerated coal phase-out unlocking IPP pipeline JETP-funded accelerated coal phase-out unlocking IPP pipeline | 1.4% | National, with priority on Java-Bali coal retirement zones | Medium term (2-4 years) | |||
Omnibus Law liberalising foreign ownership in power projects Omnibus Law liberalising foreign ownership in power projects | 0.8% | National, early gains in Java, Sumatra, Kalimantan | Medium term (2-4 years) | |||
| Source: Mordor Intelligence | ||||||
Government Push for Renewable-Energy Capacity Auctions
Three competitive tender rounds in 2024 awarded 5 GW of solar and wind at record-low average tariffs of USD 0.048 per kWh, 22% below 2023 benchmarks.(2)Ministry of Energy and Mineral Resources, “Auction Guidelines for Renewable Energy 2024,” esdm.go.id Bundled 200-500 MW project lots and 40% local-content thresholds trimmed procurement costs while nurturing domestic manufacturing. Tier-one EPCs such as Mitsubishi Power and Siemens Energy entered bids, increasing technical depth and reinforcing bankability. ISO 9001 certification and adherence to the Indonesian National Standard for grid interconnection lengthen lead times by up to nine months but reduce dispute risk. Collectively, the new auction regime increases developer interest and pulls renewables further down the cost curve.
Growing Electricity Demand from New Industrial Parks
Twenty-three GW of captive load is emerging from nickel processing and EV battery zones, straining the Java and Sumatra grids. President Prabowo’s January 2025 commissioning of 3.22 GW supports these clusters, yet transmission lead times lag behind park build-outs. Industrial off-takers increasingly demand renewable energy certificates for export compliance, driving hybrid on-site generation models. Developers that bundle rooftop solar, storage, and green-certificate services are gaining a foothold. The Indonesian power market is therefore shifting toward solution-based power supply contracts rather than pure kilowatt-hour sales.
Growing Electricity Demand from New Industrial Parks
Twelve new estates added in 2024 require 2.1 GW of firm capacity, led by EV battery, data center, and textile tenants. Karawang International Industrial City alone signed a 25-year 450 MW PPA with PLN. Batam’s FTZ is piloting a solar-diesel-battery microgrid that guarantees 99.9% uptime and signals a template for other parks. The Making Indonesia 4.0 roadmap targets USD 80 billion of manufacturing FDI by 2030, implying an incremental load equal to one 1,000 MW baseload plant each year. Land acquisition remains a bottleneck, stretching substation timelines to nearly two years, but the underlying demand trajectory is firmly upward.
Rapid Adoption of Captive Rooftop Solar in C&I Segment
Behind-the-meter solar additions reached 780 MW in 2024, up 140% year on year, as MEMR Regulation 26/2021 raised the self-consumption cap to 35% of contracted demand. Hypermarkets, cold-storage warehouses, and garment plants now enjoy levelized costs of USD 0.06-0.07 per kWh against PLN’s IDR 1,450 industrial tariff. More than 60% of new arrays include two-to-four-hour batteries, letting factories shift surplus output into evening peaks and further erode grid purchases. PLN’s daytime industrial demand fell 8% in Q3 2024, underscoring the disruptive effect on cross-subsidy revenues. SNI 8395:2017 standards keep interconnections safe but add upfront compliance steps.
Restraints Impact Analysis
| Restraint | (~) % Impact on CAGR Forecast | Geographic Relevance | Impact Timeline | |||
|---|---|---|---|---|---|---|
Subsidised retail tariffs limiting IPP profitability Subsidised retail tariffs limiting IPP profitability | -0.8% | National, acute in residential-heavy regions (Java, Bali) | Medium term (2-4 years) | (~) % Impact on CAGR Forecast:-0.8% | Geographic Relevance:National, acute in residential-heavy regions (Java, Bali) | Impact Timeline:Medium term (2-4 years) |
Slow permitting for land acquisition & social licence Slow permitting for land acquisition & social licence | -0.5% | National, most severe in Sumatra, Kalimantan, Papua | Long term (≥4 years) | |||
Grid instability & curtailment risk in remote islands Grid instability & curtailment risk in remote islands | -0.6% | Eastern Indonesia (Maluku, Papua, Nusa Tenggara) | Long term (≥4 years) | |||
FX-risk on USD-denominated PPAs FX-risk on USD-denominated PPAs | -0.4% | National, affecting all IPP projects with foreign equipment | Medium term (2-4 years) | |||
| Source: Mordor Intelligence | ||||||
Subsidized Retail Tariffs Limiting IPP Profitability
PLN sells power at an average IDR 1,050 per kWh even though its supply cost rose to IDR 1,320 in 2024, creating a USD 4.3 billion annual shortfall covered by state transfers. IPPs' pricing is tied to avoided-cost formulas pegged to coal at USD 70 per tonne, well under current spot levels, squeezing returns. Only 40% of the 5.2 GW auctioned in 2023-2024 have closed financing because debt coverage ratios look thin. A draft 2025 energy bill would allow inflation pass-through, but consumer-advocacy headwinds make approval uncertain. Until tariffs move toward cost-reflective levels, merchant renewables remain risky.
Grid Instability and Curtailment Risk in Remote Islands
A total of 127 isolated diesel mini-grids serve 4.2 million customers, yet lack the inertia to accept high solar or wind penetrations without frequency dips outside 49.5-50.5 Hz. PLN curtailed 340 GWh of renewables in eastern provinces during 2024, equal to 18% of local green output. Adding flywheels or battery buffering costs USD 8-10 million per 10 MW plant, beyond the means of regional subsidiaries. Technical Guideline 02/2024 requires that new projects above 5 MW include 30 minutes of storage, but legacy units remain exempt and unresolved. IEEE 1547 standards are mandatory, yet many legacy mini-grids lack the telemetry to comply.
By Power Source: Renewables Surge Reshapes Fuel Mix as Coal Stagnates
Renewables captured an 86.4% Indonesia power market share in 2024, and their 15.5% CAGR is four times faster than overall demand. Geothermal alone added 580 MW in 2024, highlighted by Pertamina Geothermal Energy’s 220 MW Rantau Dedap plant, delivering baseload at USD 0.065 per kWh.(3)PT Pertamina Geothermal Energy, “Rantau Dedap Project Brief 2025,” pertamina.com Solar PV installations hit 1.2 GW, evenly split between utility auctions and C&I rooftops, while wind reached 180 MW in South Sulawesi. Coal’s 13.2% share stagnated as JETP financing accelerates the retirement of 9.2 GW of subcritical plants. Natural-gas potential remains hampered by price caps that deter upstream investment.
Thermal economics continue to weaken as the implicit carbon price in JETP funding lifts coal’s levelized cost by USD 0.015-0.020 per kWh. Biomass and waste-to-energy climbed to 340 MW, helped by tipping-fee support, yet face feedstock logistics gaps outside Java. Tidal power is still at a 3 MW pilot scale in the Lombok Strait. Nuclear capacity remains at zero, although a 2024 memorandum with Korea Hydro & Nuclear Power began feasibility work on 300 MW of small modular reactors for post-2035 commissioning. Environmental-impact assessments under Law 32/2009 and PLN interconnection approvals typically add up to 18 months to renewable project schedules.
Note: Segment shares of all individual segments available upon report purchase
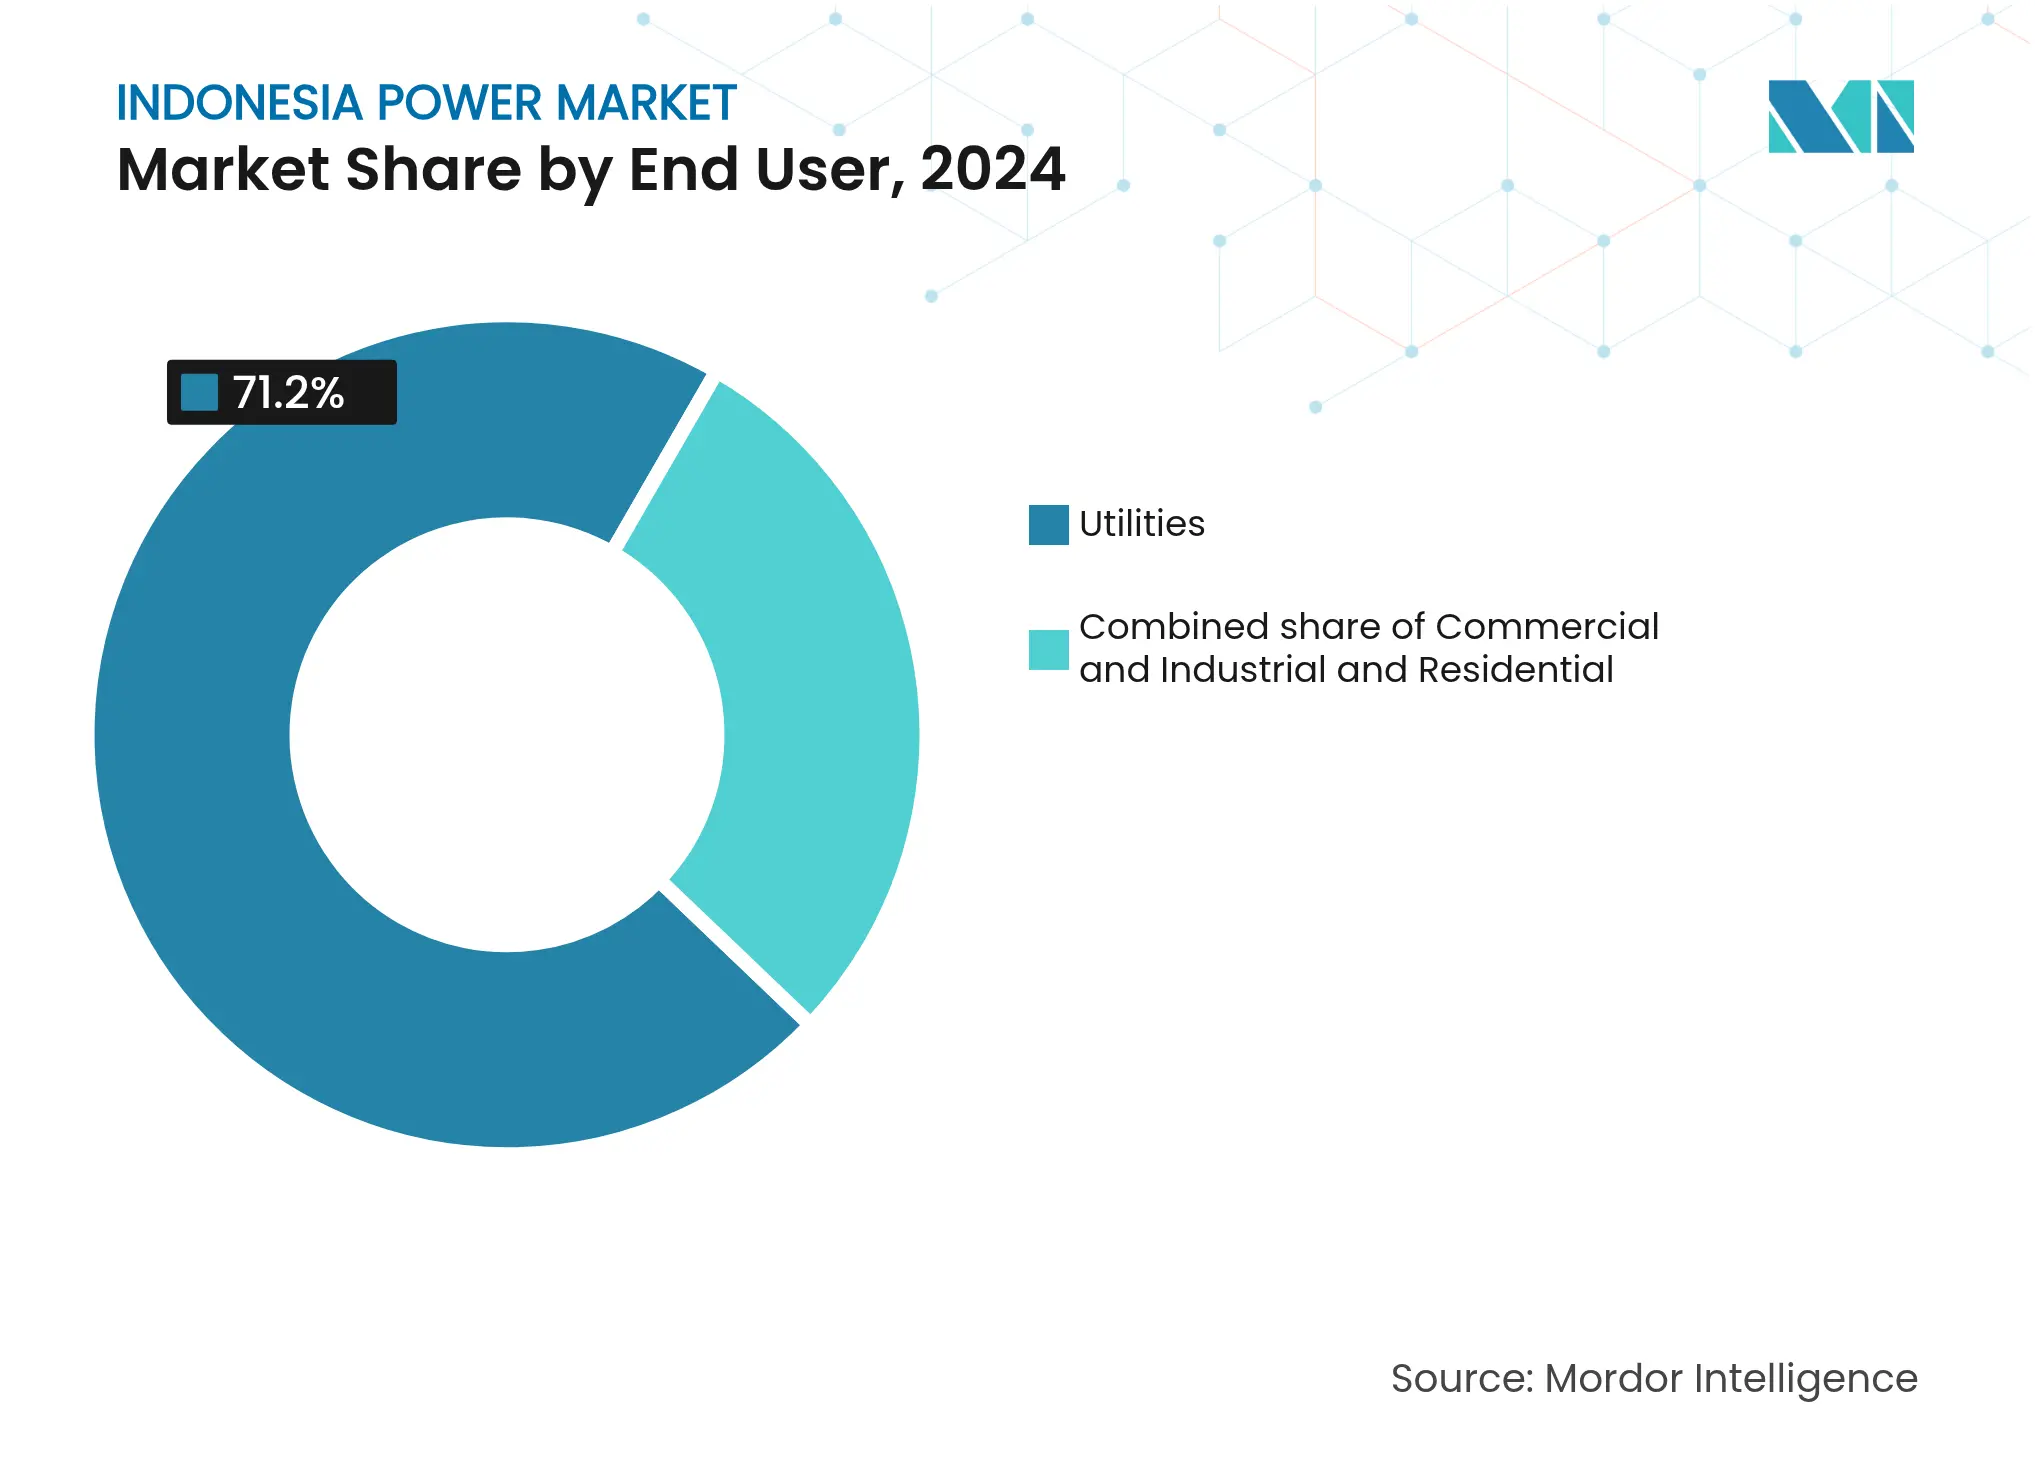
By End User: Utilities Dominance Masks C&I Captive-Solar Disruption
Utilities served 71.2% of demand in 2024, underscoring PLN’s statutory supply duty. However, the commercial and industrial slice is growing at a 9.9% CAGR to 2030, primarily through captive solar that sidesteps grid tariffs. Manufacturing hubs in Karawang, Bekasi, and Cikarang routinely pair 1-3 MW rooftops with multi-hour batteries, achieving daytime self-sufficiency and net-metering credits valued at 65% of retail tariffs. Data centers consumed 1.8 TWh in 2024 and are striking 24/7 carbon-free PPAs directly with IPPs, creating precedent for other large users.
Residential consumption grew only 2.1% in 2024 as subsidized tariffs dampened efficiency incentives and rooftop-solar economics. Electrification reached 99.2%, but rural Papua and Maluku still endure outages exceeding 15% annually. A 2024 subsidy-reform proposal would replace blanket discounts with targeted vouchers, potentially improving rooftop-solar viability once tariffs become cost-reflective. MEMR Regulation 26/2021 permits residential net metering up to 10 kW, yet adoption remains under 5% due to limited consumer awareness and upfront costs.
Note: Segment shares of all individual segments available upon report purchase
Java-Bali supplied 61% of the national load in 2024, underpinned by a 500 kV backbone and an industrial corridor that includes Jakarta, Surabaya, and Semarang.(4)PT Pertamina Geothermal Energy, “Rantau Dedap Project Brief 2025,” pertamina.com Installed capacity reached 42 GW, with coal plants in Banten and East Java providing baseload while solar and geothermal projects displace aging oil-based peakers. Greater Jakarta added 320 MW of rooftop solar in 2024 as multinationals chase renewable targets and hedge against a 4.2-hour monthly outage average. Peak-demand growth of 4.8% per year is straining substations, motivating a USD 5.3 billion distribution upgrade through 2027. Java-Bali is also PLN’s pilot zone for deploying 1.5 GW/6 GWh of utility-scale batteries by 2030.
Sumatra delivered 18% of generation in 2024, leveraging hydro in Aceh and North Sumatra, plus geothermal in Lampung. Once the 3,000 MW Sumatra-Java HVDC line enters service in 2027, curtailment is expected to fall sharply, lifting utilization of 2.1 GW of stranded hydro. Kalimantan and Sulawesi each contributed around 8% of demand, driven by coal mines and nickel smelters whose loads grow at a 7.2% CAGR. Both islands are targeted for subsea interconnectors that will facilitate power flows and integrate emerging renewables.
Eastern Indonesia, Maluku, Papua, and Nusa Tenggara, remains the weakest link. Diesel-based generation costs exceed USD 0.25 per kWh, and 127 mini-grids suffer high curtailment of solar and wind. PLN plans USD 15 billion of subsea links to unlock 1.8 GW of hydro and geothermal, but permitting delays and social-license issues with indigenous groups persist. All regions must follow MEMR technical guidelines for interconnection and environmental assessments under Law 32/2009, with provincial offices enforcing local-content clauses.

Reports are available across multiple geographies.
Gain in-depth market insights across regions to support informed decisions.
Market Concentration
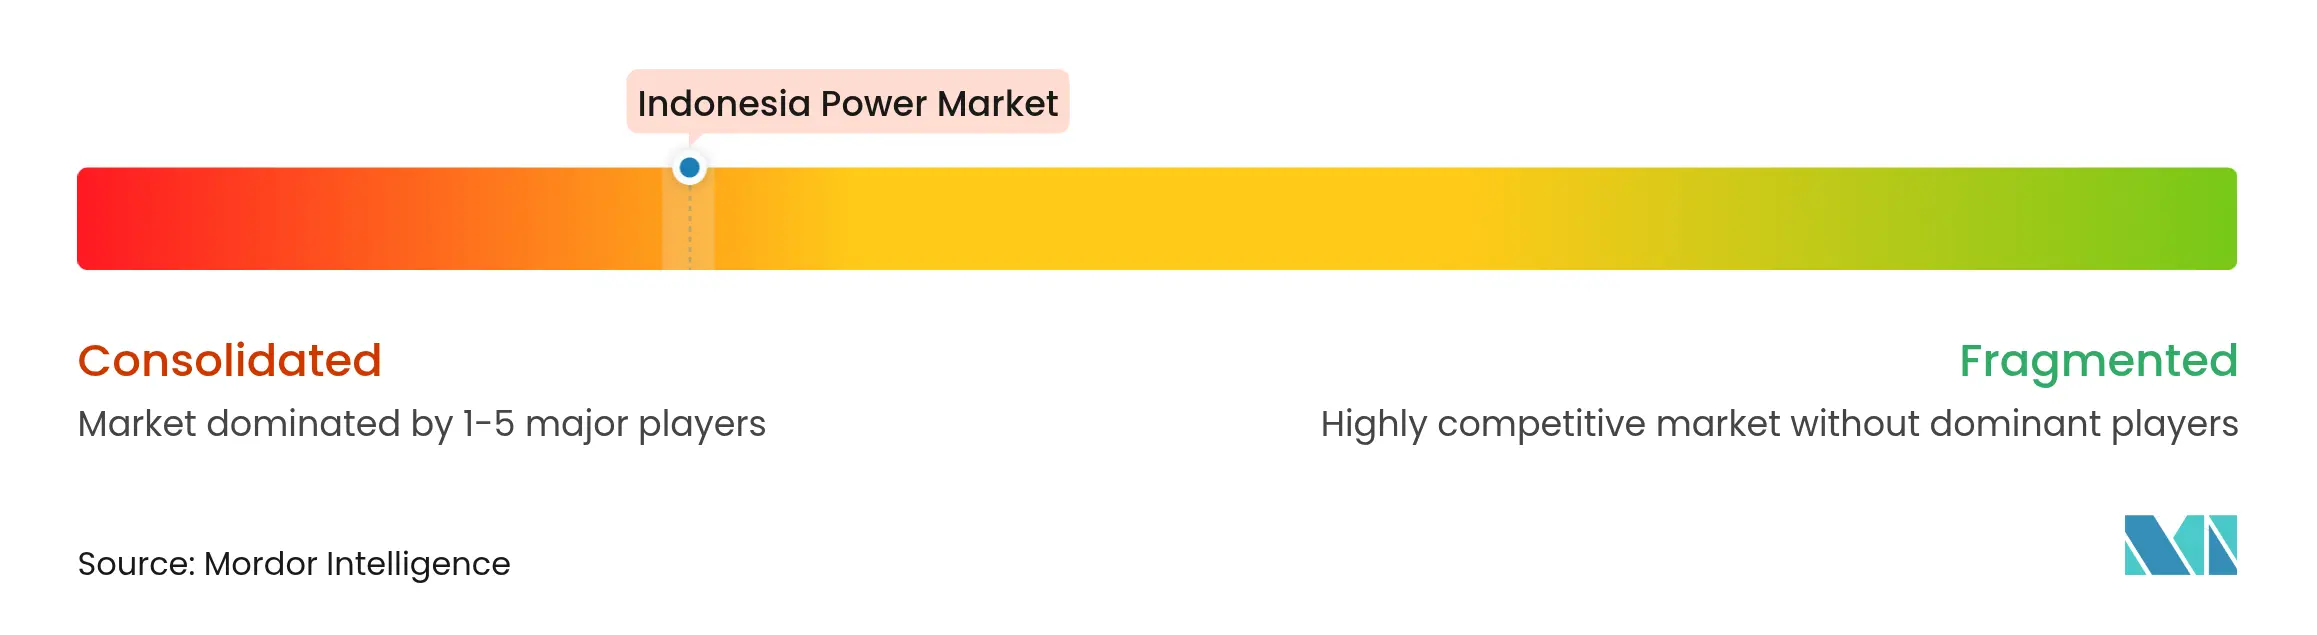
PT PLN retains a statutory monopoly over transmission, distribution, and wholesale dispatch, making it the pivotal buyer for all electricity. Among IPPs, 47 developers compete on engineering cost and PPA tenor rather than retail price because PLN caps tariffs at avoided-cost benchmarks. PT Paiton Energy, PT Jawa Power, and PT Cirebon Power Services command 6.8 GW of coal baseload but face accelerated depreciation as JETP funding prioritizes early retirements. Geothermal leadership lies with PT Pertamina Geothermal Energy, PT Supreme Energy, and PT Star Energy Geothermal, which collectively run 2.1 GW and hold 3.4 GW of exploration licenses.
Strategic pivots intensified in 2024-2025. PT Adaro Energy Indonesia bought 35% of PT Geo Dipa Energi for USD 420 million in March 2025, signaling a diversification away from coal. Canadian Solar teamed with PT PP (Persero) to co-develop 800 MW of solar-plus-storage in East Java, leveraging local-content rules for module assembly. Emerging disruptors such as PT Cikarang Listrindo and PT Bekasi Power operate captive plants for industrial parks and are retrofitting coal units for biomass co-firing. PLN issued a 500 MW/2 GWh battery tender in November 2024, drawing bids from CATL, BYD, and Fluence Energy, showing a shift to renewables firming rather than new gas peakers. The Electricity Regulatory Commission caps developer IRRs at 12% and enforces transparent bid criteria to maintain competitive neutrality.(5)Electricity Regulatory Commission, “IPP Bid Evaluation Framework 2025,” esdm.go.id

*Disclaimer: Major Players sorted in no particular order
1. Introduction
2. Research Methodology
3. Executive Summary
4. Market Landscape
5. Market Size & Growth Forecasts
6. Competitive Landscape
7. Market Opportunities & Future Outlook
Power generation is electricity generated through various primary sources such as coal, hydro, solar, thermal, etc. In utilities, it's a step before its delivery to its end users. Then, the process is followed by transmission and distribution. Under this, the power generated is distributed via high-voltage lines (transmission lines) and low-voltage lines (distribution lines) as per the requirement of the end user. Indonesia's power market report includes:
Unlocking Market Potential for Solid-State Transformers
3 Min Read
Wealth Management Intelligence for the Middle East
4 Min Read
When decisions matter, industry leaders turn to our analysts. Let’s talk.