
Enteral Feeding Formulas Market Size and Share
Market Overview
| Study Period | 2022 - 2031 |
|---|---|
| Market Size (2026) | USD 9.69 Billion |
| Market Size (2031) | USD 12.44 Billion |
| Growth Rate (2026 - 2031) | 5.12 % |
| Fastest Growing Market | Asia-Pacific |
| Largest Market | North America |
| Market Concentration | Medium |
Major Players *Disclaimer: Major Players sorted in no particular order Image © Mordor Intelligence. Reuse requires attribution under CC BY 4.0. | |
Enteral Feeding Formulas Market Analysis by Mordor Intelligence
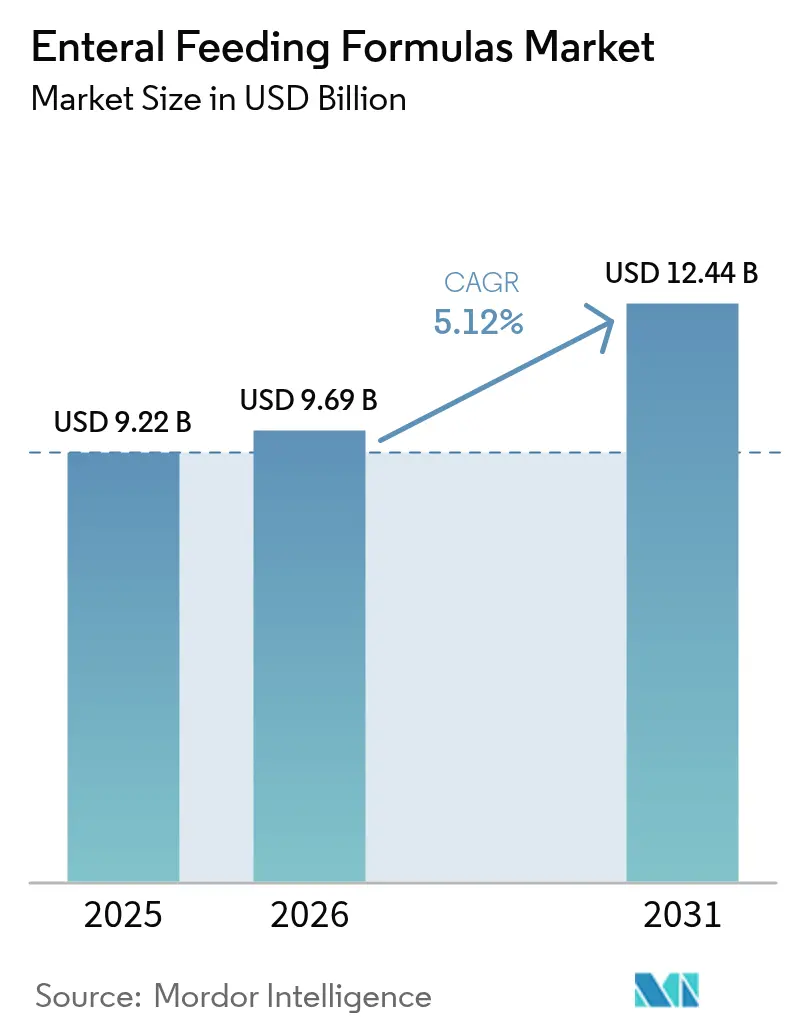
The Enteral Feeding Formulas Market size is expected to increase from USD 9.22 billion in 2025 to USD 9.69 billion in 2026 and reach USD 12.44 billion by 2031, growing at a CAGR of 5.12% over 2026-2031.
Demand is being propelled by demographic aging, wider use of enteral nutrition for chronic disease management, and the steady shift of complex feeding regimens from hospitals to homes. The growing preference for whole-food ingredients, advances in closed-loop delivery systems, and reimbursement models that reward lower-cost care settings are reinforcing adoption. At the same time, portable pumps with wireless connectivity are lowering technical barriers for caregivers, and outcome-linked payment programs are steering providers toward formulas with proven clinical benefits. Competitive differentiation is now centered on disease-specific compositions, plant-based proteins, and smart infusion technologies that reduce infection and misconnection risks.
Key Report Takeaways
- By product type, standard polymeric formulas led with 53.78% of the enteral feeding formulas market share in 2025; blenderized real-food products are forecast to expand at a 7.54% CAGR through 2031.
- By caloric density, isocaloric blends captured 45.42% share of the enteral feeding formulas market size in 2025, while hypercaloric variants are advancing at a 7.88% CAGR over 2026-2031.
- By end user, hospitals and acute-care centers held 61.48% of the enteral feeding formulas market share in 2025, whereas home enteral nutrition is projected to grow at an 8.54% CAGR through 2031.
- By age group, adults accounted for 53.25% of consumption in 2025 and pediatric formulas are rising at an 8.32% CAGR through 2031.
- By geography, North America dominated with 41.86% revenue share in 2025; Asia-Pacific is poised to record a 6.43% CAGR between 2026 and 2031.
Note: Market size and forecast figures in this report are generated using Mordor Intelligence’s proprietary estimation framework, updated with the latest available data and insights as of 2026.
Global Enteral Feeding Formulas Market Trends and Insights
Drivers Impact Analysis*
| Driver | (~) % Impact on CAGR Forecast | Geographic Relevance | Impact Timeline |
|---|---|---|---|
| Rising Burden of Chronic and Age-Related Diseases | +1.2% | Global, with acute impact in Japan, Europe, and North America | Long term (≥ 4 years) |
| Cost Advantage of Enteral Versus Parenteral Nutrition | +0.9% | Global, particularly North America, Europe, and emerging APAC markets | Medium term (2-4 years) |
| Expansion of Home Healthcare Infrastructure | +1.0% | North America and Europe core, expanding to urban APAC and Latin America | Medium term (2-4 years) |
| Technological Advancements in Enteral Pumps and Closed Systems | +0.7% | Global, with early adoption in North America and Western Europe | Short term (≤ 2 years) |
| Product Innovation in Disease-Specific and High-Protein Formulas | +0.8% | Global, with premium uptake in developed markets | Medium term (2-4 years) |
| Adoption of Value-Based Care and Outcome-Linked Reimbursement Models | +0.6% | North America and select European markets | Long term (≥ 4 years) |
| Source: Mordor Intelligence | |||


Rising Burden of Chronic and Age-Related Diseases
The global population of people aged 70+ in 2024 was 494.4 million and is expanding steadily as life expectancy rises and fertility falls[1]United Nations, “World Population Prospects 2024,” un.org. Chronic ailments such as stroke, dementia, and cancer frequently impair swallowing or elevate metabolic demands, making long-term enteral feeding essential. Japan illustrates this trend, where citizens aged 65 + represent 29.1% of the population and dysphagia prevalence exceeds 50%. China has more than 280 million people aged 60+, and it is investing in geriatric care centers that routinely prescribe texture-modified formulas. Globally, non-communicable diseases now cause 74% of deaths, reinforcing demand for nutritionally complete formulas that lower complication risks.
Cost Advantage of Enteral Versus Parenteral Nutrition
Enteral regimens deliver nutrients at 30-50% lower cost than parenteral therapy because they avoid sterile compounding and the need for central venous access. Meta-analyses show that early tube feeding reduces bloodstream infections by 40% and shortens intensive-care stays by 2.3 days, saving USD 8,000-12,000 per patient. In 2025, the U.S. Centers for Medicare & Medicaid Services expanded bundled payments that reward hospitals for deploying cost-effective enteral protocols[2]Centers for Medicare & Medicaid Services, “Bundled Payments for Care Improvement,” cms.gov. Emerging health systems in Latin America and the Asia-Pacific are likewise adopting tube feeding to reduce overall treatment expenditure.
Expansion of Home Healthcare Infrastructure
Home enteral nutrition is growing at 8.54% as lightweight pumps and telehealth oversight let caregivers administer feeds safely outside hospitals. U.S. Medicare Part B covers formulas and supplies for permanent feeding-tube users, encouraging earlier discharge. European payers in Germany, France, and the United Kingdom have expanded reimbursement for home care, while Japan’s long-term care insurance subsidizes supplies for elders. Clinical trials confirm that home programs lower infection rates and reduce total care costs by about 40% compared with long-term facilities.
Technological Advancements in Enteral Pumps and Closed Systems
Mandatory ENFit connectors under ISO 80369-3 are minimizing misconnections that previously caused severe harm. The FDA issued 2024 guidance that accelerated adoption, triggering replacement demand for legacy sets. Closed systems have cut bacterial contamination by 60% in multicenter studies, while smart pumps notify users of occlusions in real time, easing nursing workload.
Restraints Impact Analysis*
| Restraint | (~) % Impact on CAGR Forecast | Geographic Relevance | Impact Timeline |
|---|---|---|---|
| Variable Reimbursement And Insurance Coverage Globally | -0.8% | Emerging APAC, MEA, Latin America; state-level variability in North America | Medium term (2-4 years) |
| Clinical Complications Such As Aspiration Pneumonia And GI Intolerance | -0.5% | Global, higher incidence in acute-care and long-term care settings | Short term (≤ 2 years) |
| Supply Chain Volatility For Medical-Grade Macronutrient Inputs | -0.4% | Global, more acute where dairy protein imports dominate | Medium term (2-4 years) |
| Limited Clinical Evidence For Emerging Plant-Based And Blenderized Formulas | -0.3% | North America and Europe initially, expanding into APAC | Short term (≤ 2 years) |
| Source: Mordor Intelligence | |||
Variable Reimbursement and Insurance Coverage Globally
Coverage differs widely by country and insurer, limiting access in price-sensitive regions. U.S. Medicaid policies vary by state, sometimes requiring prior authorization that delays therapy. In India, the Ayushman Bharat scheme excludes enteral nutrition, forcing many families to self-fund[3]Government of India, “Ayushman Bharat scheme benefits,” india.gov.in. Out-of-pocket costs can exceed 50% of annual household income in several Latin American markets, thereby restricting the uptake of premium, disease-specific blends.
Clinical Complications Such as Aspiration Pneumonia and GI Intolerance
Aspiration pneumonias occur in 5-15% of tube-fed patients and carry mortality up to 65%, prompting cautious initiation, especially in ventilated or neurologically impaired cases. Gastrointestinal intolerance—diarrhea, constipation, bloating—affects up to 30% of recipients and often leads to feed interruptions. Although blenderized and fiber-enriched formulas improve tolerance, higher prices and patchy reimbursement hinder widespread substitution.
*Our forecasts treat driver/restraint impacts as directional, not additive. The impact forecasts reflect baseline growth, mix effects, and variable interactions.
Segment Analysis
By Product Type: Whole-Food Formulas Reshape Synthetic Dominance
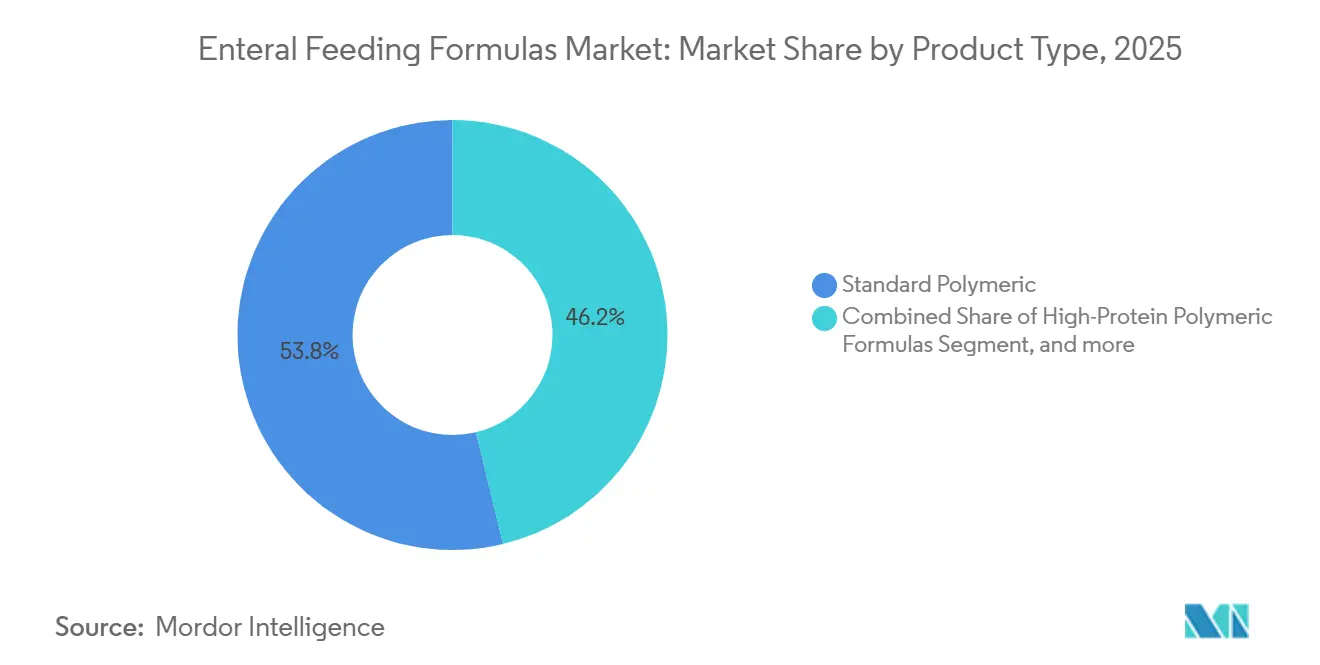
Standard polymeric blends controlled 53.78% of 2025 revenue, reflecting broad clinical familiarity and favorable payment status. Yet the enteral feeding formulas market is shifting as blenderized real-food options post a 7.54% CAGR, propelled by evidence of better bowel regularity and caregiver preference for recognizable ingredients. High-protein lines aimed at oncology and critical-care patients are rising, while peptide-based semi-elemental and elemental amino-acid variants are used for malabsorption or severe allergy cases. Disease-specific innovations, notably diabetes and renal formulas, command premium pricing through validated metabolic benefits. Plant-based entrants such as Kate Farms are winning share by replacing dairy proteins with pea isolates, reinforcing the perception that allergen-light compositions reduce intolerance.
A growing subset of immune-modulating products enriched with arginine and omega-3s is demonstrating 30% fewer postoperative infections, making them attractive despite higher unit costs. These shifts underscore a broader re-orientation of the enteral feeding formulas market toward differentiated formulations that address tolerance, metabolic control, and patient preferences simultaneously.


By Caloric Density: Hypercaloric Blends Meet Volume Constraints
Isocaloric offerings at 1.0 kcal/ml held 45.42% of segment revenue in 2025, but hypercaloric formats at 1.2-1.5 kcal/ml are tracking a 7.88% CAGR as clinicians seek to meet energy goals in fluid-restricted patients. Very-high-calorie products above 2.0 kcal/ml remain niche due to viscosity challenges that can occlude pumps. Manufacturers are lowering osmolality to curb diarrhea, broadening acceptance. This focus on concentrated nutrition aligns with shorter hospital stays and sicker inpatients who require rapid repletion, reinforcing growth prospects for dense blends in the enteral feeding formulas market.
By End-User: Home Settings Grow Fastest
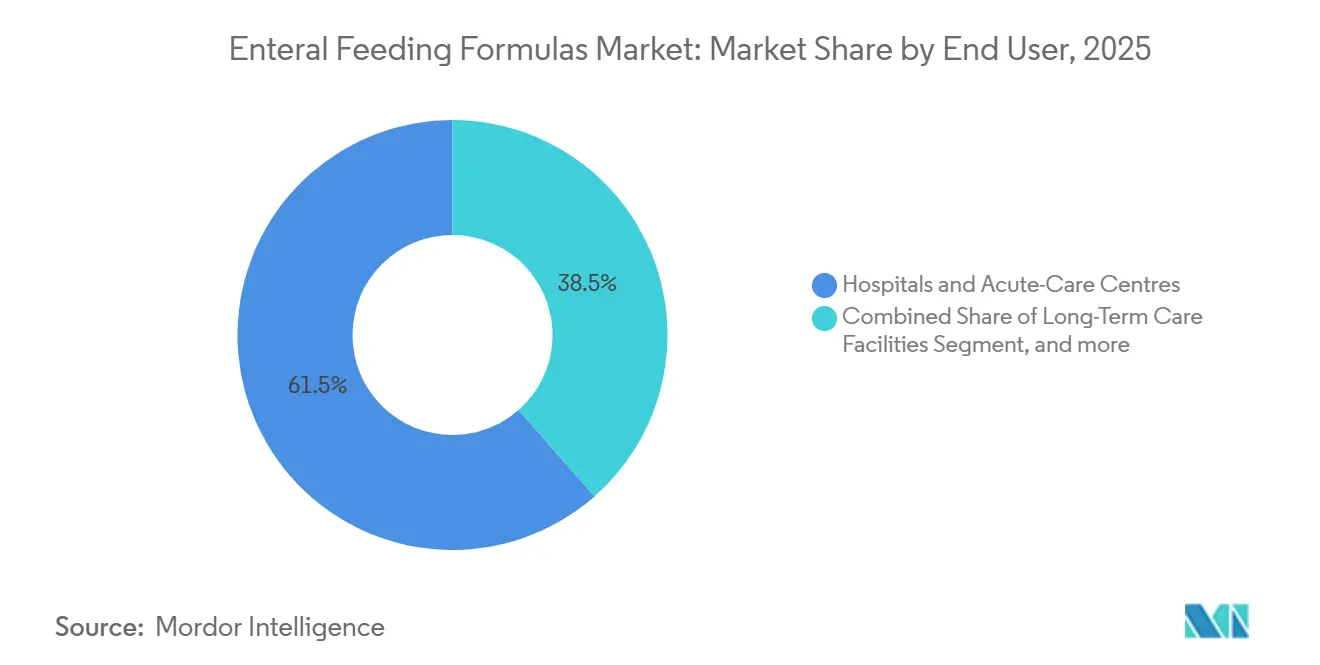
Hospitals accounted for 61.48% of 2025 demand, yet home enteral programs are expanding at 8.54% as payers emphasize cost-effective after-care. Closed systems, combined with lightweight, Bluetooth-enabled pumps, are empowering lay caregivers, and telehealth reimbursement enables dietitians to adjust regimens remotely. Long-term care facilities remain steady buyers of geriatric dysphagia products, but the highest incremental volume through 2031 will stem from home settings, underscoring how the enteral feeding formulas industry is migrating closer to patients.
By Age Group: Pediatric Segment Leads Growth
Adults dominated consumption at 53.25% in 2025, reflecting cancer and trauma prevalence, yet pediatric formulas are registering the fastest rise at 8.32% CAGR. Exclusive enteral nutrition induces remission in up to 80% of pediatric Crohn’s disease cases, while neonatal feeds for preterm infants reduce the risk of necrotizing enterocolitis. Brands such as Nestlé Compleat Pediatric, which blend whole-food ingredients, have improved tolerance, further accelerating momentum in the enteral feeding formulas market.
Geography Analysis
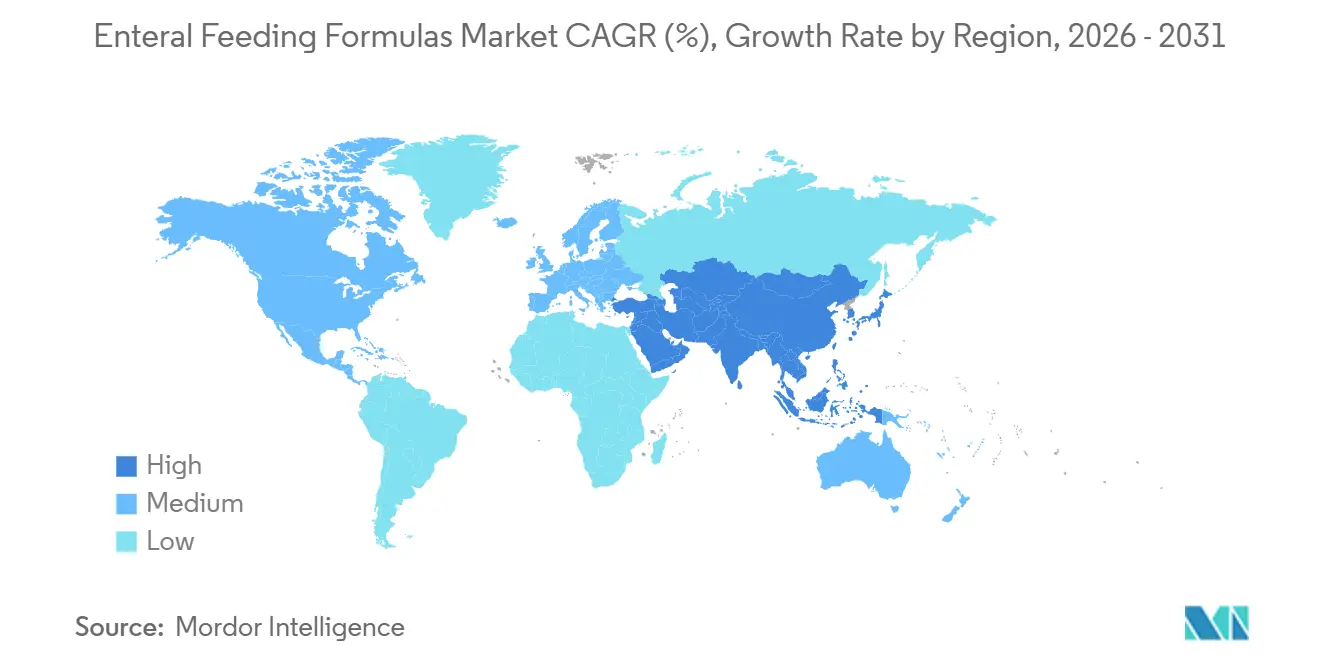
North America generated 41.86% of global revenue in 2025 thanks to Medicare Part B coverage, advanced home-care networks, and value-based payment models that penalize readmissions. Canada shows province-level variation, whereas Mexico’s growth depends on public hospital investment and private insurance uptake.
Asia-Pacific is the fastest-growing region, with a 6.43% CAGR. Japan’s super-aged society and national long-term care insurance drive sustained demand for nutrient-dense formulas. China’s Healthy China 2030 roadmap is expanding medical-nutrition offerings across tertiary and community facilities. India’s urban private hospitals are early adopters, but high out-of-pocket costs still curb rural penetration.
Europe benefits from comprehensive national health systems that reimburse hospital and home feeds. Germany negotiates rates via sickness funds, France covers 100% for chronic disease, and the United Kingdom uses formularies that increasingly favor cost-effective blends. Southern European countries are broadening home support programs to relieve inpatient pressure.

Regulatory Landscape
Enteral feeding formulas fall under both foods for special medical purposes and regulated delivery hardware, so market access depends on nutrition compliance as well as device requirements. In the United States, enteral feeding devices such as gastrointestinal tubes and accessories are regulated by the FDA as Class II devices (including product codes KDH and NGU) and commonly require 510(k) clearance. FDA-recognized consensus standards also shape performance and safety expectations for connected administration sets, with connector safety and inspection practices central to compliance when formulators bundle formulas with sets and pumps. Connector safety and inspection practices anchor compliance as formulators bundle formulas with sets and pumps; ISO 80369-3 (ENFit) adoption supports replacement of legacy connectors, and manufacturers align designs with standards such as ISO 20695 for enteral feeding systems. On the quality side, the FDA implemented a new medical-device manufacturing inspection process on February 2, 2026, which changes audit readiness expectations for companies producing enteral hardware used alongside formulas.
In Europe, Regulation (EU) 2017/745 (MDR) remains the primary medical-device framework as of January 1, 2026. Commission Implementing Regulation (EU) 2025/1234 (effective June 25, 2025) also enables electronic instructions for use for professional-use devices, which affects labeling workflows for enteral delivery systems sold with formula programs.
Value Chain Analysis
The value chain starts with medical-grade macronutrient and functional input sourcing, including dairy- and plant-derived proteins (for example whey isolates and soy), carbohydrates, lipids, fiber and prebiotics (such as chicory-derived ingredients), and micronutrient premixes. After formulation and scale-up, production shifts to aseptic or high-hygiene manufacturing, then packaging into ready-to-hang or closed-system containers, alongside quality control focused on stability, osmolarity, viscosity, and tube compatibility.
Distribution then moves through hospital procurement, group purchasing organizations, and home enteral nutrition channels where formulas, pumps, administration sets, and accessories are coordinated. Logistics complexity rises for closed systems and high-turn home delivery models. FrieslandCampina Ingredients completed an expansion at Borculo, Netherlands in March 2026, doubling capacity for whey protein isolate and milk fat globule membrane, strengthening the supply base for high-protein and specialty formulations. Supply continuity fragility remains linked to manufacturing disruptions and raw-material constraints, which increases the importance of dual sourcing and contingency formulations to manage substitutions without compromising patient outcomes.
Competitive Landscape
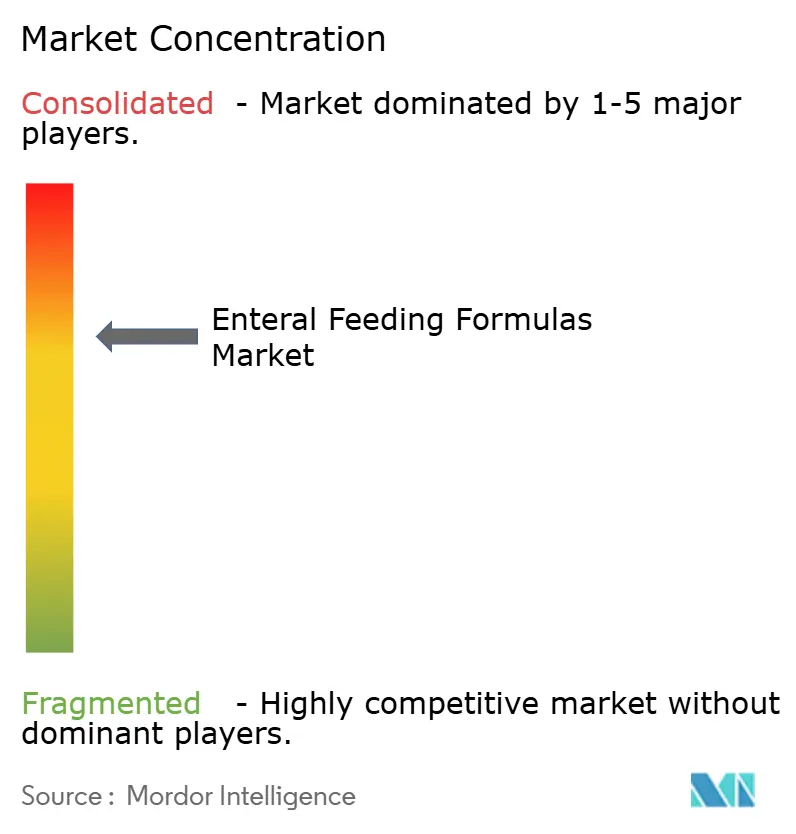
Abbott, Fresenius Kabi, and Nestlé Health Science anchor a moderately consolidated field, leveraging broad portfolios, global manufacturing facilities, and clinical datasets to meet reimbursement criteria. Abbott’s nutrition revenue reached USD 8.3 billion in 2023, buoyed by Ensure and Glucerna. Fresenius Kabi combines hospital channel strength with new FDA-cleared closed-system launches, while Nestlé has added plant-based and clean-label subsidiaries to address evolving consumer tastes.
Disruptors such as Kate Farms and Real Food Blends are carving out niches through plant-based proteins and blenderized recipes. Investor funding of USD 200 million positions Kate Farms for international expansion. Danone and Baxter are focusing on immune-modulating and hypercaloric innovations, respectively, aiming for differentiated efficacy claims that resonate in outcome-linked reimbursement climates. Technological edge—closed bags, ENFit compliance, antimicrobial tubing, and smart pump integration—is an escalating battleground across the enteral feeding formulas market.
Enteral Feeding Formulas Industry Leaders
Abbott Laboratories
Nestle SA
Reckitt Benckiser Group plc. (Mead Johnson)
Danone S.A.
Fresenius SE & Co. KGaA
- *Disclaimer: Major Players sorted in no particular order

Market Opportunities and Future Outlook
Capacity expansion and localization are creating room for suppliers that can secure reliable protein inputs and sterile production at scale, while supporting hospital-to-home transitions. Danone Nutricia is expanding its Wuxi, China plant with automated sterilization lines (October 2025), FrieslandCampina Ingredients completed an expansion at Borculo, Netherlands that doubled capacity for whey protein isolate and milk fat globule membrane (March 2026), and Mead Johnson is moving forward with a large modernization plan for its Zeeland, Michigan facility after local site plan approval for a multiphase project with a cited budget of USD 836 million (June 2026).
For enteral formula vendors, these investments improve the supply base for high-protein and specialized formulations and help maintain regional availability as reimbursement and hospital discharge pathways increasingly favor home enteral programs.
Recent Industry Developments
- May 2026: Nestle Health Science announced a licensing agreement with IdB Holding S.p.A. to develop and commercialize VOWST in Europe, subject to European Medicines Agency approval. While VOWST is a microbiome therapeutic, the agreement broadens Nestle's medical portfolio alongside its clinical nutrition footprint and extends engagement with specialty care pathways that can overlap with enteral feeding utilization.
- December 2025: Abbott launched two new Ensure Max Protein shakes and outlined expanded retail distribution beginning in April 2026. The launch increases Abbott's protein-focused nutrition presence in retail and supports broader demand for high-protein formulations that also connect to innovation themes across clinical nutrition portfolios.
- May 2024: Danone completed the acquisition of Functional Formularies in the United States, adding whole-foods tube-feeding products to its medical nutrition business. The transaction strengthened Danone's position in blenderized real-food enteral formats and expanded its ability to serve home enteral nutrition programs that prioritize recognizable ingredient profiles.


Research Methodology Framework and Report Scope
Market Definition and Coverage
This market covers ready-to-use and powder enteral feeding formulas that are given through a feeding tube, or as medically supervised oral nutrition when required. The value reflects product sales in USD across the care settings where enteral nutrition is used.
Scope exclusions: Parenteral nutrition products, enteral pumps and giving sets, and hospital nutrition service fees are not counted in this sizing.
Segmentation Overview
- By Product Type
- Standard Polymeric Formulas
- High-Protein Polymeric Formulas
- Peptide-Based / Semi-Elemental Formulas
- Elemental (Amino-Acid) Formulas
- Disease-Specific Formulas
- Immune-Modulating / Synbiotic Formulas
- Blenderized Real-Food Formulas
- By Caloric Density
- Low Energy (<1.0 kcal/ml)
- Isocaloric (≈1.0 kcal/ml)
- Hypercaloric (1.2–1.5 kcal/ml)
- Very-High Calorie (≥2.0 kcal/ml)
- By End-User
- Hospitals & Acute-Care Centres
- Long-Term Care Facilities
- Home Enteral Nutrition (HEN)
- Out-Patient / Ambulatory Clinics
- By Age Group
- Neonates (0-28 Days)
- Pediatrics (1 Month–17 Yrs)
- Adults (18-64 Yrs)
- Geriatrics (≥65 Yrs)
- Geography
- North America
- United States
- Canada
- Mexico
- Europe
- Germany
- United Kingdom
- France
- Italy
- Spain
- Rest of Europe
- Asia-Pacific
- China
- Japan
- India
- Australia
- South Korea
- Rest of Asia-Pacific
- Middle East & Africa
- GCC
- South Africa
- Rest of Middle East & Africa
- South America
- Brazil
- Argentina
- Rest of South America
- North America
Data Sources, Market Sizing, and Validation
Desk Research
Desk research was used to set the starting boundaries and to collect consistent, repeatable demand signals that can be checked year to year. We referenced public sources such as the World Health Organization, Centers for Disease Control and Prevention, the US FDA, and the OECD health statistics program to frame aging trends, chronic disease burden, and care delivery patterns that influence tube feeding use.
We also reviewed sources such as peer-reviewed clinical nutrition journals, national health service procurement or formulary notes where available, and customs and trade statistics for nutrition preparations in key importing markets. In parallel, we checked annual reports and investor presentations from major nutrition suppliers to understand product mix and pricing direction. Where needed, paid subscriptions for company financials and patent databases were used to sanity-check product pipelines and revenue exposure, without treating them as the single point of truth. These examples are not exhaustive, and many other public sources were reviewed for data collection, validation, and clarification.
Primary Interviews and Surveys
Primary work focused on making the sizing assumptions realistic, especially where published datasets do not clearly separate enteral formulas by product type or site of care. We spoke with stakeholders across manufacturers, distributors, clinical nutrition teams, and home enteral nutrition providers across the Americas, EMEA, and APAC, so utilization patterns, mix shifts, and price movements could be confirmed and then applied consistently in the model.
Distribution of primary research fieldwork respondents
| Company type | Respondent position | Region |
|---|---|---|
| Top tier: 39% | CXOs: 12% | APAC: 46% |
| Mid tier: 44% | Functional/Unit leaders: 39% | EMEA: 31% |
| Smaller Players: 17% | Managers: 49% | Americas: 23% |
Market-Sizing & Forecasting
Sizing starts with a top-down build where the demand pool is reconstructed from care setting and patient need signals, then narrowed to enteral formula consumption in value terms. To keep totals grounded, we also run selective bottom-up approximations using sampled volume and average selling price by major formula groups, followed by channel checks across hospital and home care pathways.
The model uses practical inputs that can be tracked: enteral nutrition usage by setting (hospital, long term care, and home enteral nutrition), the share of tube feeding within broader clinical nutrition, changes in product mix toward disease-specific and high-protein options, inflation and tender-driven price movements, and regional reimbursement or guideline shifts that affect adoption. Forecasts are built using scenario analysis. The base case is guided by expert views on home care expansion, aging population exposure, and the pace of product upgrades. When a bottom-up input is missing for smaller countries, gaps are handled with proxy ratios from comparable markets and then adjusted through expert validation before the final totals are locked.
Data Validation & Update Cycle
Outputs are validated through multiple checks so the final numbers do not depend on one dataset or one assumption. We compare market totals and growth paths against independent signals, including supplier revenue direction, pricing trend lines, and expected shifts between hospital and home care, then investigate any outliers before sign-off.
A second analyst reviews key inputs, and re-contacts are triggered when interview feedback conflicts with desk indicators, or when a material policy, recall, or reimbursement change is observed. The report is refreshed annually, and interim updates are added when significant events can move utilization or pricing. Before delivery, a fresh review pass is completed so clients receive the latest updated view.
Mordor Intelligence's Enteral Feeding Formulas Market Size Compared With Other Published Estimates
Published market sizes for enteral feeding formulas often do not match, even when the topic name looks the same. The differences usually come from what each study counts as enteral formulas, which year is treated as the anchor, and how pricing and care setting shifts are translated into USD.
Hospital and home enteral nutrition utilization checks, along with product mix signals from supplier disclosures, are used to keep Mordor Intelligence's estimate tied to formula-only sales rather than adjacent devices or broader medical foods. Gaps also show up when a study uses a different base year, applies a faster price escalation, or blends in related nutrition categories that are not always purchased through the same channels.
Benchmark comparison
| Source | Market Size | Gaps in Research Methodology |
|---|---|---|
| Mordor Intelligence | USD 9.69 B (2026) | |
| Global Consultancy A | USD 8.07 B (2025) | Uses a different anchor year and forecast window, and may apply broader category assumptions around enteral nutrition that can understate later-year mix shift into higher-value disease-specific formulas. |
| Industry Publisher B | USD 8.31 B (2025) | Starts from a 2025 base and extends a longer horizon, and the higher forward path can reflect more aggressive price progression and faster uptake assumptions across regions without the same care-setting level validation. |
Across the three figures, most of the spread is explained by anchor year choice and how pricing and mix are carried forward, not by disagreement on overall demand direction. By keeping the scope limited to formulas and by cross-checking with care-setting adoption and supplier mix cues, we can present a number that is easier to trace and repeat when assumptions are updated.


Key Questions Answered in the Report
How large will the enteral feeding formulas market be by 2031?
It is forecast to reach USD 12.44 billion, reflecting a 5.12% CAGR from 2026 to 2031.
Which segment is growing fastest by end-user?
Home enteral nutrition is advancing at 8.54% annually as payers shift care to lower-cost settings and portable pumps ease administration.
Why are hypercaloric blends gaining popularity?
Clinicians use 1.2-1.5 kcal/ml formulas to meet energy targets in fluid-restricted or critically ill patients, driving a 7.88% CAGR through 2031.
Which companies lead the field?
Abbott, Fresenius Kabi, and Nestlé Health Science collectively account for the largest global share, supported by broad portfolios and clinical data.
What is driving growth in Asia-Pacific?
Rapid demographic aging in Japan and China, plus expanding healthcare coverage, underpins the region's 6.43% CAGR outlook.
Page last updated on:





