Engineering Plastic Recycling Market Size and Share
Market Overview
| Study Period | 2021 - 2031 |
|---|---|
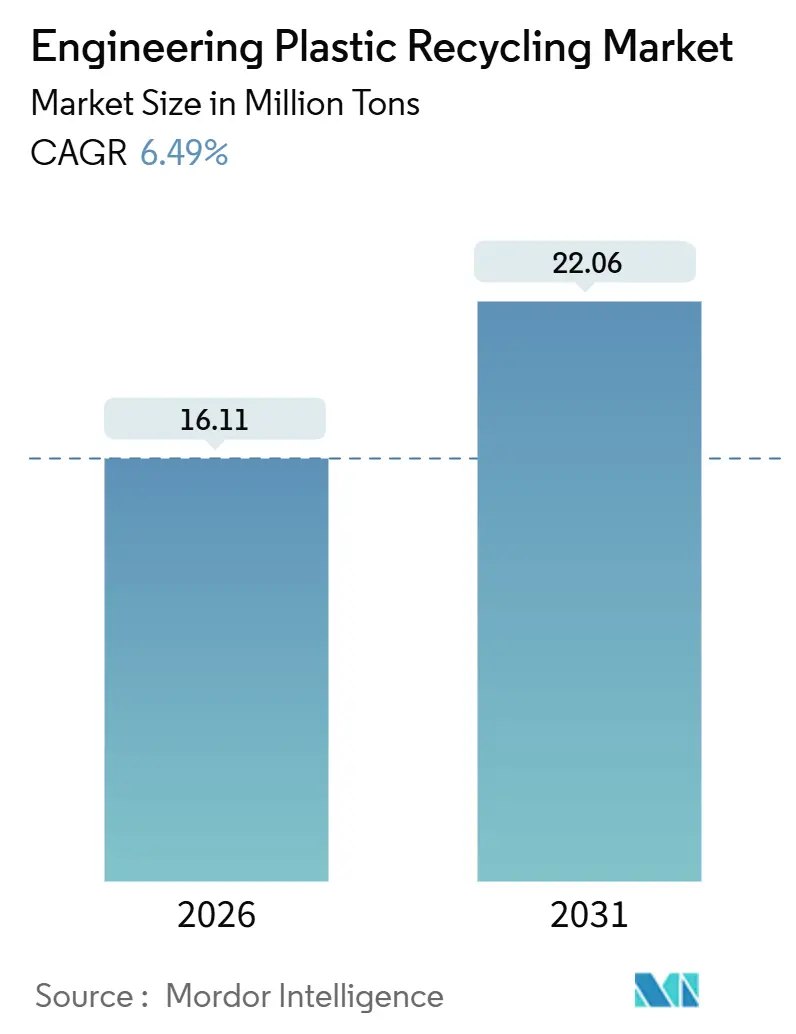
| Market Volume (2026) | 16.11 Million tons |
| Market Volume (2031) | 22.06 Million tons |
| Growth Rate (2026 - 2031) | 6.49% CAGR |
| Fastest Growing Market | Europe |
| Largest Market | Asia Pacific |
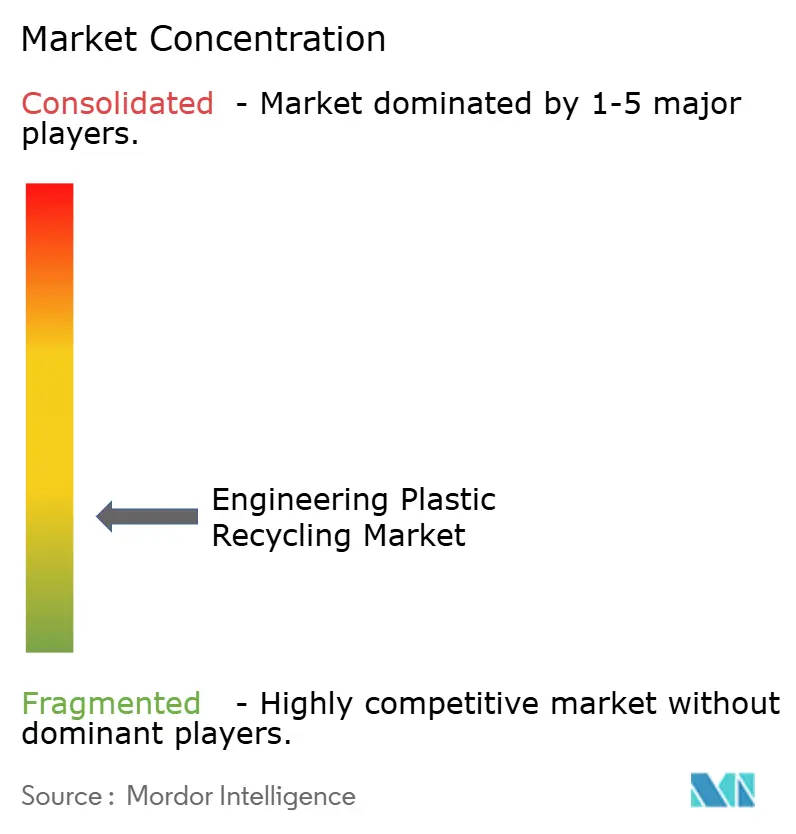
| Market Concentration | Low |
Major Players *Disclaimer: Major Players sorted in no particular order Image © Mordor Intelligence. Reuse requires attribution under CC BY 4.0. | |
Engineering Plastic Recycling Market Analysis by Mordor Intelligence
The Engineering Plastic Recycling Market size is estimated at 16.11 Million tons in 2026, and is expected to reach 22.06 Million tons by 2031, at a CAGR of 6.49% during the forecast period (2026-2031). Regulatory quotas in the European Union and California, coupled with brand-owner procurement pledges, are shifting recycled content from a voluntary initiative to a legal requirement, anchoring growth across packaging and industrial yarn streams. China’s post-National Sword build-out, Europe’s deposit-return schemes, and North American chemical-recycling investments are strengthening regional supply positions, while digital watermarking and AI-vision sortation are lifting recovery rates for mixed engineering plastics. Venture-backed depolymerization projects that cut capital cost per ton by 30% are narrowing the price gap with virgin resin, heightening competition and prompting consolidation among incumbents. Food-contact approval bottlenecks and bale-price volatility remain near-term hurdles, yet long-term demand pull from automotive, electronics, and green-building applications continues to expand the engineering plastic recycling market footprint.
Key Report Takeaways
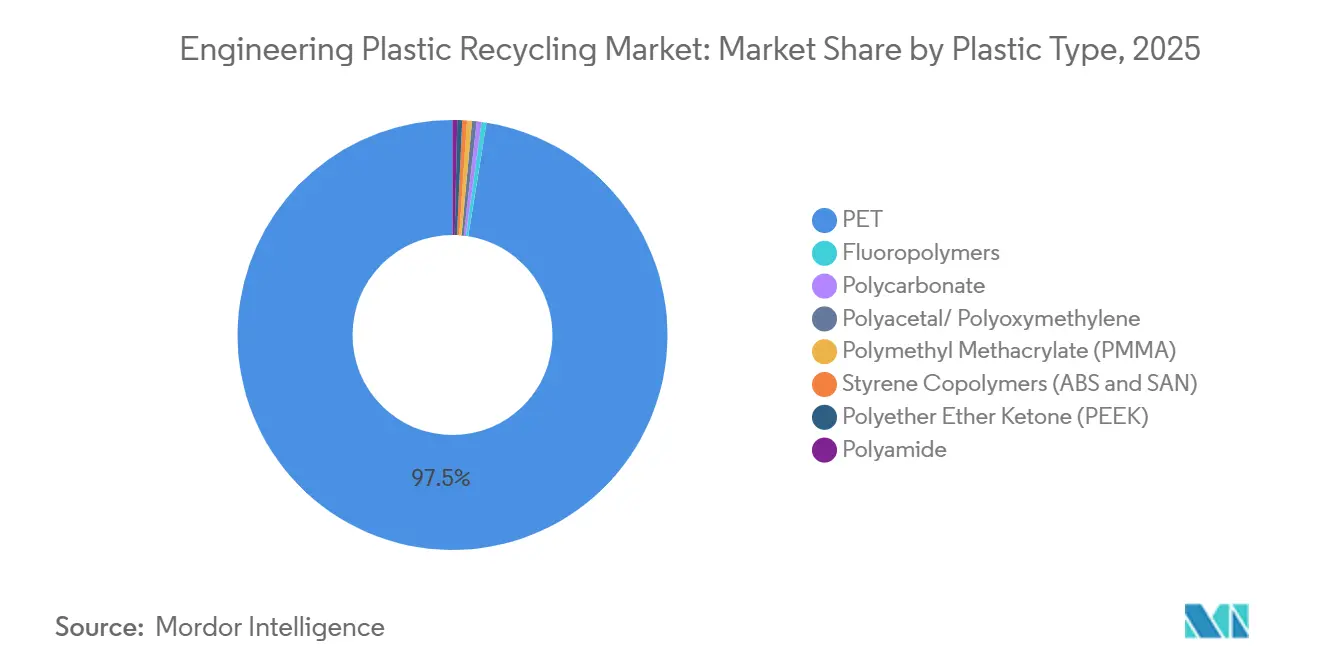
- By plastic type, PET captured 97.47% of engineering plastic recycling market share in 2025 and is forecast to expand at a 6.51% CAGR through 2031.
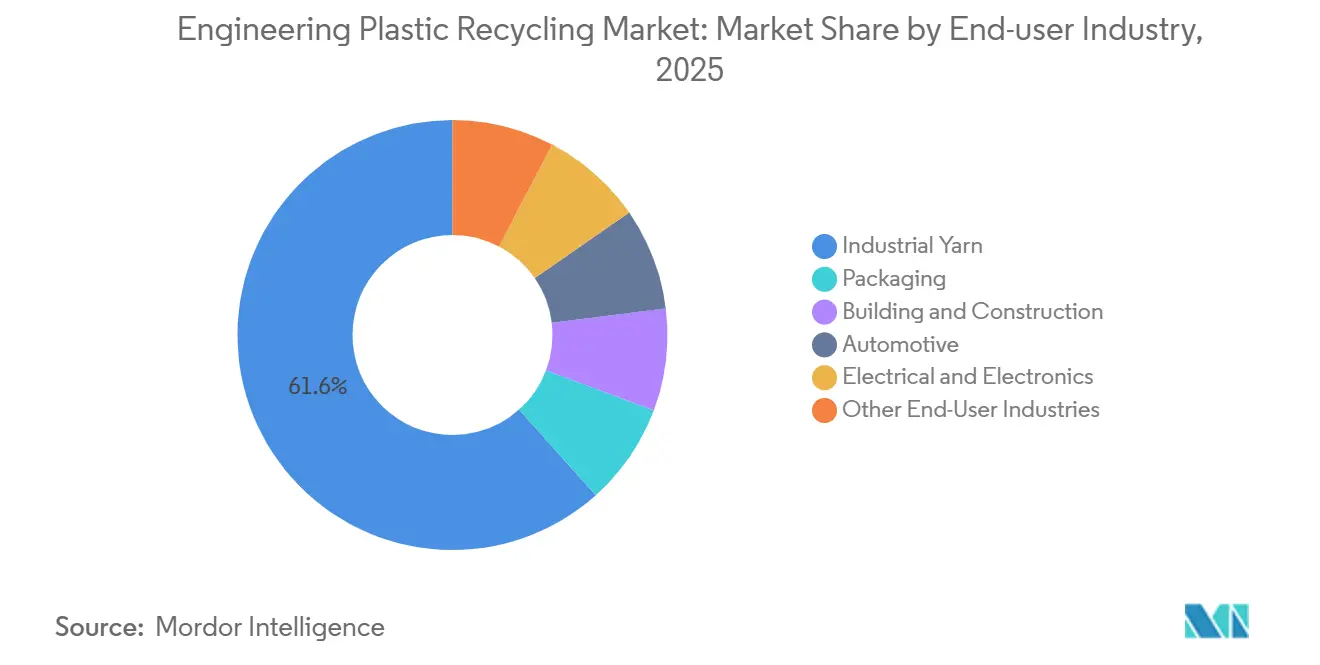
- By end-user industry, industrial yarn held 61.61% of the engineering plastic recycling market size in 2025; packaging is advancing at an 8.12% CAGR through 2031.
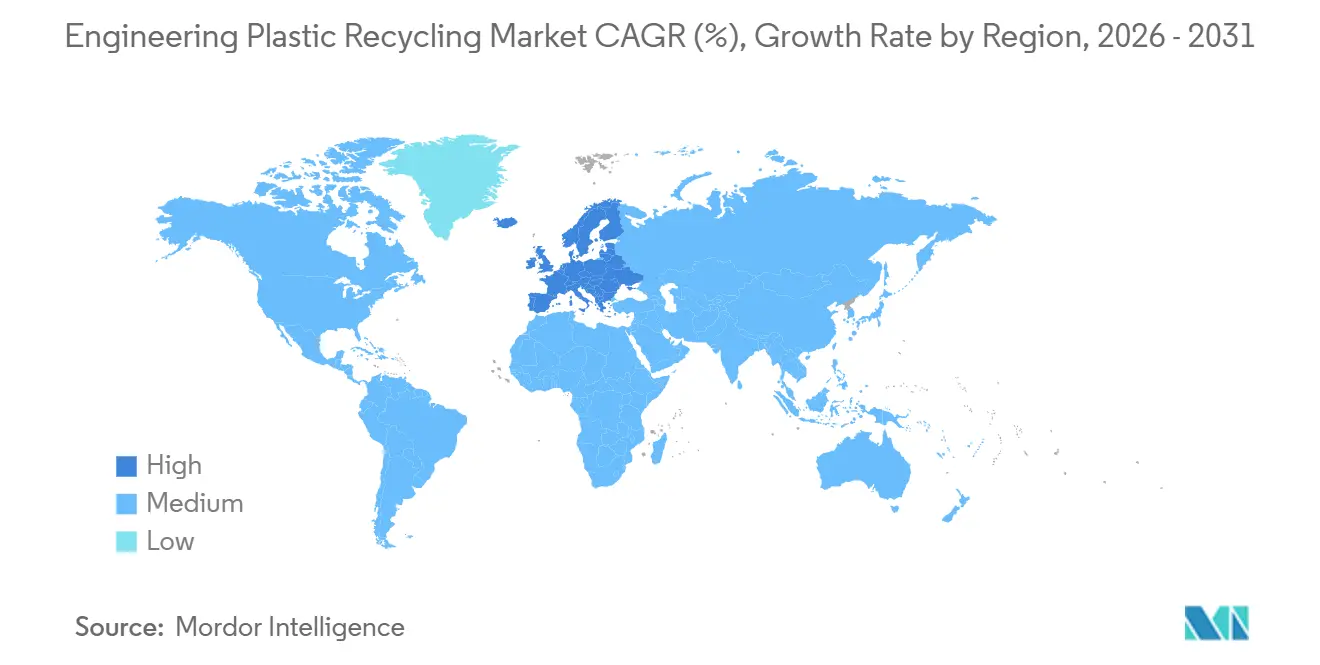
- By geography, Asia-Pacific commanded 56.39% share of the engineering plastic recycling market in 2025; Europe records the highest projected CAGR at 6.55% to 2031.
Note: Market size and forecast figures in this report are generated using Mordor Intelligence’s proprietary estimation framework, updated with the latest available data and insights as of January 2026.
Global Engineering Plastic Recycling Market Trends and Insights
Drivers Impact Analysis*
| Driver | (~) % Impact on CAGR Forecast | Geographic Relevance | Impact Timeline |
|---|---|---|---|
| Policy-Mandated Recycled-Content Quotas Tightening After 2026 | +1.8% | Europe, North America, APAC core markets | Medium term (2-4 years) |
| Brand-Owner Pledges to Shift 25–50% of Engineering-Plastic Packaging to Recycled Feedstock by 2030 | +1.5% | Global, with concentration in Europe and North America | Short term (≤ 2 years) |
| OEM Demand for Chemically Recycled PA and PC Grades in EV and Electronics Thermal-Management Parts | +1.2% | APAC (China, South Korea), Europe (Germany, France) | Medium term (2-4 years) |
| Emergence of Digital Water-Marking and AI-Vision Sorting Lines Boosting Yield of Mixed Streams | +0.9% | Europe, North America pilot sites, expanding to APAC | Long term (≥ 4 years) |
| Venture-Backed Solvent-Based Depolymerization Plants Achieving 30% Capex/Ton Cost Reduction | +1.1% | North America, Europe, selective APAC hubs | Medium term (2-4 years) |
| Source: Mordor Intelligence | |||
Policy-Mandated Recycled-Content Quotas Tightening After 2026
Binding targets in the EU’s Packaging and Packaging Waste Regulation compel 30% recycled content in beverage bottles by 2030, rising to 65% by 2040, while France’s AGEC law extends quotas to automotive and electronics parts[1]European Commission, “Packaging and Packaging Waste Regulation,” europa.eu. California’s SB 54 exacts fines of USD 50,000 per day for non-compliance, converting recycled-content sourcing into a cost-avoidance measure. These mandates compressed the recycled-resin premium from 15-25% in 2024 to 5-10% by late 2025 as supply scaled. Capital flowed toward both mechanical and chemical lines, accelerating the engineering plastic recycling market expansion. As thresholds tighten after 2026, demand visibility improves and financing risk declines, reinforcing growth momentum.
Brand-Owner Pledges to Shift 25–50% of Engineering-Plastic Packaging to Recycled Feedstock by 2030
Unilever, Procter & Gamble, and Nestlé have embedded recycled-content clauses in global procurement contracts, collectively requiring more than 600,000 tons of food-grade recycled PET annually from 2027. Long-term offtake agreements underpin mega-scale depolymerization plants such as Eastman’s Tennessee site, enabling project finance exceeding USD 150 million per facility. Brand pressure cascades down supply chains, incentivizing converters to re-qualify recycled grades across barrier film, caps, and closures. The ripple effect sustains double-digit capacity growth in the engineering plastic recycling market during the near term.
OEM Demand for Chemically Recycled PA and PC Grades in EV and Electronics Thermal-Management Parts
BMW, Tesla, and Apple now specify chemically recycled polyamide and polycarbonate for under-hood and thermal-interface applications, citing 20–30% life-cycle-carbon reductions alongside UL 94 flammability compliance. Premiums of 20–30% over mechanically recycled alternatives are accepted due to virgin-equivalent performance, fostering a two-tier price landscape. Rising EV production volumes and heat-management needs elevate demand for these grades, channeling higher-margin growth within the broader engineering plastic recycling market.
Emergence of Digital Watermarking and AI-Vision Sorting Lines Boosting Yield of Mixed Streams
HolyGrail 2.0 pilots achieved 95% accuracy in identifying multi-layer and black plastics that escape near-infrared systems, doubling throughput at European material recovery facilities. Tomra’s AI-enhanced optics lifted polyamide recovery from WEEE streams by 40% in early 2026, unlocking feedstock once relegated to incineration. Improved sortation economics support investment in hard-to-recycle engineering plastics, widening material scope and bolstering the overall engineering plastic recycling market.
Restraints Impact Analysis*
| Restraint | (~) % Impact on CAGR Forecast | Geographic Relevance | Impact Timeline |
|---|---|---|---|
| Limited Food-Contact Approvals for R-Engineering Plastics in Many Jurisdictions | -0.6% | North America (FDA), APAC (China, India, Japan), South America | Medium term (2-4 years) |
| Volatility in Bale Pricing Making ROI Unpredictable for Recyclers | -0.5% | Global, acute in North America and Europe | Short term (≤ 2 years) |
| High Brominated-Flame-Retardant Content in WEEE Plastics Raising Processing Cost | -0.4% | Europe, North America, APAC (e-waste hubs) | Long term (≥ 4 years) |
| Source: Mordor Intelligence | |||
Limited Food-Contact Approvals for Recycled Engineering Plastics in Many Jurisdictions
The FDA’s letter-of-no-objection process costs USD 500,000 and can last up to 24 months per grade, constraining U.S. supply of food-grade recycled polycarbonate and polyamide[2]U.S. Food and Drug Administration, “Letter of No Objection Guidance,” fda.gov . China lacks comprehensive guidelines, pushing brand owners toward virgin resin for dairy and beverage packaging. Segregated food-contact streams lower plant utilization and raise sortation costs by around 15%. Until regulatory convergence improves, this hurdle tempers near-term uptake in the engineering plastic recycling market.
Volatility in Bale Pricing Making ROI Unpredictable for Recyclers
PET and polyamide bale prices fluctuated between USD 250 and USD 420 per ton during 2024–2025 on crude-oil swings and textile-mill demand spikes. Mid-sized European recyclers idled capacity when bale costs spiked 35% in Q3 2025 while flake prices stagnated, underscoring thin 8–12% EBITDA margins. Bale volatility undermines lender confidence in non-recourse project finance, slowing plant expansions and moderating growth of the engineering plastic recycling market.
*Our forecasts treat driver/restraint impacts as directional, not additive. The impact forecasts reflect baseline growth, mix effects, and variable interactions.
Segment Analysis
By Plastic Type: PET Dominance Continues While Specialty Polymers Emerge
PET held 97.47% of engineering plastic recycling market share in 2025, and the segment is on track for 6.51% CAGR through 2031 as beverage and textile applications absorb rising recycled volumes. The engineering plastic recycling market size for PET is growing, supported by Indorama Ventures’ 400,000-ton capacity additions and Europe’s deposit-return schemes.
Polyamide demand growth is propelled by automotive and electronics OEM specifications for mechanically and chemically recycled grades with flame-retardant performance. ChemCycling-sourced PA commands a 40% price premium, offering recyclers margin resilience. Polycarbonate recycling advances through robotic disassembly trials that attain 85% purity, reducing processing cost curves. PMMA, ABS, SAN, and niche polymers such as PEEK remain at pilot-scale but present white-space opportunities as solvent-based depolymerization reaches commercial maturity.


By End-user Industry: Packaging Growth Outpaces Industrial Yarn Lead
Industrial yarn accounted for 61.61% of engineering plastic recycling market size in 2025 as polyester fiber can integrate 100% recycled flake without tensile strength loss. Reliance Industries’ 300,000-ton recycled-PSF line exemplifies scale advantages and captive demand from apparel exporters.
Packaging is advancing at an 8.12% CAGR, eroding industrial yarn’s dominance as regulatory fees on virgin resin accelerate conversions to recycled feedstock. The engineering plastic recycling market size for the packaging industry is driven by Amcor’s commitment to integrate recycled content across 30% of its portfolio and by chemical-recycling investments that unlock food-contact grades. Automotive and electronics segments are smaller by volume yet offer higher value per ton as OEMs adopt recycled PA and PC for thermal-management and structural components, signaling long-term diversification of demand.
Geography Analysis
Asia-Pacific retained 56.39% share of the engineering plastic recycling market in 2025, buttressed by China’s 12 million-ton PET-recycling build-out after the National Sword policy and by India’s recent 500,000-ton capacity surge. Integrated fiber-spinning sites in Zhejiang and Gujarat convert flake directly into yarn, maximizing supply-chain efficiency. Japan’s Jeplan, funded with USD 150 million in late 2024, scales PET depolymerization, underscoring regional technology diversification.
Europe records the fastest growth at 6.55% CAGR as the EUR 0.80/kg plastic-tax differential incentivizes brand owners to source recycled grades. Deposit-return schemes push PET collection above 90% in Germany and the Netherlands, supplying clean feedstock to Eastman’s forthcoming 160,000-ton Normandy molecular-recycling complex. Government grants and low-interest green bonds facilitate plant financing, strengthening regional competitive positions.
North America trails in share yet accelerates capital deployment. Eight chemical-recycling plants under construction in Texas, Ohio, and Tennessee focus on polyamide and polycarbonate grades for EV and electronics OEMs. Federal tax credits for clean-manufacturing equipment and state-level recycled-content mandates narrow economics in favor of recycled resin. South America and the Middle East and Africa account for smaller volumes but register new projects such as Braskem-Valoren’s São Paulo plant and ADNOC-Loop’s Abu Dhabi pilot, reflecting global proliferation of the engineering plastic recycling market.

Competitive Landscape
The top five players control 34% of global capacity, indicating low concentration in the engineering plastic recycling market. Petrochemical majors pursue vertical integration: Eastman, BASF, and Solvay now operate collection, sortation, and depolymerization assets to secure feedstock and capture margin. Long-term supply contracts between brand owners and recyclers, such as Unilever-Indorama and Nestlé-Veolia, lock in volumes and stabilize revenue. Technology-licensing models from Loop Industries and Carbios monetize intellectual property, expanding geographic reach without heavy capital outlay.
AI-vision sortation providers like AMP Robotics and Tomra enable smaller recyclers to recover engineering plastics from mixed municipal waste at yields that previously required source-separated streams. ISO 14021 certification emerges as a competitive differentiator as retailers police greenwashing, prompting Far Eastern Group and Clean Tech UK to invest in third-party verification. Disruptive innovation targets high-performance polymers: Solvay’s supercritical-fluid extraction patent for PEEK recycling exemplifies frontier research with potential to unlock aerospace and medical applications. Cost-parity advances in solvent-based depolymerization intensify competition and foreshadow further consolidation.
Engineering Plastic Recycling Industry Leaders
Alpek S.A.B. de C.V.
Indorama Corporation
TEIJIN LIMITED
Far Eastern Group
Reliance Industries Limited
- *Disclaimer: Major Players sorted in no particular order

Recent Industry Developments
- January 2026: Avro India Limited established a 500 MTPM plastic recycling facility in Ghaziabad, India. This facility included the country's largest flexible plastic recycling plant, with a processing capacity of 500 metric tonnes per month (MTPM).
- October 2025: BASF announced two new recycling processes for polyamides derived from end-of-life vehicles. These processes were centered on depolymerization, which involved breaking down the long polyamide chains at their natural cleavage points into their original monomer building blocks.


Global Engineering Plastic Recycling Market Report Scope
Engineering plastic recycling is processing waste plastic material into useful products. Engineering plastic is mainly recovered from computers, electronics, and automobiles and can be recycled using chemical or mechanical processes.
The engineering plastic recycling market report is segmented by plastic type, end-user industry, and geography. By plastic type, the market is segmented into PET, fluoropolymers, polycarbonate, polyacetal/polyoxymethylene, polymethyl methacrylate (PMMA), styrene copolymers (ABS and SAN), polyether ether ketone (PEEK), and polyamide. By end-user industry, the market is segmented into industrial yarn, packaging, building and construction, automotive, electrical and electronics, and other end-user industries. The report also covers the market size and forecasts for the engineering plastics recycling in 16 countries across major regions. For each segment, the market sizing and forecasts have been done on the basis of volume (tons).
| PET |
| Fluoropolymers |
| Polycarbonate |
| Polyacetal/ Polyoxymethylene |
| Polymethyl Methacrylate (PMMA) |
| Styrene Copolymers (ABS and SAN) |
| Polyether Ether Ketone (PEEK) |
| Polyamide |
| Industrial Yarn |
| Packaging |
| Building and Construction |
| Automotive |
| Electrical and Electronics |
| Other End-User Industries |
| Asia-Pacific | China |
| India | |
| Japan | |
| South Korea | |
| ASEAN Countries | |
| Rest of Asia-Pacific | |
| North America | United States |
| Canada | |
| Mexico | |
| Europe | Germany |
| United Kingdom | |
| France | |
| Italy | |
| Spain | |
| NORDIC Countries | |
| Rest of Europe | |
| South America | Brazil |
| Argentina | |
| Rest of South America | |
| Middle-East and Africa | Saudi Arabia |
| South Africa | |
| Rest of Middle-East and Africa |
| By Plastic Type | PET | |
| Fluoropolymers | ||
| Polycarbonate | ||
| Polyacetal/ Polyoxymethylene | ||
| Polymethyl Methacrylate (PMMA) | ||
| Styrene Copolymers (ABS and SAN) | ||
| Polyether Ether Ketone (PEEK) | ||
| Polyamide | ||
| By End-user Industry | Industrial Yarn | |
| Packaging | ||
| Building and Construction | ||
| Automotive | ||
| Electrical and Electronics | ||
| Other End-User Industries | ||
| By Geography | Asia-Pacific | China |
| India | ||
| Japan | ||
| South Korea | ||
| ASEAN Countries | ||
| Rest of Asia-Pacific | ||
| North America | United States | |
| Canada | ||
| Mexico | ||
| Europe | Germany | |
| United Kingdom | ||
| France | ||
| Italy | ||
| Spain | ||
| NORDIC Countries | ||
| Rest of Europe | ||
| South America | Brazil | |
| Argentina | ||
| Rest of South America | ||
| Middle-East and Africa | Saudi Arabia | |
| South Africa | ||
| Rest of Middle-East and Africa | ||


Key Questions Answered in the Report
How large is the engineering plastic recycling market in 2026 and what growth is expected?
The engineering plastic recycling market size is 16.11 million tons in 2026 and is forecast to reach 22.06 million tons by 2031 at a 6.49% CAGR.
Which polymer dominates recycled engineering plastics?
PET controls 97.47% of volume in 2025 owing to its established collection networks and high mechanical recyclability.
Which end-user industry is growing fastest for recycled engineering plastics?
Packaging is advancing at an 8.12% CAGR through 2031 as brand-owner and regulatory mandates escalate recycled-content requirements.
Why is Europe growing faster than Asia-Pacific despite lower volume?
Europe’s plastic tax and deposit-return schemes create strong economic incentives, while escalating quotas in the EU’s PPWR further lift demand for recycled resin.
Page last updated on:


