Engineered Wood Market Size and Share
Market Overview
| Study Period | 2021 - 2031 |
|---|---|
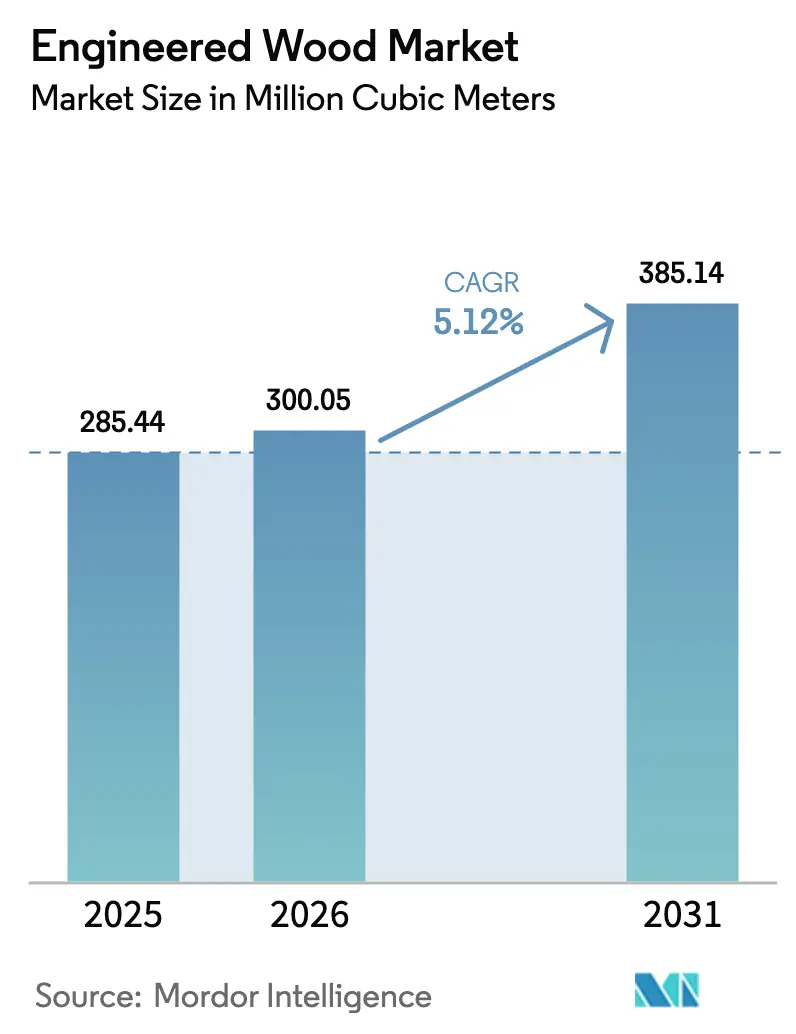
| Market Volume (2026) | 300.05 Million cubic meters |
| Market Volume (2031) | 385.14 Million cubic meters |
| Growth Rate (2026 - 2031) | 5.12% CAGR |
| Fastest Growing Market | North America |
| Largest Market | Asia Pacific |
| Market Concentration | Medium |
Major Players *Disclaimer: Major Players sorted in no particular order Image © Mordor Intelligence. Reuse requires attribution under CC BY 4.0. | |
Engineered Wood Market Analysis by Mordor Intelligence
The Engineered Wood Market size was valued at 285.44 Million cubic meters in 2025 and is estimated to grow from 300.05 Million cubic meters in 2026 to reach 385.14 Million cubic meters by 2031, at a CAGR of 5.12% during the forecast period (2026-2031). Growing preference for low-carbon structural systems, the cost advantage of factory-built components, and expanding policy incentives that monetize biogenic carbon are reinforcing demand. Developers in North America and Europe continue to pivot from steel and concrete toward mass-timber framing, while Asia-Pacific governments channel plywood and oriented strand board (OSB) into large-scale housing programs. Regulatory milestones, such as the 2021 International Building Code provisions that allow 18-story mass-timber buildings, have unlocked mainstream financing and reduced insurance hurdles. Concurrently, adhesive reformulation to comply with formaldehyde caps and the steady integration of mill residues into panel cores are helping large producers widen cost moats over non-compliant mills.
Key Report Takeaways
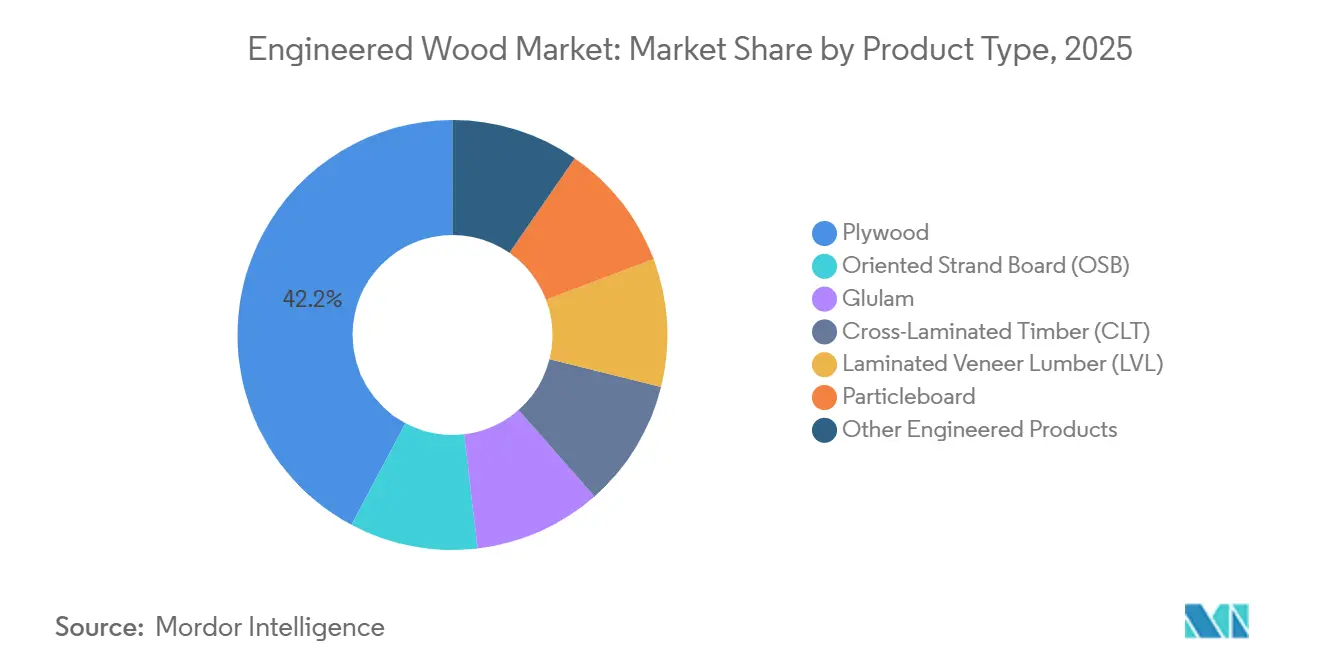
- By product type, plywood held 42.23% of the engineered wood market share in 2025, whereas cross-laminated timber (CLT) is expanding fastest at a 12.45% CAGR through 2031.
- By wood source, softwood commanded 71.56% of the engineered wood market share in 2025, while hardwood-based panels are projected to grow at a 9.66% CAGR to 2031.
- By application, residential construction accounted for 65.22% of the engineered wood market size in 2025 and is forecast to expand at a 5.34% CAGR through 2031.
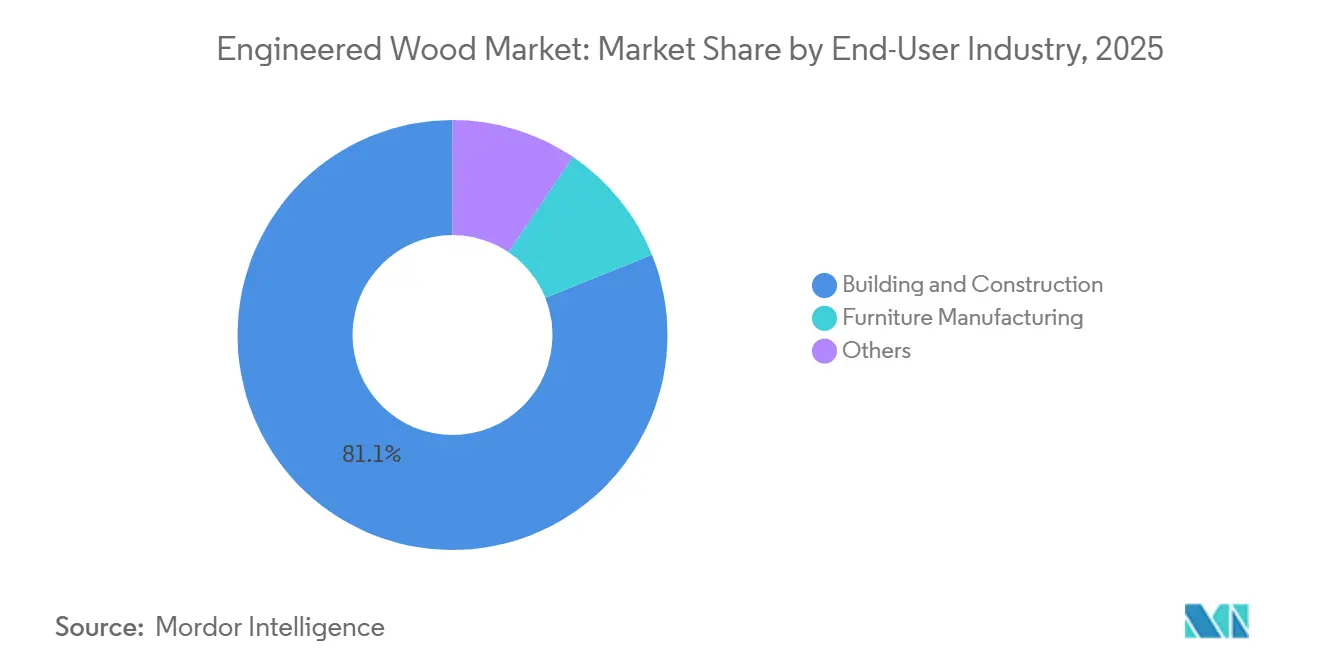
- By end-user industry, building and construction absorbed 81.08% of the 2025 volume, whereas furniture and interior fit-out is advancing at an 8.93% CAGR on the back of cabinet-grade particleboard substitution.
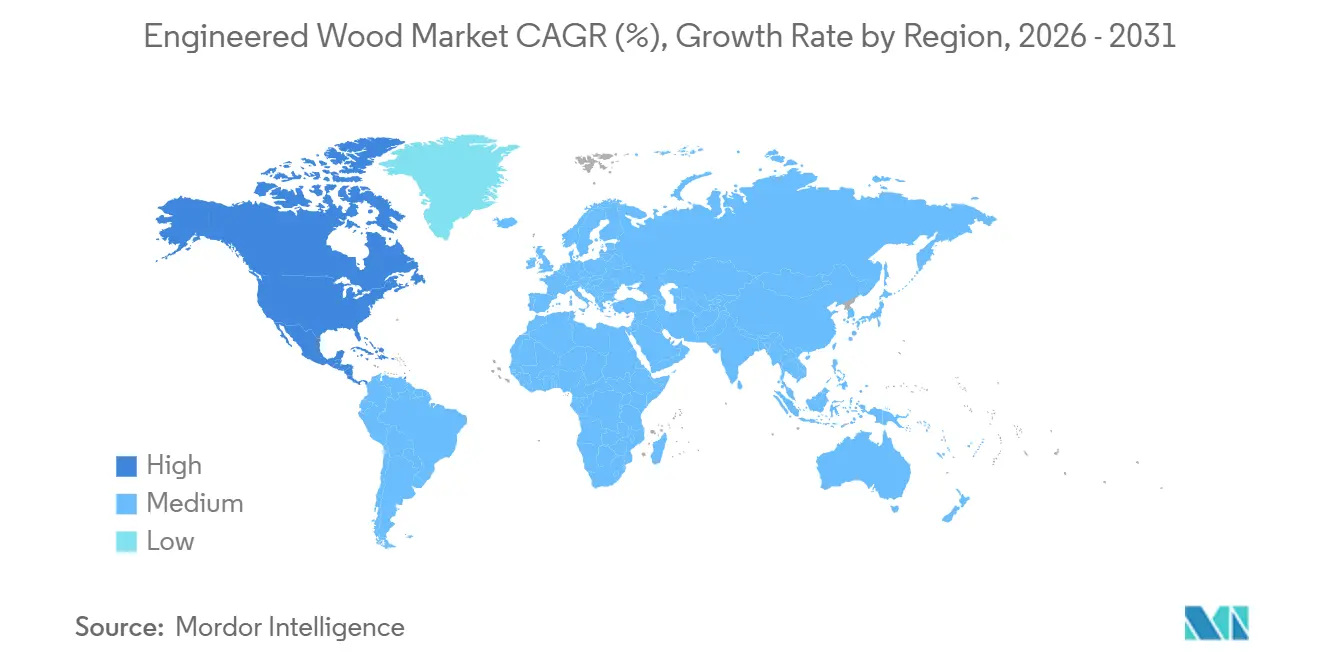
- By geography, Asia-Pacific led with 48.26% volume in 2025, while North America is the fastest-growing region at 6.26% CAGR to 2031, reflecting policy-driven adoption of tall wood.
Note: Market size and forecast figures in this report are generated using Mordor Intelligence’s proprietary estimation framework, updated with the latest available data and insights as of January 2026.
Global Engineered Wood Market Trends and Insights
Driver Impact Analysis*
| Drivers | (~) % Impact on CAGR Forecast | Geographic Relevance | Impact Timeline |
|---|---|---|---|
| Surging adoption of CLT and mass-timber | +1.4% | North America, Europe, Australia | Medium term (2-4 years) |
| Prefab affordable-housing push in Asia | +1.2% | China, India, Southeast Asia | Short term (≤ 2 years) |
| Green-building codes and carbon incentives | +1.0% | Global (EU, North America leading) | Long term (≥ 4 years) |
| Cost efficiencies versus solid wood and steel | +0.9% | Global | Short term (≤ 2 years) |
| Up-cycling residues into value-added panels | +0.5% | North America, Nordic Europe, Asia-Pacific | Medium term (2-4 years) |
| Source: Mordor Intelligence | |||


Surging Adoption of CLT and Mass-Timber in Mid-Rise Buildings
In 2025, urban jurisdictions adopting the 2021 International Building Code’s Type IV provisions enabled projects of up to 18 stories to access mainstream debt and equity financing. Cost models indicate savings compared to post-tensioned concrete, especially when factoring in shorter schedules and lighter foundations. By late 2025, Germany’s Timber Construction Offensive had financed public schools and hospitals, demonstrating faster erection time compared to concrete[1]German Federal Ministry of Food and Agriculture, “Timber Construction Offensive,” bmel.de. Canada’s 2025 National Building Code increased the residential mass timber height limit to 12 stories, spurring projects in Vancouver and Toronto. Developers are increasingly recognizing the financial advantages of tall wood, noting its potential to reduce carrying costs and create additional leasable floors within existing zoning limits.
Prefab Affordable-Housing Push in Asia Boosting LVL and Glulam
By 2025, China's 14th Five-Year Plan mandates that prefabricated buildings constitute a significant portion of new urban developments, directing LVL joists and glulam beams into factory-assembled modules. India's Pradhan Mantri Awas Yojana is set to bolster plywood and particleboard demand in 2025, achieving a reduction in on-site labor compared to traditional brick masonry. In 2025, Vietnam awarded contracts for social housing units, stipulating the use of Malaysian rubberwood LVL to adhere to a cost ceiling. Module manufacturers that have integrated panel production are now securing a portion of the regional volume for plywood and LVL, shielding their supply chains from raw material fluctuations and reaping additional margins.
Green-Building Codes and Carbon-Credit Incentives
Effective 2025, the European Union's Energy Performance of Buildings Directive mandates that all new buildings be zero-emission by 2030. The directive also subtly promotes the use of low-embodied-carbon materials, like engineered wood. In the U.S., Section 45Q now recognizes durable wood as sequestered carbon, granting a credit. This move enhances project economics. Meanwhile, Australia's National Construction Code 2025 has set whole-life-carbon budgets, guiding major projects towards timber-hybrid solutions. As a result, architects and engineers are now prioritizing wood, using steel and concrete only in specific scenarios dictated by fire safety or span requirements.
Cost Efficiencies Versus Solid Wood and Steel
LVL and glulam, by allowing precise load-matching, reduce material use compared to sawn lumber, addressing over-specification. Steel framing costs have risen, while softwood lumber prices have declined, amplifying the relative advantage of wood. CLT floor plates, being lighter than post-tensioned concrete, permit developers to add extra height within the same foundation envelope, offering significant value in bustling U.S. metropolitan areas. The adaptive reuse of heritage structures also stands to gain: lightweight CLT mezzanines can meet load limits that would be exceeded by concrete, creating growth opportunities for engineered wood in North American and European renovation markets.
Restraint Impact Analysis*
| Restraints | (~) % Impact on CAGR Forecast | Geographic Relevance | Impact Timeline |
|---|---|---|---|
| Tightening formaldehyde/VOC regulations | -0.7% | California, EU, Japan | Short term (≤ 2 years) |
| Timber-price and logistics volatility | -0.5% | Global | Short term (≤ 2 years) |
| High insurance premiums for tall mass-timber | -0.4% | North America, Australia | Medium term (2-4 years) |
| Source: Mordor Intelligence | |||
Tightening Formaldehyde/VOC Emission Regulations
California's CARB Phase 2 and the U.S. TSCA Title VI have set a formaldehyde cap at 0.09 ppm for plywood[2]U.S. Environmental Protection Agency, “TSCA Title VI Formaldehyde Rule,” epa.gov. This regulation is pushing manufacturers towards phenol-formaldehyde or bio-based resins, which increase raw material costs. The EU's Chemical Strategy for Sustainability aims to reclassify formaldehyde as a Category 1B carcinogen by 2027. This move could necessitate retrofit expenditures across the EU's panel sector. In April 2025, Japan tightened indoor formaldehyde limits to 0.08 ppm. This effectively sidelines conventional MDF unless manufacturers pivot to no-added-formaldehyde binders. Meanwhile, smaller mills, unable to invest in resin upgrades, are grappling with shrinking margins and mounting consolidation pressures.
Timber-Price and Logistics Volatility
Southern yellow pine stumpage prices fluctuated significantly between Q1 2024 and Q4 2025. This volatility compelled mills to stockpile logs for extended periods, which tied up their working capital and increased financing costs. Meanwhile, diversions in Red Sea shipping caused container rates between Southeast Asia and Europe to rise, adding to landed plywood costs. Additionally, lumber shipments faced delays due to congestion in Canadian railways, which further pressured margins. In response to these challenges, industry giants have adopted vertical integration and multi-year fiber contracts as essential hedging strategies.
*Our forecasts treat driver/restraint impacts as directional, not additive. The impact forecasts reflect baseline growth, mix effects, and variable interactions.
Segment Analysis
By Product Type: CLT Leads Innovation, Plywood Anchors Volume
Plywood accounted for 42.23% of the engineered wood market share in 2025, dominating residential sheathing and formwork in cost-sensitive regions. CLT is scaling at a 12.45% CAGR on the back of mid-rise residential and institutional demand in North America and Europe, supported by embodied-carbon credits under the Inflation Reduction Act. In 2025, builders in the U.S. South and Canadian Prairies turned to oriented strand board (OSB) for roof and wall substrates, increasing its capacity utilization. Meanwhile, in Canadian arenas, glulam beams, favored for long-span applications, demonstrated lower embodied carbon compared to steel trusses.
The engineered wood market is witnessing a split: premium offerings like CLT and LVL are focusing on urban infill projects, where speed and ESG metrics fetch higher prices. In contrast, commodity plywood and OSB are competing on cost in housing markets of emerging economies. Particleboard and MDF continue to dominate the furniture sector, with European manufacturers preemptively shifting to no-added-formaldehyde binders in light of 2027 regulations. I-joists and structural composite lumber are making headway in prefab roof and floor cassettes, reducing on-site labor. This trend highlights the engineered wood market's divide: high-margin engineered solutions versus volume-driven panels.


By Wood Source: Softwood Dominance Masks Hardwood’s Tropical Surge
Softwood inputs represented 71.56% of 2025 volume, supplied chiefly by North American spruce-pine-fir and Nordic spruce streams that feed OSB, CLT, and glulam lines. Hardwood panels are growing at a 9.66% CAGR through 2031 as Indonesian and Malaysian mills export tropical plywood to Middle Eastern infrastructure projects, and European buyers pay premiums for birch cabinetry substrates. In 2025, China ramped up its imports of tropical hardwood logs, marking an increase from the previous year, primarily to supply its coastal plywood mills. Certifications from FSC and PEFC now command a price premium, positioning traceability as a pivotal advantage in public procurement.
In Southeast Asia, tropical hardwood LVL, especially rubberwood, is beginning to overshadow solid teak in furniture exports targeting North America and Europe. Meanwhile, birch-faced plywood is enjoying a premium in the designer cabinetry market, creating a balance between the commodity softwood panels and the more lucrative hardwood products. With growing environmental scrutiny, the ability to verify legality and secure third-party certification is becoming crucial for accessing the lucrative European and North American markets.
By Application: Residential Scale Meets Non-Residential Margin
Residential projects absorbed 65.22% of 2025 engineered wood demand and are set to expand at a 5.34% CAGR, underpinned by Asia-Pacific housing initiatives and North American single-family starts. Non-residential applications-schools, hospitals, and commercial offices-are also expanding, buoyed by institutional ESG mandates that reward embodied-carbon savings. CLT floor plates, boasting significantly less embodied carbon than their concrete counterparts, align with the American Institute of Architects’ 2030 Commitment, a pledge embraced by numerous member firms.
Non-residential projects yield higher fabrication margins compared to volume housing, thanks to the premium commanded by design-assist services and custom panel dimensions. Timber Construction initiatives highlighted that CLT schools and hospitals enjoyed faster schedules and lower life-cycle costs. This attractive margin profile is nudging integrated producers like Stora Enso to pivot towards commercial endeavors, even as the residential sector continues to support mill throughput.
By End-User Industry: Construction Anchors, Furniture Accelerates
Building and construction accounted for 81.08% of the 2025 volume, spanning framing, decking, and formwork. Furniture and interior fit-out is advancing at an 8.93% CAGR as European and North American cabinet makers substitute particleboard and MDF for solid wood to hit cost and sustainability targets. In 2024, IKEA revealed that engineered wood constituted a significant portion of its total wood usage—an increase over two years. The company is on track to source all its wood from recycled or FSC-certified supplies by 2030.
Demand for furniture acts as a cyclical buffer: while new housing constructions may wane, renovation and commercial refresh cycles help sustain panel consumption. Chinese manufacturers, focusing on exports, sold furniture with rubberwood cores, accounting for a notable share of their inputs. The engineered wood market sees diversification, not just in furniture but also in niche areas like packaging, caravans, and recreational equipment. For instance, birch plywood floor panels in caravans reduce weight, enhancing fuel efficiency.
Geography Analysis
Asia-Pacific held 48.26% of the engineered wood market size in 2025, anchored by China’s prefabrication mandate and India’s affordable-housing rollout. Southeast Asian exporters sent plywood and rubberwood panels in 2025, primarily to the Middle East and North America. Stricter indoor-air standards in Japan led to a surge in panel prices as domestic mills swiftly adopted no-added-formaldehyde technology. Meanwhile, South Korea allocated funds to retrofit public buildings with low-carbon materials, directing orders towards CLT for school renovations.
North America is the fastest-growing engineered wood market at 6.26% CAGR through 2031. By mid-2025, many cities across the U.S. had embraced Type IV mass-timber provisions, creating a robust demand pipeline for CLT and glulam. In Canada, updated codes now permit taller buildings, and in Mexico, INFONAVIT backed wood-panel units in 2025, each priced affordably.
Europe's engineered wood leadership is firmly rooted in Nordic supply chains. Germany reported faster construction in public projects utilizing CLT, and the EU's 2025 Construction Products Regulation mandates environmental product declarations for structural timber. The UK's Future Homes Standard, set to be enforced in 2026, will mandate low-carbon housing, giving an edge to timber-frame systems. In South America, Brazil's consumption of plywood and OSB was significant in 2025, and in Saudi Arabia, the NEOM project earmarked wood for buildings as part of its Vision 2030 initiative.

Competitive Landscape
The engineered wood market is moderately fragmented. In North America and Europe, hybrid mass-timber systems that blend CLT floor plates with steel cores are enabling developers to surpass the 18-story height limit while still reaping the benefits of reduced embodied carbon. Specialty fabricators are securing architecturally intricate projects by offering bundled design-assist services and timely logistics, resulting in impressive gross margins. Meanwhile, new entrants in the bio-composite arena, who are combining wood fiber with hemp shiv, are strategically positioning themselves for projects where carbon weight is crucial. This move hints at a potential shift in segmentation, moving beyond traditional wood species.
Engineered Wood Industry Leaders
Weyerhaeuser Company
West Fraser Timber Co.
Louisiana-Pacific Corporation
Stora Enso
Binderholz GmbH
- *Disclaimer: Major Players sorted in no particular order

Recent Industry Developments
- December 2024: Kronoplus Limited (Kronospan) inaugurated a EUR 200 million (USD 228 million) OSB mill in Rivne, Ukraine. The facility adds 700,000 m³ of annual capacity and signals renewed investor confidence in Eastern European panel production despite geopolitical headwinds.
- November 2024: Weyerhaeuser committed USD 500 million to construct a new TimberStrand facility in Arkansas, slated for 2027 operation. The plant will double the company’s TimberStrand capacity, reflecting expectations of enduring demand for strand-based structural lumber.


Research Methodology Framework and Report Scope
Market Definitions and Key Coverage
Mordor Intelligence defines the engineered wood market as all composite timber products, such as plywood, oriented strand board, laminated veneer lumber, cross-laminated timber, glulam, medium-density fiberboard, and particleboard, manufactured by bonding wood strands, fibers, or veneers with adhesives to create dimensionally stable boards and beams used across building, furniture, flooring, and packaging industries.
Scope Exclusion: Solid sawn lumber, plastic-wood composites, and untreated construction timber lie outside our assessed universe.
Segmentation Overview
- By Product Type
- Plywood
- Oriented Strand Board (OSB)
- Glulam
- Cross-Laminated Timber (CLT)
- Laminated Veneer Lumber (LVL)
- Particleboard
- Other Engineered Products
- By Wood Source
- Softwood
- Hardwood
- By Application
- Residential
- Non-Residential
- By End-User Industry
- Building and Construction
- Furniture Manufacturing
- Others
- By Geography
- Asia-Pacific
- China
- India
- Japan
- South Korea
- Malaysia
- Thailand
- Indonesia
- Vietnam
- Rest of Asia-Pacific
- North America
- United States
- Canada
- Mexico
- Europe
- Germany
- United Kingdom
- France
- Italy
- Spain
- Turkey
- Russia
- NORDIC Countries
- Rest of Europe
- South America
- Brazil
- Argentina
- Colombia
- Rest of South America
- Middle-East and Africa
- Saudi Arabia
- United Arab Emirates
- Qatar
- Egypt
- Nigeria
- South Africa
- Rest of Middle-East and Africa
- Asia-Pacific
Detailed Research Methodology and Data Validation
Primary Research
We supplement desk work through structured interviews and e-surveys with panel manufacturers, adhesive suppliers, timber wholesalers, architects, and mass-timber contractors across Asia-Pacific, North America, Europe, and emerging African hubs. These discussions validate utilization rates, benchmark average selling prices, and stress-test demand drivers identified in secondary research.
Desk Research
Our analysts begin with global production, trade, and price datasets from tier-one public sources such as FAOSTAT, UNECE Timber Committee reports, Eurostat COMEXT, the U.S. Census Bureau Building Permits Survey, and ITTO trade statistics. These establish baseline supply flows and consumption proxies. Company filings, investor presentations, patent abstracts, and reputable press are mined for capacity shifts, mill utilization, and technology adoption. Where needed, we access D&B Hoovers for private-company revenue splits and cost structures. The desk source list is illustrative, not exhaustive; many additional materials underpin every datapoint we quote.
Market-Sizing & Forecasting
A top-down model converts country-level production plus net imports into apparent consumption pools, which are then reconciled against housing starts, commercial floor-space completions, and furniture output. Results are cross-checked with selective bottom-up estimates, rolling up reported shipments from sampled producers and applying average ex-mill prices to fine-tune totals. Key variables include residential building permits, global softwood log price index, gross fixed capital formation, adhesive cost trends, and mass-timber code adoptions. Multivariate regression coupled with scenario analysis projects each driver forward, while expert consensus refines elasticity assumptions and gap fills where data are thin.
Data Validation & Update Cycle
Outputs pass a two-step peer review, variance thresholds trigger re-runs, and anomalies are re-checked with sources. Reports refresh annually, with interim updates when material events, such as policy shifts, large mill closures, or macro shocks, emerge. Before publication, an analyst performs a fresh pass so clients receive the latest calibrated view.
Why Mordor's Engineered Wood Baseline Earns Decision-Maker Trust
Published estimates differ because firms mix value and volume metrics, bundle disparate wood panels, and apply uneven refresh rates. Our disciplined scope, metric consistency, and yearly recalibration keep our baseline dependable for planners seeking clarity.
Benchmark comparison
| Market Size | Anonymized source | Primary gap driver |
|---|---|---|
| 285.19 million m³ (2024) | Mordor Intelligence | - |
| USD 301 billion (2024) | Global Consultancy A | Uses value metric, wider inclusion of solid lumber and wood-plastic composites |
| USD 268.7 billion (2024) | Industry Association B | Relies on producer surveys without reconciling trade flows or informal production |
The comparison shows how metric choice, scope breadth, and data triangulation create sizable spreads. By grounding estimates in harmonized production statistics, validated price bands, and a transparent refresh cadence, Mordor Intelligence delivers a balanced, traceable baseline clients can rely on.


Key Questions Answered in the Report
How large will the engineered wood market be in 2031?
The engineered wood market size is forecast to reach 385.14 million cubic meters by 2031, expanding at a 5.12% CAGR from 300.05 million cubic meters in 2026.
Which engineered wood product is growing fastest?
Cross-laminated timber leads with a 12.45% CAGR through 2031 as mass-timber codes expand.
Why is North America the fastest-growing region?
State adoption of the 2021 International Building Code and federal carbon incentives drive a 6.26% regional CAGR.
How are mills mitigating raw-material price swings?
Large producers secure multi-year fiber contracts, integrate timberland, and invest in digital yield optimization to hedge volatility.
Page last updated on:


