Emollient Esters Market Size and Share
Market Overview
| Study Period | 2020 - 2031 |
|---|---|
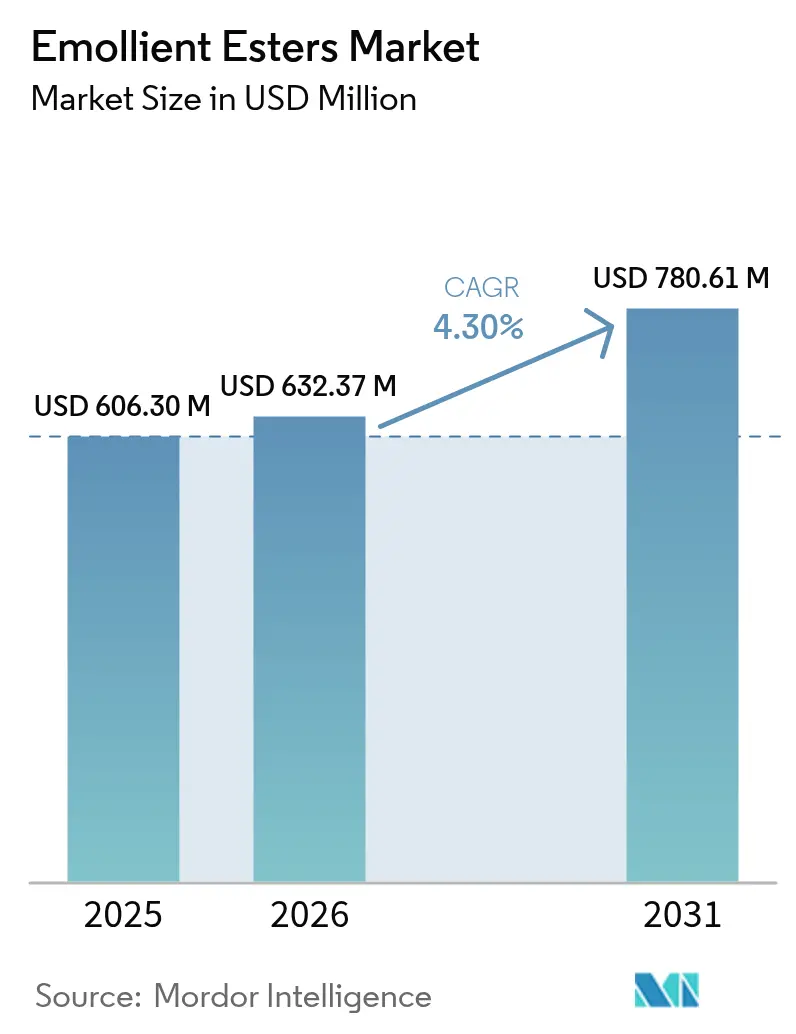
| Market Size (2026) | USD 632.37 Million |
| Market Size (2031) | USD 780.61 Million |
| Growth Rate (2026 - 2031) | 4.30% CAGR |
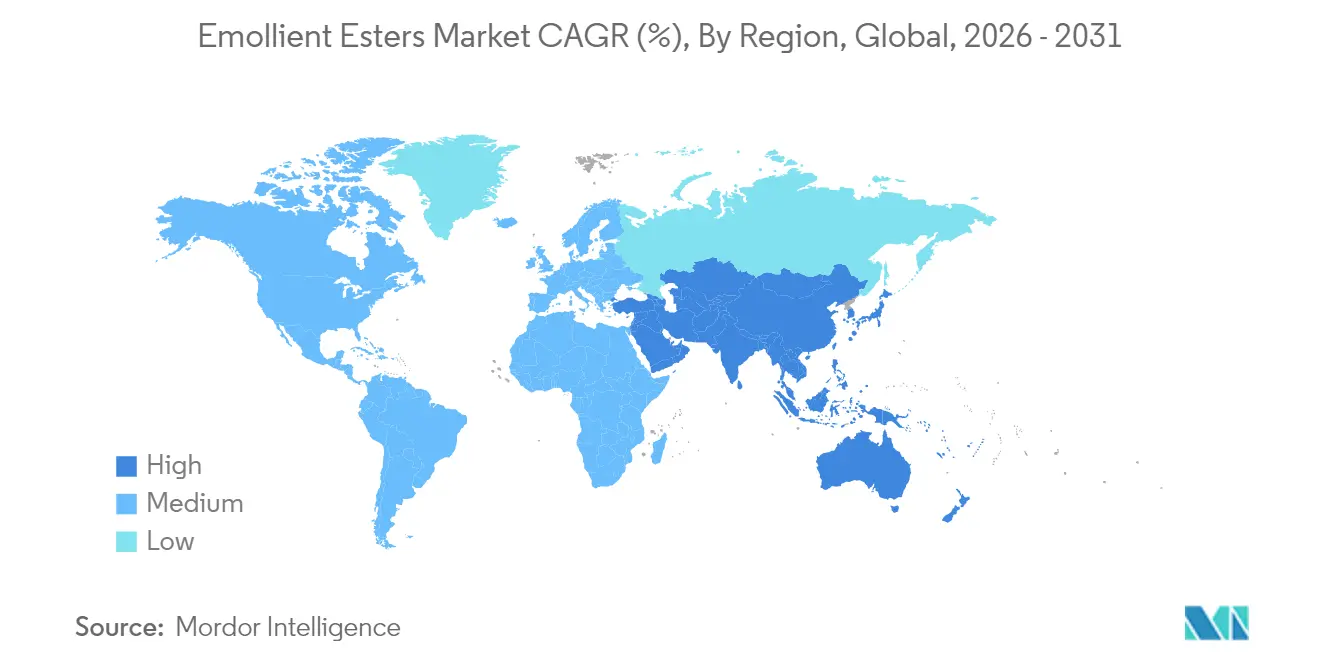
| Fastest Growing Market | Asia Pacific |
| Largest Market | Asia Pacific |
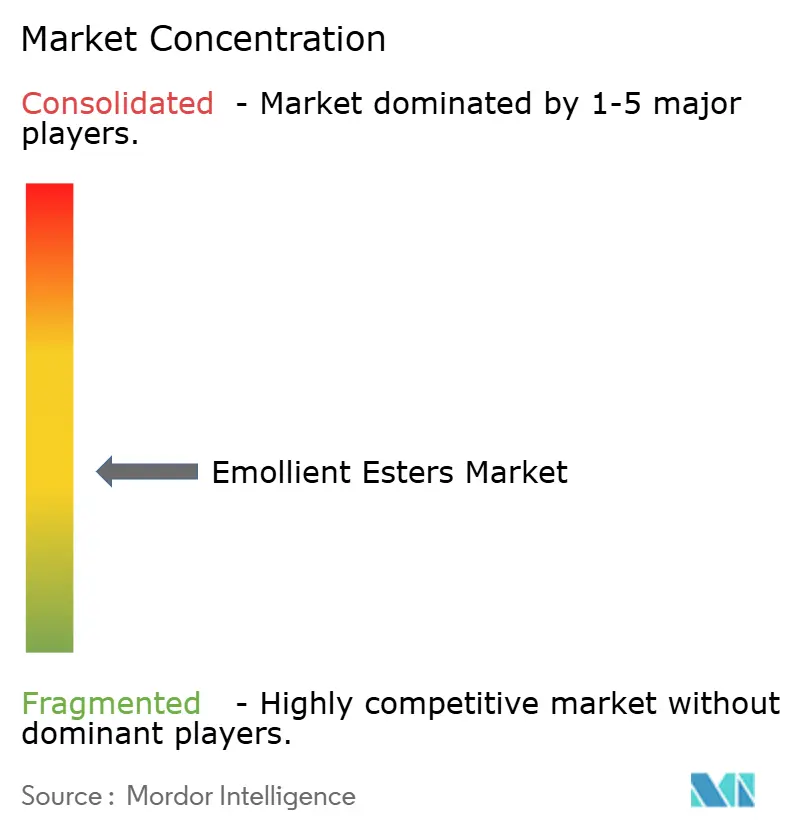
| Market Concentration | Medium |
Major Players *Disclaimer: Major Players sorted in no particular order Image © Mordor Intelligence. Reuse requires attribution under CC BY 4.0. | |
Emollient Esters Market Analysis by Mordor Intelligence
The emollient esters market size was valued at USD 606.30 million in 2025 and estimated to grow from USD 632.37 million in 2026 to reach USD 780.61 million by 2031, at a CAGR of 4.30% during the forecast period (2026-2031). Growth stems from rising demand for multifunctional, sustainably produced esters, wider adoption of enzymatic synthesis, and premiumization trends across personal care categories. Asia-Pacific’s large production base and fast-growing beauty industry accelerate regional consumption, while REACH-driven European reformulations raise demand for high-purity, bio-based grades. Manufacturers gain pricing power through differentiated carbon-reduction technologies, although volatile vegetable-oil feedstock prices continue to pressure margins. Regulatory calls for microplastic-free formulations further boost natural and up-cycled esters, pushing the emollient esters market toward value-oriented specialty solutions rather than high-volume commoditized grades.
Key Report Takeaways
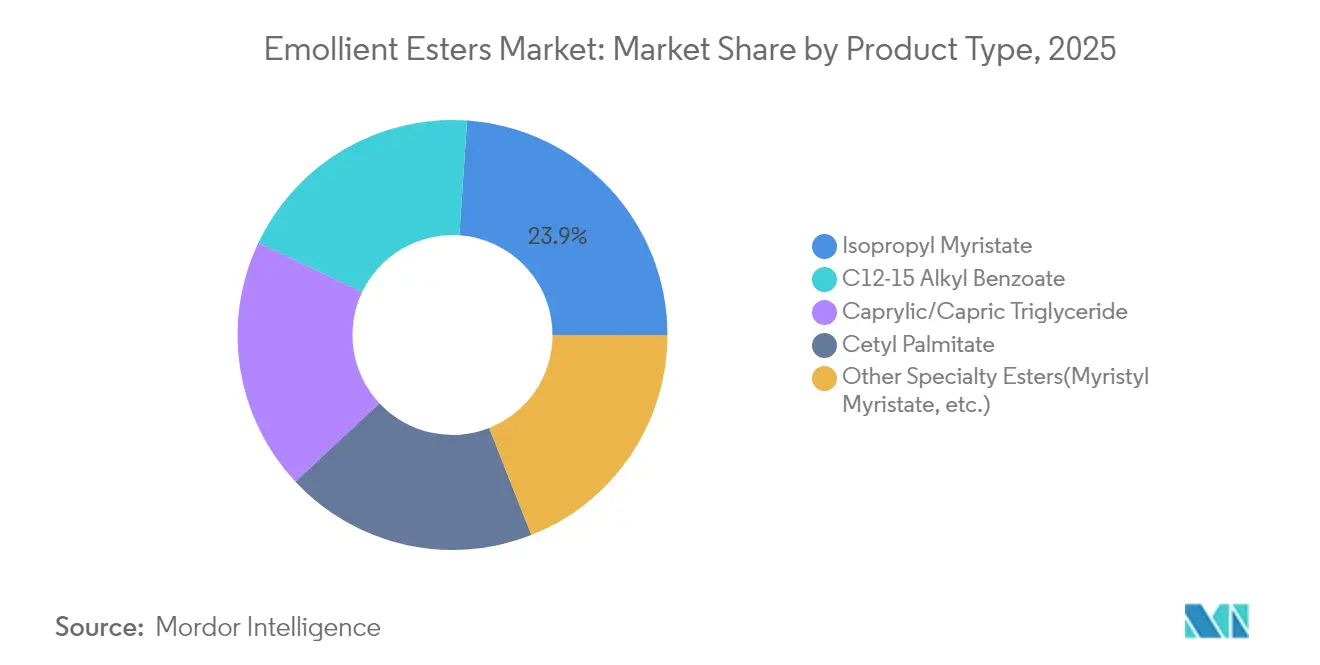
- By product type, isopropyl myristate led with 23.92% of emollient esters market share in 2025; caprylic/capric triglyceride is projected to advance at a 5.38% CAGR through 2031.
- By source, plant-derived grades held 70.35% of the emollient esters market share in 2025, while up-cycled feedstocks are set to grow the fastest at 5.65% CAGR to 2031.
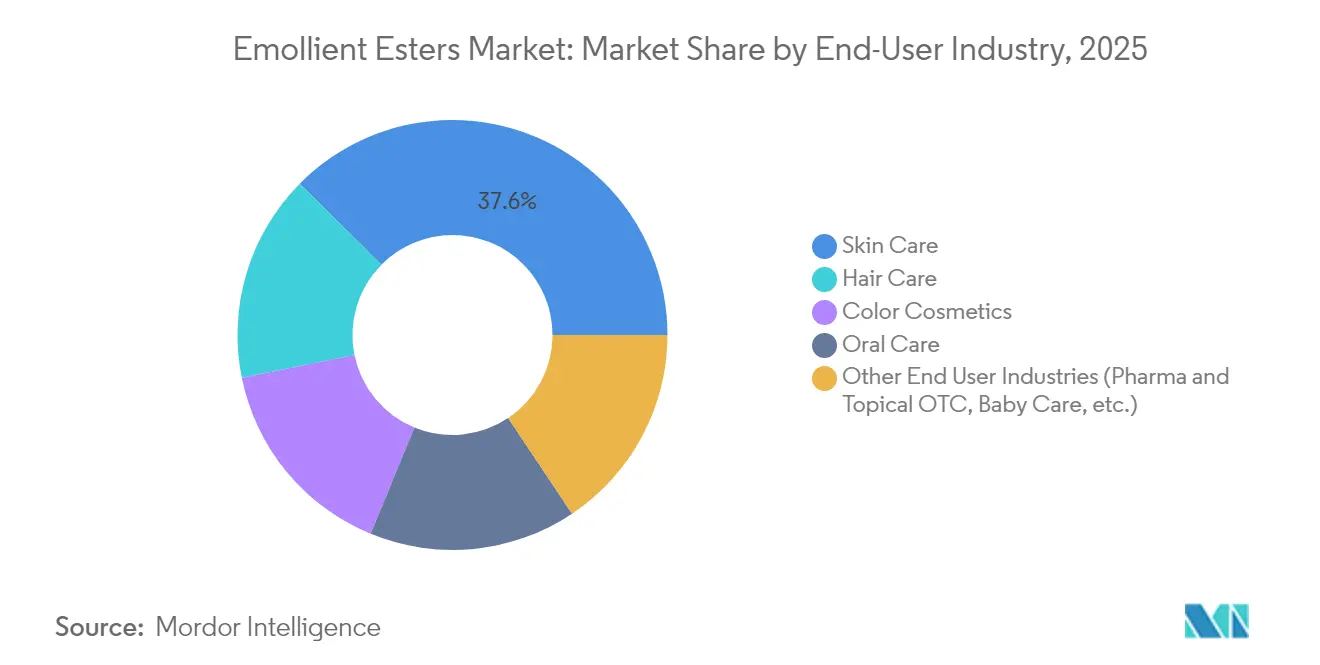
- By end-user industry, skin care accounted for 37.58% share of the emollient esters market size in 2025 and is expanding at a 5.76% CAGR through 2031.
- By geography, Asia-Pacific captured 34.62% of 2025 revenue and is expected to register the highest regional CAGR of 5.05% to 2031.
Note: Market size and forecast figures in this report are generated using Mordor Intelligence’s proprietary estimation framework, updated with the latest available data and insights as of 2026.
Global Emollient Esters Market Trends and Insights
Driver Impact Analysis*
| Driver | (~) % Impact on CAGR Forecast | Geographic Relevance | Impact Timeline |
|---|---|---|---|
| Increasing demand for personal care & cosmetic products | +1.2% | Global, with strongest impact in Asia-Pacific | Medium term (2-4 years) |
| Rising preference for naturally derived emollient esters | +0.9% | North America & Europe, expanding to Asia-Pacific | Long term (≥ 4 years) |
| Growth in dermatology & topical-pharma formulations | +0.7% | Global, led by developed markets | Medium term (2-4 years) |
| Expansion of premium beauty brands in emerging economies | +0.8% | Asia-Pacific, Latin America, MEA | Medium term (2-4 years) |
| Shift toward solid & water-free beauty formats boosting high-melting esters | +0.5% | Global, early adoption in Europe & North America | Long term (≥ 4 years) |
| Source: Mordor Intelligence | |||
Increasing Demand for Personal Care & Cosmetic Products
E-commerce penetration in tier-2 cities accounts for 55% of prestige beauty sales, broadening access to premium formulations[1]Business Standard, “China’s cosmetics retail climbs,” business-standard.com. Gen Z and millennial consumers favor clinically backed ingredients, sustaining demand for caprylic/capric triglyceride and other multifunctional esters. The result is consistent volume growth and improved average selling prices across the global emollient esters market.
Rising Preference for Naturally Derived Emollient Esters
Plant-based grades already dominate but continue to gain share as leading suppliers launch biodegradable, sustainably sourced lines, such as BASF’s new portfolio of natural betaines. Evonik’s enzymatic routes achieve full-scale CO₂ reductions, aligning with brand pledges for climate neutrality[2]Evonik Industries, “Evonik opens sustainable cosmetic ester plant in Steinau,” evonik.com. With REACH restrictions tightening, bio-based esters enjoy regulatory advantages, reinforcing their long-term growth trajectory within the emollient esters market.
Growth in Dermatology & Topical-Pharma Formulations
Cosmeceutical demand elevates performance standards for penetration enhancers and barrier-repair agents. Patent activity for fatty-acid esters as anti-Malassezia actives underscores expanding therapeutic utility. Brands willing to pay for clinically proven functionality boost the value mix of the emollient esters market.
Expansion of Premium Beauty Brands in Emerging Economies
Asia-Pacific’s USD 190 billion beauty sector is growing 6.7% annually to 2027, with premium segments capturing the lion’s share. Cross-border e-commerce delivers international brands into new cities, while local manufacturers co-develop upscale SKUs that rely on high-purity esters for texture and sensorial performance. This trend supports a positive price–mix for suppliers.
Restraint Impact Analysis*
| Restraint | (~) % Impact on CAGR Forecast | Geographic Relevance | Impact Timeline |
|---|---|---|---|
| Volatility in fatty-acid & alcohol feedstock prices | -0.8% | Global, particularly impacting Asia-Pacific producers | Short term (≤ 2 years) |
| Stringent REACH & global cosmetic-safety regulations | -0.4% | Europe leading, with global spillover effects | Medium term (2-4 years) |
| Rising substitution by silicone-free texturizers & polymers | -0.3% | North America & Europe, expanding globally | Long term (≥ 4 years) |
| Source: Mordor Intelligence | |||
Volatility in Fatty-Acid & Alcohol Feedstock Prices
Palm-oil-derived alcohol costs rose 12% in 2024, while cocoa products doubled on adverse weather, squeezing margins for ester producers dependent on these commodities. Smaller firms lacking hedging capacity face liquidity pressure, prompting investment in diversified feedstocks and enzymatic processes that tolerate variable raw-material inputs, yet near-term profitability remains vulnerable.
Stringent REACH & Global Cosmetic-Safety Regulations
The European Commission’s ban on synthetic polymer microparticles adds reformulation burdens and testing costs[3]Publications Office of the European Union, “Restrictions on synthetic polymer microparticles,” eur-lex.europa.eu. REACH dossiers demand high data fees, especially punitive for low-volume specialty esters. As the highest standard migrates worldwide, suppliers must budget for universal compliance, marginally restraining the emollient esters market CAGR.
*Our forecasts treat driver/restraint impacts as directional, not additive. The impact forecasts reflect baseline growth, mix effects, and variable interactions.
Segment Analysis
By Product Type: Specialty Esters Drive Innovation
Isopropyl myristate retained 23.92% of 2025 revenue, anchoring the emollient esters market through its broad utility in skin, hair, and color cosmetics. Caprylic/capric triglyceride’s 5.38% CAGR demonstrates a migration toward multifunctional ingredients that combine emolliency with antimicrobial action. Its popularity supports premium shelf prices and improved profitability for formulators relying on a single ingredient to deliver multiple claims.
Enzymatically produced specialty esters enable up to 60% lower carbon footprints, letting suppliers capture brand sustainability budgets. Novel C12-15 alkyl benzoate grades tailor spreading profiles for sun care, while cetyl palmitate gains relevance in solid moisturizers. Patent filings for ultra-long-chain sugar alcohol esters indicate an innovation pipeline geared toward stability and bioactivity improvements that will diversify product offerings within the emollient esters market.


By Source: Circular Economy Reshapes Supply Chains
Plant-derived grades secured a 70.35% share in 2025 on entrenched palm and coconut oil supply chains. Up-cycled oils, however, are growing 5.65% annually as processors valorize waste streams such as olive-pomace fractions into market-ready esters without additional land use. Brands value the lower environmental footprint and story-rich positioning.
Petrochemical esters remain essential in applications requiring tight viscosity tolerances, yet shrinking acceptance underscores a structural shift. Regulatory incentives favor bio-content, while supply-chain-risk mitigation pushes users to blend multiple source types. These changes diversify procurement strategies across the emollient esters market.
By End-User Industry: Skin Care Segment Drives Premium Growth
Skin care’s 37.58% share of 2025 sales and 5.76% CAGR confirm its position as the largest and fastest growth engine within the emollient esters market. Anti-aging serums, barrier-repair creams, and derma-cosmetics integrate high-performance esters that justify premium price positioning. Hair care follows, employing emollients for conditioning and cuticle protection, especially in sulfate-free shampoos that require extra sensorial agents.
Color cosmetics leverage esters for pigment wetting and texture control, with solid lipstick sticks and waterless foundations embodying rising demand for high-melting wax esters. Oral care and pharma applications, though smaller, seek clinical purity grades, providing a price premium and stable demand arc important to suppliers’ portfolio balance.
Geography Analysis
Asia-Pacific captured 34.62% of 2025 revenue and is forecast for a 5.05% CAGR. Domestic investments such as Evonik’s enzymatic line elevate regional self-sufficiency, shorten lead times, and reduce import tariffs, strengthening competitiveness across the emollient esters market.
North America exhibits mature but innovation-driven demand. Consumers pay premiums for natural, traceable ingredients, encouraging suppliers to widen bio-based offerings. Regulatory clarity by the FDA plus state-level disclosures increase documentation needs, giving technologically advanced producers an edge. Mexico’s rising contract manufacturing base benefits from near-shoring dynamics and preferential trade agreements with the United States, underpinning future growth.
Europe’s stringent environmental framework drives market evolution. REACH pushes reformulations toward low-carbon and microplastic-free esters. Germany, France, the United Kingdom, and Italy house sophisticated laboratories focused on sensory innovation and green chemistry, fostering high-value downstream demand.
South America shows early-stage expansion led by Brazil’s increasing disposable income and local beauty entrepreneurship.
The Middle East and Africa remain small yet promising, especially in Saudi Arabia and South Africa where retail modernization and social-media exposure stimulate upmarket personal care adoption.

Competitive Landscape
The global emollient esters market exhibits moderate fragmentation. Major players like BASF, Evonik, and Croda utilize strategies such as backward integration, multi-site production, and expansive technical service teams to clinch large-volume contracts. Mid-tier companies are carving niches for themselves. The presence of patent portfolios centered on solvent-free methodologies and long-chain sugar alcohol esters underscores a fierce R&D competition. Strategic moves like BASF's distribution partnership with Azelis in July 2025 and Eternis Fine Chemicals' acquisition of Sharon Personal Care in 2024 highlight a trend of consolidation. These maneuvers aim to bolster regional presence and deepen technical expertise. Together, these strategies drive product innovation and enhance supply security in the emollient esters market.
Emollient Esters Industry Leaders
The Lubrizol Corporation
Croda International Plc
Stepan Company
BASF
Evonik Industries AG
- *Disclaimer: Major Players sorted in no particular order

Recent Industry Developments
- September 2024: Evonik formally inaugurated a new production facility for cosmetic emollients at its Steinau site in Germany. This multi-million-euro investment is set to substantially enhance Evonik’s production capacity, meeting the increasing demand for sustainable cosmetic emollients.
- October 2023: BASF announced a strategic investment in a new production facility in Düsseldorf, Germany, for manufacturing emollients used in skincare and sun protection products. The upgraded facilities are scheduled to commence operations in the third quarter of 2025.


Research Methodology Framework and Report Scope
Market Definitions and Key Coverage
Our study treats the emollient esters market as the value of neat, industrial-grade fatty alcohol and fatty acid esters intentionally added to personal-care, cosmetic, and topical pharmaceutical formulations for lubrication, spreadability, and skin-conditioning functions.
Scope exclusion: other emollients such as silicones, mineral oils, fatty alcohols, and fatty acids are not counted.
Segmentation Overview
- By Product Type
- Isopropyl Myristate
- C12-15 Alkyl Benzoate
- Caprylic/Capric Triglyceride
- Cetyl Palmitate
- Other Specialty Esters(Myristyl Myristate, etc.)
- By Source
- Plant-derived
- Petrochemical-derived
- Up-cycled / By-product-derived
- By End-User Industry
- Skin Care
- Hair Care
- Color Cosmetics
- Oral Care
- Other End-User Industries (Pharma & Topical OTC, Baby Care, etc.)
- By Geography
- Asia-Pacific
- China
- India
- Japan
- South Korea
- Rest of Asia-Pacific
- North America
- United States
- Canada
- Mexico
- Europe
- Germany
- United Kingdom
- France
- Italy
- Rest of Europe
- South America
- Brazil
- Argentina
- Rest of South America
- Middle East and Africa
- Saudi Arabia
- South Africa
- Rest of Middle East and Africa
- Asia-Pacific
Detailed Research Methodology and Data Validation
Primary Research
To validate desk findings, we interviewed procurement heads at specialty-chemical producers, cosmetic formulators across Asia, Europe, and North America, and regulatory consultants who monitor REACH and FDA updates. Their insights refined assumed average selling prices, regional mix shifts toward plant-derived grades, and adoption timelines for bio-based variants, giving our model ground truth.
Desk Research
Mordor analysts began with headline data from open sources such as UN Comtrade HS-291590 trade flows, Eurostat Prodcom output tables, the US FDA Voluntary Cosmetic Registration Program, and Cosmetics Europe consumption surveys, which signpost regional demand and typical formulation load factors. We complemented these with scientific articles in journals like the International Journal of Cosmetic Science that outline typical inclusion rates and emerging bio-based alternatives, thereby anchoring technical parameters.
Company filings, investor decks, and press releases offered price and capacity clues, while paid repositories including D&B Hoovers and Dow Jones Factiva supplied revenue splits that help establish supplier weighting. This list is illustrative; many other public and proprietary sources fed the desk-research backbone.
Market-Sizing & Forecasting
A top-down reconstruction converts global oleochemical output and cross-border trade into an emollient ester demand pool, then allocates volumes to skin care, hair care, and pharma through penetration-rate analysis by region. Results are sense-checked through selective bottom-up roll-ups of disclosed producer capacities multiplied by verified ASPs, allowing one concise top-down and bottom-up alignment. Key variables driving the model include feedstock price spreads, per-capita skin-care spending, new product launch counts, regulatory restrictions on silicones, and the premium commanded by natural labels. Forecasts apply multivariate regression linked to those indicators, with scenario analysis capturing shifts in bio-based adoption and macroeconomic outlook.
Data Validation & Update Cycle
Outputs pass three analyst reviews, variance checks against independent trade and pricing series, and a lead analyst sign-off. We refresh models each year and trigger interim updates after material events, ensuring clients always receive the latest vetted view.
Why Mordor's Emollient Esters Baseline Earns Decision Maker Trust
Published estimates often diverge because firms choose dissimilar product baskets, geography splits, and refresh cadences.
Key gap drivers include whether substitutes are grouped with esters, how aggressively future ASP deflation is assumed, and if contract-manufacturing volumes are captured.
Benchmark comparison
| Market Size | Anonymized source | Primary gap driver |
|---|---|---|
| USD 1.15 B (2024) | Mordor Intelligence | |
| USD 1.80 B (2024) | Global Consultancy A | Bundles silicones and natural oils, counts finished-product value rather than raw ingredient demand. |
| USD 0.58 B (2024) | Trade Journal B | Focuses on five leading economies only and fixes a single global ASP, ignoring regional price differentials. |
The comparison shows that scope breadth and pricing logic explain most gaps. By sizing only true ester ingredients, applying region-specific ASPs, and updating annually, Mordor delivers a balanced, transparent baseline that decision-makers can trace back to clear variables and repeat with confidence.


Key Questions Answered in the Report
What is the current Emollient Esters Market size?
The emollient esters market size reached USD 632.37 million in 2026 and is projected to hit USD 780.61 million by 2031, reflecting a 4.30% CAGR.
Which region leads global demand?
Asia-Pacific commands the largest share at 34.62% in 2025 and is also the fastest-growing region, expected to record a 5.05% CAGR through 2031.
Which product category is expanding the fastest?
Caprylic/capric triglyceride is the fastest-growing product, forecast to rise at 5.38% annually to 2031 due to its multifunctional benefits.
What impact do feedstock price swings have on producers?
Volatile palm and coconut oil prices can compress margins by as much as 0.8 percentage points on forecast CAGR, prompting diversification and enzymatic processes to mitigate risk.
How are regulations shaping product development?
Stricter REACH and microplastic bans require reformulation toward biodegradable, bio-based esters, raising compliance costs but opening premium opportunities for sustainable suppliers.
Page last updated on:


