
Market Overview
| Study Period | 2020 - 2031 |
|---|---|
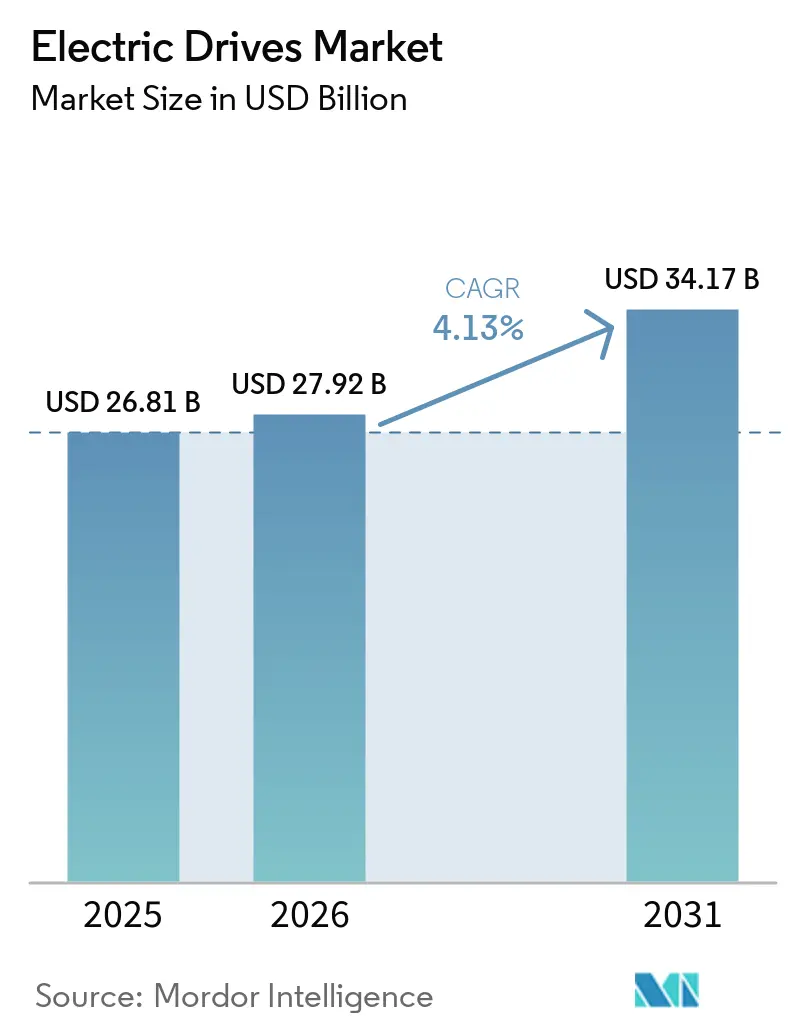
| Market Size (2026) | USD 27.92 Billion |
| Market Size (2031) | USD 34.17 Billion |
| Growth Rate (2026 - 2031) | 4.13 % |
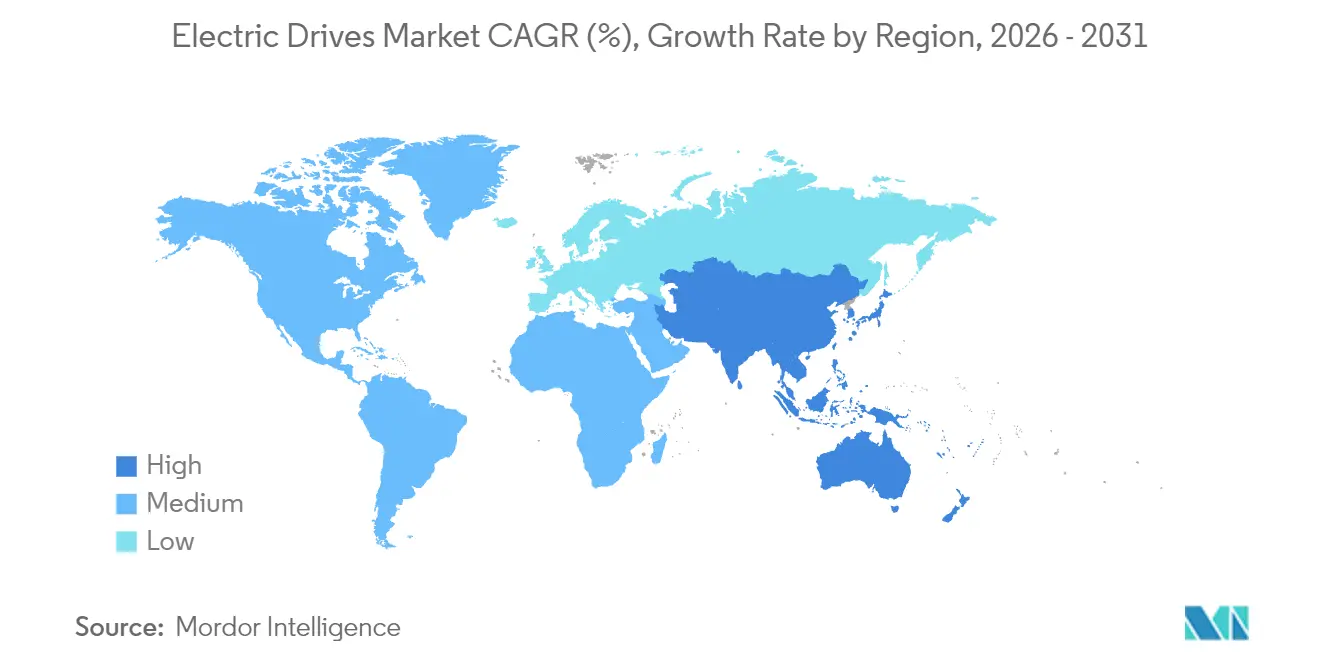
| Fastest Growing Market | Africa |
| Largest Market | Asia Pacific |
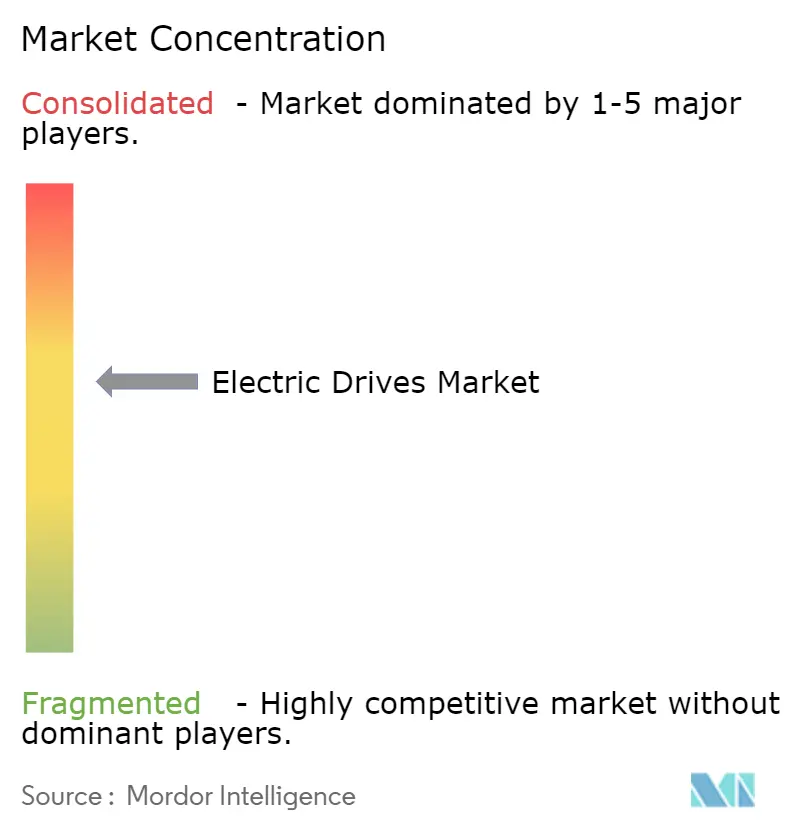
| Market Concentration | Medium |
Major Players *Disclaimer: Major Players sorted in no particular order Image © Mordor Intelligence. Reuse requires attribution under CC BY 4.0. | |
Electric Drives Market Analysis by Mordor Intelligence
electric drives market size in 2026 is estimated at USD 27.92 billion, growing from 2025 value of USD 26.81 billion with 2031 projections showing USD 34.17 billion, growing at 4.13% CAGR over 2026-2031. Growth rests on three pillars: mandatory efficiency rules that push variable-speed adoption, e-mobility lines demanding high-precision motion, and brownfield retrofits aimed at slashing utility bills. Asia Pacific leads with 45.64% revenue share in 2024 because of China’s factory scale and India’s expanding industrial base, while Africa registers the fastest 5.46% CAGR on the back of mining and infrastructure spending. AC units deliver the bulk of shipments at 71.13% share, yet servo drives advance the quickest at a 4.47% CAGR, mirroring discrete manufacturing’s need for micron-level positioning. Medium-voltage projects also pick up pace, logging a 4.81% CAGR as heavy-industry operators modernize compressor and pump assets.
Key Report Takeaways
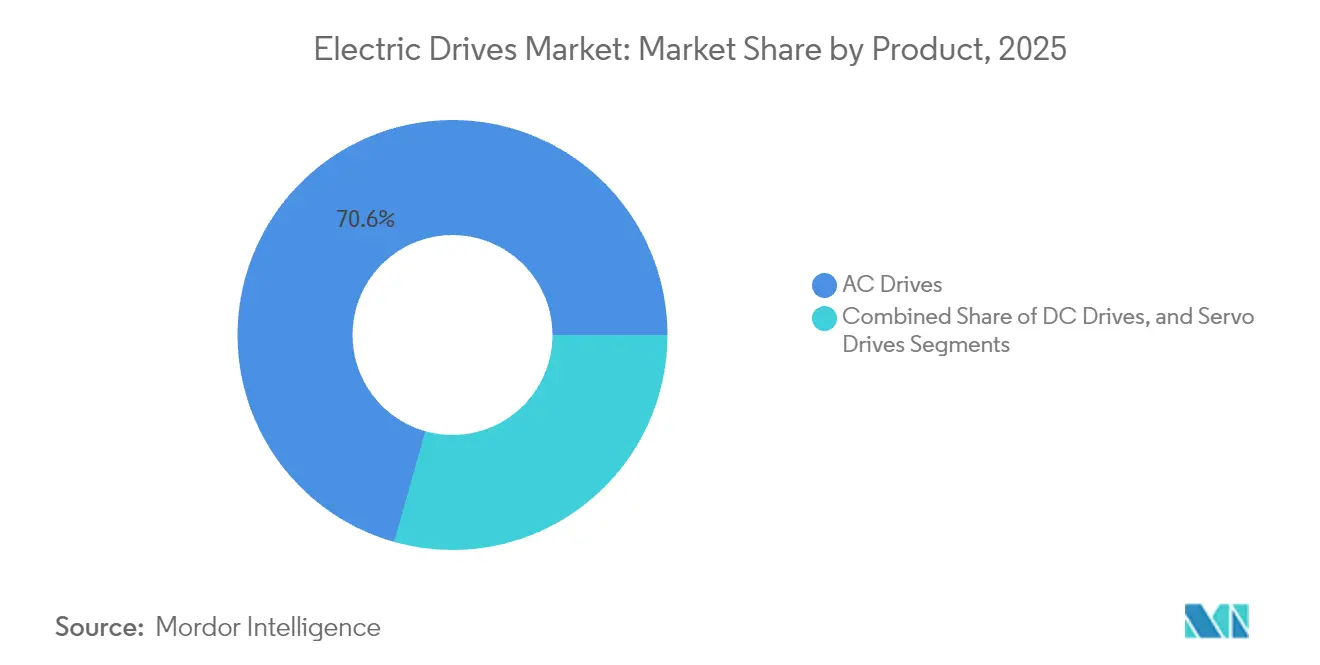
- By product category, AC drives held 70.62% revenue share in 2025, while servo drives are forecast to expand at a 4.25% CAGR through 2031.
- By voltage class, low-voltage units captured 62.98% of the electric drives market size in 2025, whereas medium-voltage solutions are projected to post a 4.62% CAGR to 2031.
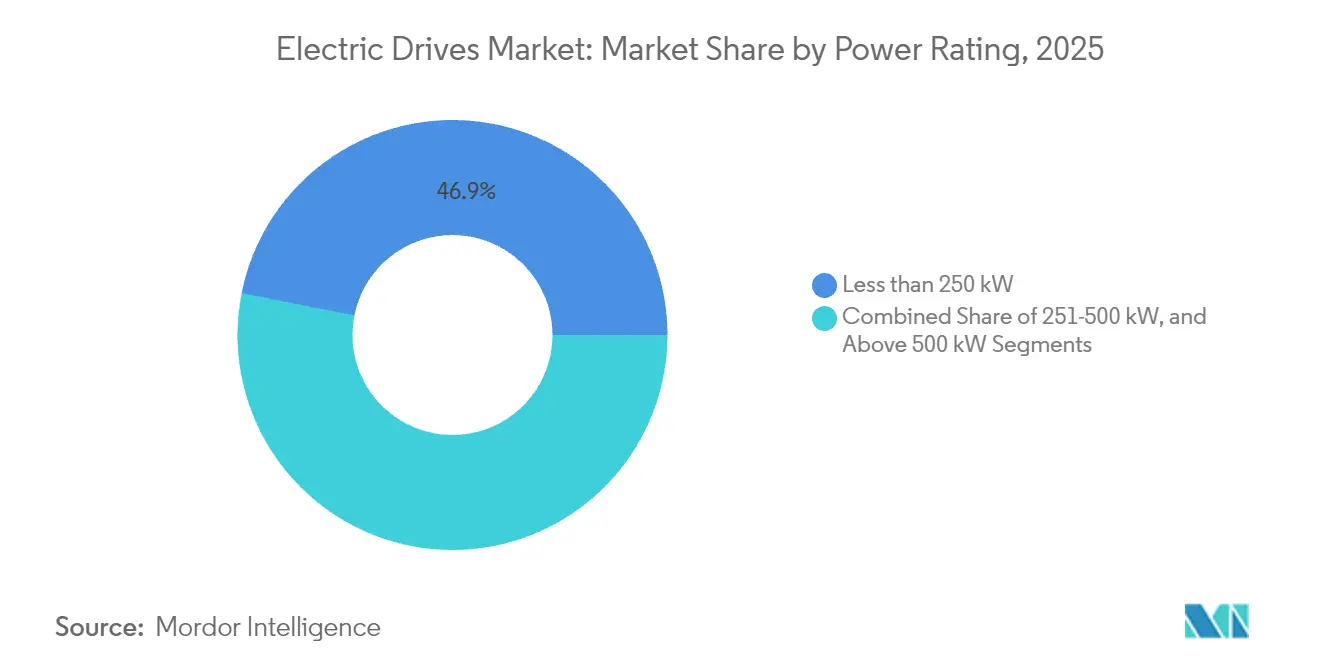
- By power rating, sub-250 kW equipment accounted for 46.87% of the electric drives market size in 2025, but the 251-500 kW band is set to rise at a 4.38% CAGR over the same horizon.
- By end-user, oil and gas generated 23.55% of 2025 revenue, while discrete industries record the highest 4.65% CAGR through 2031.
- By geography, Asia Pacific led with 45.10% electric drives market share in 2025; Africa is expected to deliver the top regional CAGR of 5.26% between 2026 and 2031.
Note: Market size and forecast figures in this report are generated using Mordor Intelligence’s proprietary estimation framework, updated with the latest available data and insights as of 2026.
Market Trends and Insights
Drivers Impact Analysis of Electric Drives Market*
| Driver | (~) % Impact on CAGR Forecast | Geographic Relevance | Impact Timeline |
|---|---|---|---|
| Rapid industrialisation in process and discrete manufacturing hubs | +0.8% | Asia Pacific core, spill-over to Middle East and Africa | Medium term (2-4 years) |
| Stringent global and national energy-efficiency mandates | +1.2% | Global, early gains in North America and EU | Long term (≥ 4 years) |
| Acceleration of e-mobility production lines needing high-precision drives | +0.6% | Global, concentrated in automotive regions | Medium term (2-4 years) |
| Digital retrofits - variable-speed drives for brownfield energy savings | +0.9% | North America and EU legacy industrial bases | Short term (≤ 2 years) |
| AI-enabled predictive maintenance reducing downtime of drive systems | +0.5% | Global, early adoption in developed markets | Long term (≥ 4 years) |
| Shift toward rare-earth-free topologies | +0.4% | Global, driven by supply-chain resilience needs | Long term (≥ 4 years) |
| Source: Mordor Intelligence | |||
Stringent Global and National Energy-Efficiency Mandates
New U.S., European and Chinese rules elevate minimum motor efficiency levels, effectively compelling variable-frequency drive adoption in energy-intensive plants.[1] Industrial audits show motors consuming up to 70% of manufacturing electricity, so replacing fixed-speed starters yields sizable carbon and cost savings. Governments now link tax incentives and grant programs to verified drive retrofits, creating predictable demand for certified products. Vendors respond by packaging drives with energy-assessment software that quantifies payback in under three years. As a result, the electric drives market gains a durable replacement cycle anchored in policy enforcement.
Acceleration of E-Mobility Production Lines Needing High-Precision Drives
Battery assembly, motor winding and quality-control stations in electric-vehicle plants require sub-0.1 millimeter repeatability, placing servo drives at the heart of line design Automotive OEMs have committed more than USD 100 billion toward electrification, and each greenfield factory specifies advanced motion packages from day one. Brownfield retrofits of internal-combustion plants also replace legacy conveyors with servo-based flexible cells. Servo vendors add integrated safety and decentralized I/O to simplify robot collaboration, accelerating plug-and-play deployment. This continuous capital flow cements the electric drives market as a primary beneficiary of e-mobility investment.
Digital Retrofits - Variable-Speed Drives for Brownfield Energy Savings
Legacy facilities often install drives to slash pump and fan energy use by 20-50%, with a documented 30% cut at a U.S. steel mill after cooling-water upgrades.[2] Retrofits avoid major civil works, so plant downtime remains minimal and payback averages two years. Medium-voltage variants serve aging compressors above 2 MW, where savings compound through reduced reactive-power penalties. Suppliers bundle harmonic filters and remote-monitoring gateways, turning projects into turnkey packages that ease procurement hurdles. Consequently, retrofit demand stabilizes revenue even when greenfield spending cycles soften.
AI-Enabled Predictive Maintenance Reducing Downtime of Drive Systems
Smart drives embed vibration and temperature sensors that stream data into cloud models, enabling fault prediction two to four weeks ahead.[3] Pilot sites report 40% fewer unplanned stoppages, avoiding plant-wide shutdowns that can cost USD 500 000 per event. Maintenance teams shift from reactive to scheduled repairs, freeing labor and spare-parts budgets. Vendors monetize the feature through subscription dashboards, turning post-install service into a recurrent revenue line. The approach strengthens customer lock-in and boosts the electric drives market’s value proposition.
Restraints Impact Analysis of Electric Drives Market*
| Restraint | (~) % Impact on CAGR Forecast | Geographic Relevance | Impact Timeline |
|---|---|---|---|
| High initial capex versus fixed-speed alternatives | -0.7% | Global, acute in price-sensitive emerging markets | Short term (≤ 2 years) |
| Reliability concerns in harsh-duty, high-harmonic environments | -0.4% | Global, concentrated in heavy industry sites | Medium term (2-4 years) |
| Supply-chain volatility for power-electronic parts and magnets | -0.6% | Global, acute in Asia Pacific manufacturing | Short term (≤ 2 years) |
| Cyber-security vulnerabilities in network-connected smart drives | -0.3% | Global, heightening in critical infrastructure sectors | Long term (≥ 4 years) |
| Source: Mordor Intelligence | |||
High Initial Capex Versus Fixed-Speed Alternatives
Variable-frequency drives cost three to five times more than contactor starters, making capex a hurdle in cash-constrained plants. Payback periods under three years appeal to financially savvy operators, yet many still defer upgrades when electricity is subsidized. The objection is acute in sub-15 kW ranges where absolute savings are modest, extending breakeven timelines. Financing options such as drive-leasing or energy-as-a-service are emerging but remain scarce outside North America and Western Europe. Over time, falling semiconductor prices and utility incentives may ease the barrier, widening addressable demand in the electric drives market.
Cyber-Security Vulnerabilities in Network-Connected Smart Drives
Industrial cyber incidents targeting drive firmware climbed 40% in 2024, exposing new attack surfaces in connected production lines. Hackers exploit outdated authentication schemes to pivot into plant control networks, a threat absent in legacy stand-alone starters. Recent advisories involving ABB and Siemens code bases heightened awareness and forced urgent patch cycles. Critical-infrastructure operators now specify IEC 62443 compliance and zero-trust architectures before approving smart-drive purchases. Meeting these security benchmarks adds cost and lengthens validation, tempering near-term upgrade momentum in the electric drives market.
*Our forecasts treat driver/restraint impacts as directional, not additive. The impact forecasts reflect baseline growth, mix effects, and variable interactions.
Electric Drives Market Segment Analysis
By Product:
AC Leadership and Servo MomentumAC drives held a dominant 70.62% electric drives market share in 2025, reflecting their versatility in pumps, fans and conveyor lines that underpin global factory automation. Standardized interfaces, mature component supply chains and broad installer familiarity sustain demand, particularly in food processing and water utilities where reliability trumps cutting-edge performance. Over the forecast horizon, the electric drives market will continue to rely on AC platforms for baseline motor control as utilities tighten efficiency targets in centrifugal equipment. Servo drives remain the fastest-growing niche with a 4.25% CAGR through 2031 thanks to discrete manufacturing plants that require sub-micrometer positioning in battery, electronics and medical-device assembly. Servo vendors now bundle integrated safety functions and one-cable networks, distinguishing their premium offerings from commoditized AC units.
The electric drives market benefits from a technology crossover as servo algorithms migrate into high-end AC packages, blurring historic product lines while keeping cost curves attractive for mid-tier users. DC drives, once favored in metals and mining, now occupy shrinking pockets because modern AC vector control replicates their torque fidelity at lower maintenance cost. Yet some rolling-mill operators still specify DC units for legacy compatibility, providing a modest replacement stream. Multi-drive platforms that combine AC, servo and DC axes in a single rack are gaining attention, especially among machine-builder OEMs that value unified programming across motion classes. This convergence supports life-cycle service revenues for top suppliers, reinforcing moderate concentration in the broader electric drives market.

By Voltage:
Low-Voltage Dominance and Medium-Voltage ExpansionLow-voltage systems below 1 kV accounted for 62.98% of 2025 revenue, underpinning most factory pumps, compressors and material-handling lines. Installation simplicity, ready availability of molded-case protection gear and widespread technician skill sets keep total ownership cost low, ensuring that the electric drives market retains a low-voltage core in standard manufacturing. Growth nonetheless skews toward medium-voltage electric drives, which are projected to advance at a 4.62% CAGR through 2031 as heavy-industry operators upgrade large motors to variable-speed duty.
Medium-voltage projects typically surface during brownfield capacity expansions or greenfield investments in LNG, cement and desalination plants, where pumps or compressors exceed 2 MW. Operators favor these solutions for improved power factor and reduced cable losses relative to running multiple low-voltage motors in parallel. Quasi-two-level inverter topologies, silicon-carbide devices and regenerative capabilities now differentiate premium medium-voltage packages, helping suppliers justify higher margins. Utility-interactive features such as harmonic mitigation and grid-support modes align with nascent microgrid programs in mining and remote oilfields, adding resilience value. As a result, the electric drives market sees a bifurcation: commoditized low-voltage volumes sustain scale while technologically sophisticated medium-voltage units generate disproportionate profit pools.
By Power Rating:
Sub-250 kW Core and Mid-Tier UpshiftSystems below 250 kW captured 46.87% electric drives market share in 2025, mirroring the prevalence of 75 kW and 110 kW motors in HVAC, packaging and municipal water applications. These ratings benefit from catalogue-based ordering, rapid delivery and extensive channel coverage, factors that keep average selling prices under competitive pressure. The 251-500 kW range is forecast to expand at a 4.38% CAGR through 2031 as manufacturers consolidate multiple production lines into higher-capacity cells to save floor space and maintenance cost. This trend enlarges the electric drives market size at mid-tier levels, encouraging suppliers to widen their frame offerings with enhanced cooling and modular IP55 cabinets.
Process industries upgrading from 1980s-era constant-speed motors often step straight into the mid-tier power band to unlock immediate energy savings with minimal plant re-plumbing. Schneider Electric’s latest Altivar Process series demonstrates the appeal by integrating process logic, thus allowing a single drive to regulate flow, pressure and level without standalone PLCs. Above 500 kW, growth remains restrained to custom mining shovels, rolling mills and tunnel-boring machines, where long engineering cycles slow volume gains. Nonetheless, mega-projects in Middle Eastern desalination and African copper mining sustain a steady flow of high-power tenders that contribute lumpy yet lucrative revenue to the electric drives market.
By End-User:
Oil and Gas Weight and Discrete Manufacturing UpsideOil and gas applications generated 23.55% of 2025 revenue, leveraging drives for pipeline compressors, drilling mud pumps and subsea boosting where uptime is paramount. Ruggedized enclosures, conformal coating and explosion-proof ratings differentiate offerings, while digital-twin models help operators schedule offshore maintenance windows efficiently. Water and wastewater utilities follow closely, as regulators tighten energy benchmarks for lift-station and aeration blowers, prompting municipalities to tap grant funding earmarked for carbon reduction.
Discrete manufacturing posts the highest 4.65% CAGR through 2031, reflecting global investment in electric-vehicle battery lines, smart-phone assembly and precision medical devices. These plants demand servo-class accuracy, deterministic EtherCAT networks and integrated functional safety to support collaborative robots. Electronics assemblers in Vietnam and India now specify predictive-maintenance dashboards as standard, driving incremental software revenue for suppliers. Chemical and petrochemical segments maintain baseline demand for flameproof drives, especially in Middle East complexes where integrated refining-to-chemicals capacity is scaling. Across all verticals, the electric drives industry increasingly monetizes data services, shifting value from hardware margins to subscription analytics.
Geography Analysis
APAC Electric Drives Market
Asia Pacific retained the largest share of the electric drives market in 2025 at 45.10%, sustained by China’s USD 50 billion 2024 automation spend and India’s incentive-backed factory build-out. Chinese enterprises continue to replace legacy starters with variable-speed packages to satisfy the country’s latest energy-intensity mandate, while servo adoption accelerates in battery-gigafactory clusters along the Yangtze River Delta. India’s Production Linked Incentive scheme drives localized manufacturing of whitegoods, spurring mid-range servo demand in sheet-metal presses and injection-molding machines. Japan and South Korea remain technology front runners, purchasing premium AI-enabled drives for collaborative robot cells and semiconductor fabs, whereas Southeast Asian nations advance from pilot automation cells to full production lines. These combined activities cement regional primacy in the electric drives market.
North America Electric Drives Market
North America delivers steady replacement demand as brownfield plants retrofit drives to meet U.S. DOE motor rules and leverage utility rebates for demand-response. Automotive reshoring initiatives around the Great Lakes trigger fresh servo orders, underscoring the electric drives market size within discrete manufacturing. Canada’s mining sector deploys medium-voltage packages in potash and nickel expansions, while Mexico’s tier-one automotive suppliers specify safety-integrated servos for transmission-housing machining centers. A parallel trend toward predictive-maintenance cloud platforms favors domestic software ecosystems, ensuring that digital services layer atop hardware shipments.
Europe and Africa Electric Drives Market
Europe represents a mature yet innovation-driven arena where Industry 4.0 roadmaps and the European Green Deal reinforce variable-speed penetration. German automation exporters demand synchronous-reluctance drives to trim magnet material risk, Italian machinery OEMs embed cyber-secure firmware to protect intellectual property, and Nordic process plants adopt regenerative drives to bolster renewable-heavy grids. Africa, although holding a smaller base today, records the fastest 5.26% CAGR to 2031 as South African mines electrify haul trucks and Nigerian cement presses install medium-voltage inverters. European manufacturers relocating labor-intensive stages to North Africa also lift localized servo uptake. Collectively, these patterns diversify regional revenue streams, stabilizing the long-term trajectory of the electric drives market.
Regulatory Landscape
Energy-efficiency regulation is a key policy lever for electric drives, with the EU Ecodesign framework (Regulation (EU) 2019/1781) setting minimum efficiency requirements that cover variable speed drives in the 0.12 kW to 1000 kW range. This tightens compliance focus for mainstream low-voltage AC products. In the United States, the Department of Energy expanded motor coverage through its January 2025 final rule for expanded scope electric motors (ESEMs), with compliance timelines extending to 2029. The change influences OEM motor-and-drive pairing decisions and documentation requirements in North America.
Standards and conformity assessment updates also shape product engineering and time-to-market. IEC continued to update the IEC 61800 family used for drive safety, EMC, and efficiency benchmarking, including publication of EN IEC 61800-9-2:2025 (March 2025) for energy efficiency of power electronics, which supports more comparable efficiency claims for drives and drive systems. For CE-marked servo drives in Europe, certification pathways tightened further through TUV Rheinland guidance effective April 22, 2026, requiring joint validation of functional safety (PLd aligned to IEC 61800-5-2) and EMC immunity (IEC 61800-3 Ed.3). This increases the importance of coordinated testing plans across design, firmware, and EMC labs. In parallel, the US DOE updated its enforcement policy on June 10, 2026 to defer enforcement for certain voluntary representations on expanded motor categories until October 14, 2026, affecting how suppliers communicate efficiency attributes during the transition.
Value Chain Analysis
The electric drives value chain begins with upstream materials and components, including copper and electrical steel for motors, rare-earth materials for magnet-based designs, and power semiconductors used in inverters. Midstream manufacturing covers drive electronics (power modules, control boards, housings), motor subassemblies (stators, rotors, magnets), and firmware and safety functions. System integration by OEMs and Tier suppliers, including automotive and industrial automation integrators, follows, along with distribution through direct sales, system integrators, and industrial channel partners. Downstream value increasingly comes from commissioning tools, energy-audit and tuning software, and condition-monitoring subscriptions as drives become more networked within PLC and Industrial Ethernet environments.
Supply continuity and qualification cycles remain central constraints, especially around magnets and semiconductors. China-linked rare-earth export controls and related shortages reported in 2025 underscored vulnerability in magnet supply and rippled into motor and inverter schedules. That aligns with the report context shifts toward magnet-lean or rare-earth-free topologies. At the same time, ecosystem partnerships are being used to secure critical power-electronics content and align platforms, illustrated by onsemi and Geely expanding collaboration in April 2026 around silicon carbide (EliteSiC) for vehicle platforms, and NIO and Bosch signing a strategic cooperation agreement in February 2026 across powertrain and related control domains. These moves point to tighter coupling between device suppliers, drive electronics, and end-equipment roadmaps, with qualification and functional-safety validation increasingly shared across the chain.
Competitive Landscape
The electric drives market features moderate concentration as the top five vendors account for roughly 55% of global revenue, enabling them to pursue differentiation through technology rather than price cuts. ABB, Siemens and Schneider Electric emphasize cybersecurity-hardened firmware that meets IEC 62443 guidelines, securing bids in critical infrastructure plants concerned about network threats. Yaskawa and Mitsubishi Electric concentrate on high-precision servo portfolios with one-cable safety architectures that streamline robot integration in battery and electronics assembly. Across the leader cohort, AI-enabled predictive-maintenance modules have become table stakes, feeding cloud dashboards that shorten diagnostic cycles and lift service attach rates.
Mid-tier challengers such as TMEIC and Danfoss leverage niche strengths in medium-voltage and HVAC energy-savings applications, often winning through life-cycle cost modeling that quantifies double-digit electricity reductions. Component suppliers including Infineon and Wolfspeed enter the ecosystem through silicon-carbide devices, forming co-development alliances to optimize inverter efficiency and thermal profiles. Rare-earth-free motor topologies open white-space for disruptors like ZF, which promotes switched-reluctance platforms for e-axle systems in commercial vehicles. Strategic acquisitions continue, exemplified by Schaeffler’s 2024 purchase of Vitesco, signaling vertical integration as a hedge against supply-chain volatility. Collectively, these dynamics maintain competitive tension while reinforcing a technology-led growth path for the electric drives market.
Electric Drives Industry Leaders
-
ABB Ltd
-
Siemens AG
-
Rockwell Automation Inc.
-
Schneider Electric SE
-
Danfoss A/S
- *Disclaimer: Major Players sorted in no particular order
Electric Drives Market Companies Covered in this Report
- ABB Ltd.
- Siemens AG
- Danfoss A/S
- Rockwell Automation Inc.
- Schneider Electric SE
- Yaskawa Electric Corporation
- Mitsubishi Electric Corporation
- Nidec Corporation
- SEW-EURODRIVE GmbH and Co KG
- TMEIC Corporation
- WEG S.A.
- Hitachi Ltd.
- Fuji Electric Co. Ltd.
- Eaton Corporation plc
- Emerson Electric Co.
- Toshiba International Corporation Inc.
- Parker Hannifin Corporation
- Regal Rexnord Corporation
- Johnson Electric Holdings Limited
- Bonfiglioli Riduttori S.p.A.
Market Opportunities and Future Outlook
Near-term opportunities concentrate where compliance, digitization, and resilience intersect. Efficiency and conformity anchors such as EU Ecodesign Regulation (EU) 2019/1781 for motors and variable speed drives, along with the March 2025 publication of EN IEC 61800-9-2:2025, create value for suppliers that can document system-level efficiency and simplify selection for retrofit buyers. This is particularly relevant in high-duty pump, fan, and compressor assets where variable-speed projects are procured on payback and verification. In servo-heavy discrete manufacturing, tighter EU-facing certification requirements signaled by TUV Rheinland guidance effective April 22, 2026, which calls for joint validation of functional safety and EMC for CE marking of servo drives, also drives demand for pre-certified servo platforms and test-ready design kits that reduce machine-builder compliance work.
Supply-chain volatility and the shift toward wide-bandgap power electronics open additional product and service space. The rare-earth bottlenecks highlighted in 2025, and the resulting interest in synchronous reluctance and other rare-earth-free approaches referenced in the report context, benefit drive vendors offering proven sensorless control, robust harmonic mitigation, and application engineering for harsh-duty environments. Digital and ruggedization criteria are also shaping buying decisions: ABBs May 2026 expansion of IP66 and UL Type 4X industrial drive variants points to end-users prioritizing protection ratings to avoid secondary enclosures and reduce installation cost in washdown or outdoor sites. ZVEIs March 2026 Drive System 2030 white paper further reinforces the direction toward connectivity and IIoT integration. Together, these proof points support opportunities in packaged retrofit solutions (drive plus filters, monitoring gateway, and verification software) and in software-defined drive management that can be deployed across brownfield estates to standardize diagnostics, cybersecurity practices, and maintenance workflows.
Recent Industry Developments in Electric Drives Market
- July 2026: Danfoss introduced major software and hardware updates for its iC7-Automation variable frequency drive, adding built-in ATEX support, PROFINET S2 redundancy, and higher power density options for 500 V and 690 V modules. The update strengthens Danfoss positioning in hazardous-area and high-availability production lines, where certification and network resilience can be decisive in vendor selection.
- May 2026: ABB expanded its industrial drives portfolio with IP66 and UL Type 4X variants designed for demanding environments. By enabling drive deployment without additional protective enclosures in harsh or washdown settings, the release targets faster installation and lower total installed cost for users in industries such as water, food processing, and outdoor material handling.
- June 2024: Airbus and Toshiba partnered to co-develop electric propulsion systems for urban air mobility aircraft. The collaboration highlighted continued technology transfer between high-performance electric propulsion and industrial drive capabilities, supporting broader demand for advanced power electronics, control algorithms, and high-reliability motor-drive integration.
Electric Drives Market Report Scope and Research Methodology
Market Definition and Coverage
In this report, the electric drives market covers revenue earned from AC drives, DC drives, and servo drives used to control electric motor speed and torque across industrial and infrastructure settings, measured on a value basis in USD.
Scope exclusions: We exclude the electric motor as a standalone product and count only the drive and its associated control electronics sold as an electric drive solution.
Segments Covered in This Report
- By Product
- AC Drives
- DC Drives
- Servo Drives
- By Voltage
- Low-Voltage Drive
- Medium-Voltage Drive
- By Power Rating
- Less than 250 kW
- 251-500 kW
- Above 500 kW
- By End-User Industry
- Oil and Gas
- Water and Wastewater
- Chemical and Petrochemical
- Food and Beverage
- Power Generation
- HVAC
- Pulp and Paper
- Discrete Industries
- Other End-User Industries
- By Geography
- North America
- United States
- Canada
- Mexico
- South America
- Brazil
- Argentina
- Rest of South America
- Europe
- Germany
- Italy
- United Kingdom
- France
- Spain
- Rest of Europe
- Asia Pacific
- China
- Japan
- India
- South Korea
- Rest of Asia Pacific
- Middle East
- Saudi Arabia
- United Arab Emirates
- Turkey
- Rest of Middle East
- Africa
- South Africa
- Nigeria
- Rest of Africa
- North America
Data Sources, Market Sizing, and Validation
Desk Research
Desk research is used to build the model structure and keep assumptions tied to observable industrial activity. We reference public sources such as the International Energy Agency (for energy efficiency signals), US Energy Information Administration (for industrial electricity context), Eurostat and UN Comtrade (for production and trade direction checks), and statistics or publications from groups such as NEMA or IEC for motor system efficiency and standards context.
We also review company filings, annual reports, investor presentations, and credible press coverage to understand where demand is rising, which end users are investing, and how pricing is moving across voltage and power ranges. Where it helps fill data gaps, we use paid subscriptions for company financials and intelligence, patent databases, and shipment level trade datasets to validate product mix and regional exposure. These desk research sources are illustrative only, and many other public and paid references were also used to collect, validate, and clarify the data.
Primary Interviews and Surveys
Primary work is used to confirm what is actually being purchased, how projects are budgeted, and how pricing changes flow into realized revenues. We spoke with drive manufacturers, distributors, and system integrators, plus end users across industries such as water and wastewater, oil and gas, power generation, HVAC, and discrete manufacturing. We then stress-tested the same assumptions across APAC, EMEA, and the Americas to avoid a single-region view.
Distribution of primary research fieldwork respondents
| Company type | Respondent position | Region |
|---|---|---|
| Top tier: 33% | CXOs: 16% | APAC: 49% |
| Mid tier: 49% | Functional/Unit leaders: 37% | EMEA: 30% |
| Smaller Players: 18% | Managers: 47% | Americas: 21% |
Market-Sizing & Forecasting
Sizing starts with a top-down build where industrial activity and motor system efficiency adoption are mapped into a demand pool for drives, which is then split by product type, voltage class, power rating, end-user industry, and region. To keep totals realistic, we corroborate them with selective bottom-up approximations, such as sampled ASP multiplied by shipment volumes for key voltage bands and channel checks on large project ordering.
Inputs that matter in this market include the installed base of motor driven equipment in process industries, the pace of variable speed drive penetration in pumps, fans, and compressors, the share shift between low-voltage and medium-voltage projects, power-rating mix changes, and replacement timing linked to efficiency standards and energy price pressure. When a segment has limited visibility, we bridge the gap using conservative mix assumptions and then stress-test them through integrator and end-user feedback.
For forecasting, we mainly use scenario analysis supported by short ARIMA trend checks on industrial production and energy consumption indicators. Then scenario weights are adjusted based on what experts see in project pipelines and budget cycles. This approach avoids overreacting to a single year swing while still reflecting real changes in pricing and mix.
Data Validation & Update Cycle
Before sign-off, our estimates are cross-checked against independent signals like industrial electricity use, automation capex direction, and trade movement for key drive categories, and then unusual jumps are reviewed at a segment level. When variances are large, we re-check the scope boundary, rerun price and mix assumptions, and re-contact selected respondents to confirm whether the change is real or a modeling artifact.
Reports are refreshed annually, and interim updates are triggered when material events affect pricing, supply availability, or end-user spending patterns. Right before delivery, an analyst performs a fresh pass on currency conversion timing, recent announcements, and the latest public indicators so clients receive the most current view possible.
Mordor Intelligence's Electric Drives Market Estimate Compared With Other Published Estimates
Published market sizes for electric drives can look far apart, even when the market sounds like the same thing, because update timing and counted scope do not always match. Differences also show up when one estimate uses aggressive price growth assumptions, or when regional currency conversion dates are not aligned to the same fiscal period.
In our work, the refresh cycle matters because drive pricing and project timing can shift within a year, especially across low-voltage versus medium-voltage orders and across power-rating bands. When exchange rates are applied at different points in the year, the same local revenues can translate into different USD totals, and this spread is reduced through re-checks on ASP progression and segment mix, a discipline applied by Mordor Intelligence.
Benchmark comparison
| Source | Market Size | Gaps in Research Methodology |
|---|---|---|
| Mordor Intelligence | USD 27.92 B (2026) | |
| Global Consultancy A | USD 95.28 B (2024) | This figure appears to use a broader definition that can fold in adjacent electric drive system elements beyond drives, and it also reflects a different base year that is not directly comparable to a 2026 current-year view. |
| Industry Publisher B | USD 27.30 B (2025) | The scope likely mixes in electric drivetrains or vehicle-focused drive categories, and the pricing path to the next years is not clearly tied to voltage and power-rating mix, which can shift the USD total even if unit activity is similar. |
Across the three figures, the largest gaps are explained by scope boundaries and timing choices, not by a single arithmetic mistake. By keeping the counted product set limited to drives and by aligning pricing, mix, and currency timing to a consistent year basis, the resulting market size stays traceable to clear inputs that can be repeated and rechecked.
Key Questions Answered in the Report
How large is the electric drives market in 2026?
The market size is USD 27.92 billion in 2026.
What CAGR is forecast for electric drives between 2026 and 2031?
The market is projected to grow at a 4.13% CAGR over the period.
Which product category leads revenue share?
AC drives hold the largest share at 70.62% in 2025.
Which end-user segment is expanding fastest?
Discrete manufacturing is expected to advance at a 4.65% CAGR through 2031.
Which region shows the highest growth rate?
Africa is forecast to post the fastest 5.26% CAGR up to 2031.
What technology trend differentiates leading suppliers?
AI-enabled predictive maintenance and cybersecurity-hardened firmware distinguish top vendors.