
Market Overview
| Study Period | 2020 - 2031 |
|---|---|
| Forecast Data Period | 2026 - 2031 |
| Historical Data Period | 2020 - 2024 |
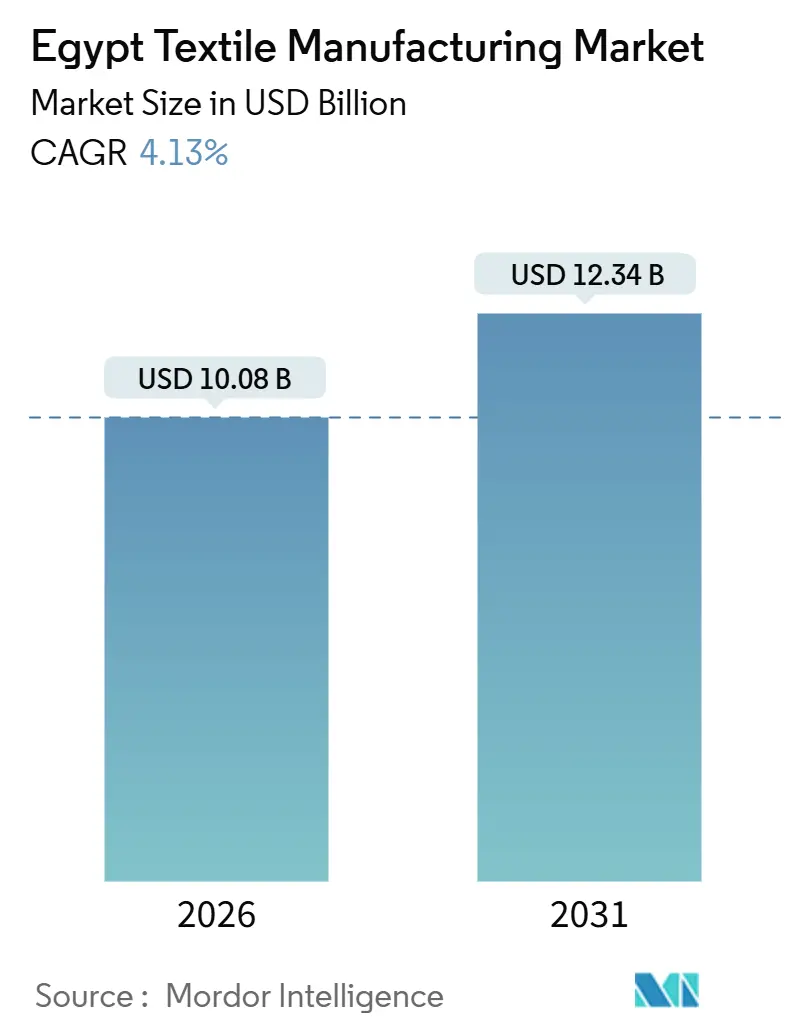
| Market Size (2026) | USD 10.08 Billion |
| Market Size (2031) | USD 12.34 Billion |
| Growth Rate (2026 - 2031) | 4.13 % |
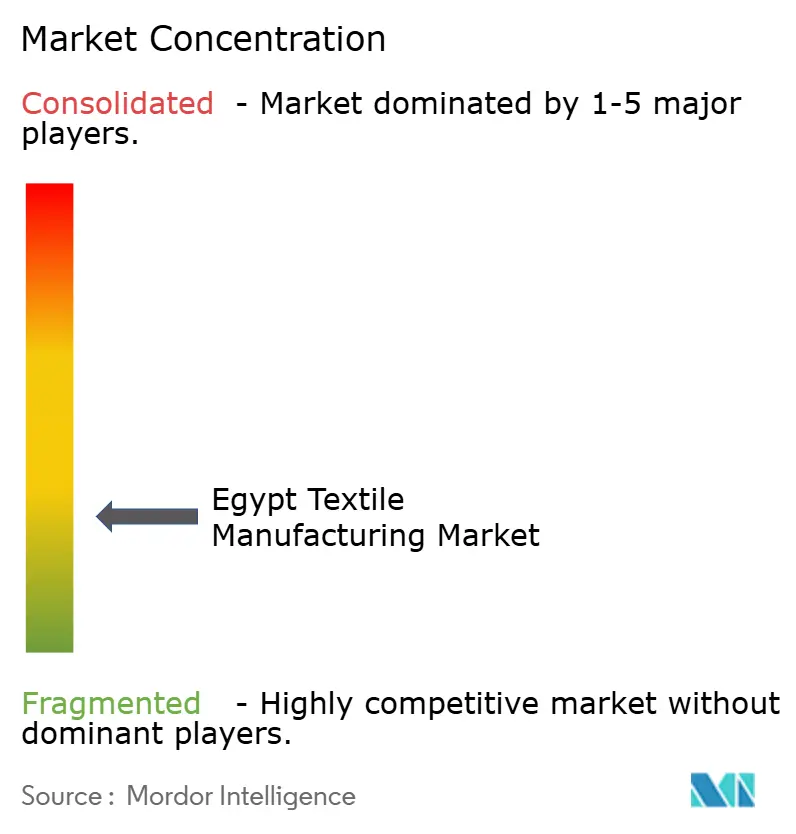
| Market Concentration | Low |
Major Players *Disclaimer: Major Players sorted in no particular order Image © Mordor Intelligence. Reuse requires attribution under CC BY 4.0. | |
Egypt Textile Manufacturing Market Analysis by Mordor Intelligence
The Egypt Textile Manufacturing Market size is estimated at USD 10.08 billion in 2026, and is expected to reach USD 12.34 billion by 2031, at a CAGR of 4.13% during the forecast period (2026-2031). A modernization budget of EGP 56 billion (USD 1.81 billion) and USD 490 million in fresh foreign direct investment across the Suez Canal Economic Zone (SCZone) are expanding integrated capacity and cutting lead times[1]Egypt opens USD 70 million Hengsheng plant, ecofinagency.com. Blockchain traceability for Giza cotton is preparing local mills for the 2026 EU Digital Product Passport rule, allowing them to win premium orders from European buyers. Removing a 10-piastre-per-kilowatt-hour power subsidy raised operating costs by 15-20%, yet rooftop solar rollouts and energy audits are cushioning the blow for large mills. Technical-textile exports - including medical, hygiene, and automotive fabrics - jumped 25% in 2025, giving producers a second growth engine beyond fashion and home goods.
Key Report Takeaways
- By application, fashion and apparel led with 56.26% of the Egyptian textile manufacturing industry market share in 2025, while industrial and technical textiles are expanding at a 6.12% CAGR through 2031.
- By raw material, synthetic fibers captured a 49.37% share of the Egyptian textile manufacturing industry market size in 2025, and polyester derivatives are advancing at a 6.47% CAGR through 2031.
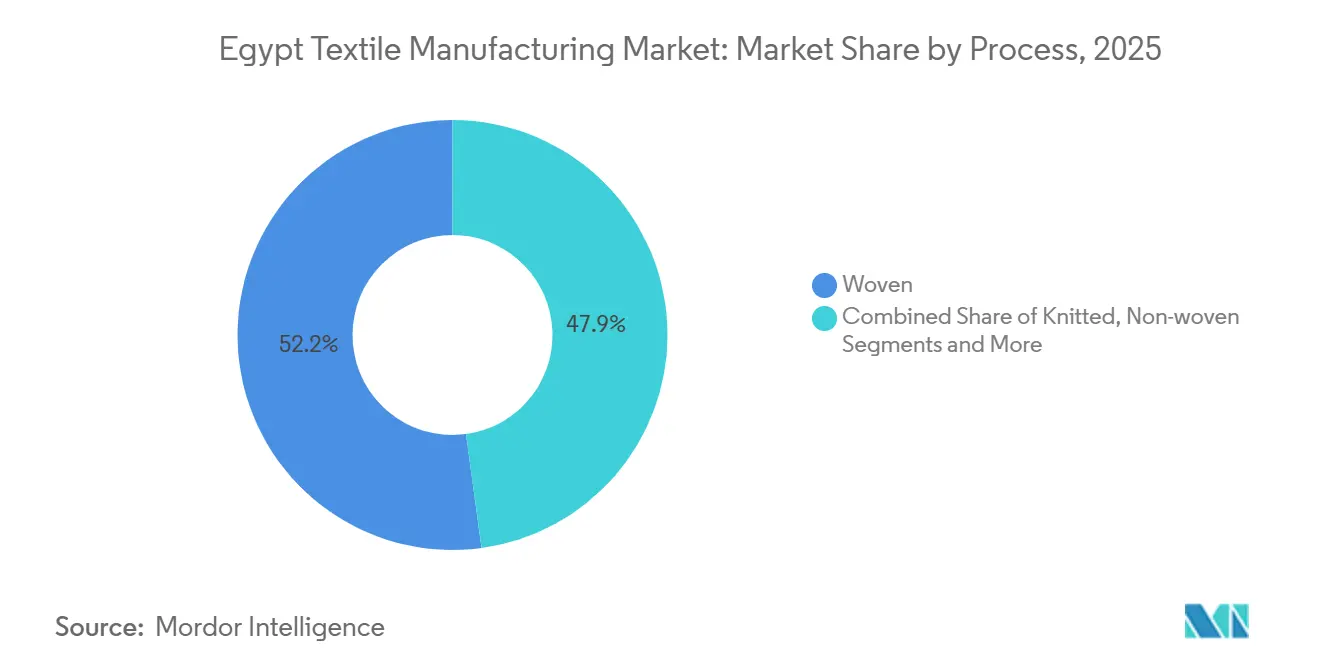
- By process, woven fabrics retained 52.15% of the Egyptian textile manufacturing industry market share in 2025, and non-woven lines are growing at a 5.95% CAGR to 2031.
- By geography, Greater Cairo contributed 38.17% of 2025 output, yet the Rest of Egypt, mainly Minya and Fayoum textile cities, is forecast to grow at a 5.73% CAGR through 2031.
Note: Market size and forecast figures in this report are generated using Mordor Intelligence’s proprietary estimation framework, updated with the latest available data and insights as of January 2026.
Egypt Textile Manufacturing Market Trends and Insights
Drivers Impact Analysis*
| Drivers | (~) % IMPACT ON CAGR FORECAST | Geographic Relevance | Impact Timeline |
|---|---|---|---|
| Egypt-UAE joint free zone in SCZone | +0.9% | National, concentrated in Suez Canal Economic Zone | Short term (≤ 2 years) |
| EU retail recovery boosting apparel exports | +0.7% | EU and Turkey re-export channels | Short term (≤ 2 years) |
| Egyptian Cotton Traceability Programme | +0.6% | Global, with gains in EU export corridors | Medium term (2-4 years) |
| AI-driven loom subsidies | +0.5% | Early adoption in Greater Cairo and Nile Delta | Medium term (2-4 years) |
| Desert-hardy coloured-cotton cultivars | +0.4% | Nile Delta and Upper Egypt reclaimed lands | Medium term (2-4 years) |
| Green-hydrogen indigo dyeing pilots | +0.3% | Pilot in Suez, scalable nationally | Long term (≥ 4 years) |
| Source: Mordor Intelligence | |||
Egypt-UAE Joint Free Zone in SCZone Accelerating FDI & Export Logistics
The SCZone waived machinery duties and granted 10-year tax holidays, attracting USD 490 million in textile FDI during 2024-2025. Zhejiang Hengsheng’s 20-hectare integrated line converts polyester chips into printed fabric in under 14 days, proving the time-to-market benefit. Turkish group Eroglu is leveraging the same zone to blend Egyptian labor costs with Turkish design capabilities. Concentrating spinning, weaving, and finishing inside bonded estates trims logistics costs by 18-22% relative to onshore plants. The upside is tempered by looming EU Carbon Border Adjustment Mechanism fees on high-emission polyester shipments.
EU Retail Recovery Lifting Egyptian Apparel Exports by 8% YoY
Ready-made garment exports reached USD 2.8 billion in the first ten months of 2025, with Europe absorbing USD 717 million, a 34% surge year-on-year. Egyptian cut-make-trim orders ship in 10-12 days versus 25-30 days from South Asia, allowing retailers to restock faster. Turkey re-exports 70% of Egyptian sportswear into the EU, multiplying volumes through its customs-union advantage. Sustained growth presumes steady EU consumer demand; any pullback would quickly squeeze Egyptian mills operating at 4-6% net profits. Diversifying into premium activewear and technical apparel is, therefore, essential for margin resilience.
Egyptian Cotton Traceability Programme Aligning with EU Digital Product Passport Rules
Blockchain tagging lets each bale of Giza cotton carry geolocation, ginning, and chemical-input data, matching EU disclosure mandates from 2026[2]Digital Link Standard,” gs1.org. EU brands facing sustainability litigation can trace feedstock through Egyptian mills, creating a premium channel that offsets Egypt’s 15-20% raw-cotton cost disadvantage. Phase 2 of the UNIDO Egyptian Cotton Project showed 70% water and 40% energy savings when mills substitute traceable regenerated cotton for virgin polyester. Smallholders in Gharbia and Dakahlia still farm only 35,000 hectares, so scaling to the 100,000-hectare target depends on seed distribution and agronomy training. If achieved, the driver could lift average unit prices by 8-10% in core EU shirting and home-textile segments.
National Advanced Industrial Technology Initiative Subsidies for AI-Driven Looms
Phase one of Egypt’s EGP 56 billion modernization program delivered Ghazl 4, a 62,000 m² mill operating 188,000 spindles with automated doffing that reduces labor requirements by 40% per ton. AI-enabled looms are being used to predict equipment failures and cut fabric waste by up to 10%. Rising wages, now around EGP 6,000 per month, are increasing the urgency for automation investments. The consolidation of 23 state-owned companies into nine integrated firms is intended to pool capital expenditure and technical expertise. The success of this transformation will depend on effective workforce retraining and the rollout of industrial internet infrastructure across legacy production plants.
Restraints Impact Analysis*
| Restraints | (~) % IMPACT ON CAGR FORECAST | Geographic Relevance | Impact Timeline |
|---|---|---|---|
| Energy-subsidy rationalization doubling mill power tariffs | -0.8% | National, with disproportionate impact on energy-intensive dyeing and finishing operations in Greater Cairo and Nile Delta | Short term (≤ 2 years) |
| Government irrigation-quota cuts in Nile Delta curbing cotton yields | -0.6% | Nile Delta (Gharbia, Dakahlia, Sharqia, Kafr El Sheikh), with secondary effects on Upper Egypt cotton zones | Medium term (2-4 years) |
| EU Carbon Border Adjustment Mechanism compliance costs on energy-intensive textiles | -0.5% | Global, affecting Egyptian exporters to EU markets; heaviest burden on polyester and synthetic-fiber producers | Medium term (2-4 years) |
| Mandatory micro-fibre filtration retrofits raising effluent-treatment CAPEX | -0.4% | National, with compliance concentrated in Nile Delta and Alexandria industrial zones subject to EEAA monitoring | Medium term (2-4 years) |
| Source: Mordor Intelligence | |||
Energy-Subsidy Rationalization Doubling Mill Power Tariffs
The end of the 10-piastre electricity discount in 2025 raised industrial tariffs to USD 0.12-0.14 per kilowatt-hour, inflating processing costs by up to 20%[3]Energy Tariff Reform Update,” investinegypt.gov.eg. Dyeing lines consume 800-1,200 kWh per ton, so added power spend reaches USD 120 per ton of fabric. Misr Spinning & Weaving expects EGP 150-200 million in extra annual charges at Ghazl 4, eroding margins. A government audit scheme offers partial subsidies for energy upgrades, but only 15% of mills signed up in its first year. Larger firms respond by installing rooftop solar; smaller mills shift toward greige fabric export to sidestep high-energy finishing.
EU Carbon Border Adjustment Mechanism Compliance Costs on Energy-Intensive Textiles
CBAM reporting starts in 2026, pricing embedded CO₂ at EUR 80-90 per ton. Polyester fabrication emits 6-8 tons CO₂ per ton of fiber, implying an 8-12% price haircut on EU entry unless mills cut emissions. Only three Egyptian exporters have begun ISO 14064 audits, leaving many exposed to penalties. Access to renewable power from Benban Solar Park and future green-hydrogen steam could slash emissions 40-50%. Shifting product mix toward cotton fabrics, which have lower carbon intensity, offers an immediate hedge.
*Our forecasts treat driver/restraint impacts as directional, not additive. The impact forecasts reflect baseline growth, mix effects, and variable interactions.
Segment Analysis
By Application: Technical Textiles Outpace Fashion Amid Diversification Push
Technical and industrial categories are expanding at a 6.12% CAGR, overtaking the broader Egyptian textile manufacturing industry market growth as foreign buyers seek medical gowns, hygiene wraps, and automotive felts[4]INVEST IN EGYPT, Integrated Textile Cities Initiative, investinegypt.gov.eg. Fashion and apparel remain the revenue leader, yet labor-cost inflation and sustainability audits push exporters toward higher-margin activewear and modest fashion niches. EU demand for lightweight automotive fabrics cuts vehicle weight 5-8%, creating a pull for polypropylene non-wovens. International Trade Centre research pegs accessible medical-textile demand at USD 18.6 billion, a sizeable runway for domestic converters. Government consolidation of 23 firms into nine entities channels capital into application-specific upgrades.
Mills entering technical niches secure longer contracts and face fewer style-change disruptions, stabilizing utilization at 85-90%. Development of ISO 13485 testing labs, backed by Swiss funding, removes a market-entry barrier for surgical-textile suppliers. Automotive felt production benefits from Egypt’s USD 1.2 trillion infrastructure plan, which raises geotextile needs. Household textiles, propelled by Oriental Weavers’ carpet lines, continue to grow near the overall Egyptian textile manufacturing industry market rate, underscoring the enduring appeal of home-décor segments. Protective sports textiles ride Egypt’s position as the twelfth-largest sportswear exporter, leveraging Turkey’s re-export corridors into Germany and Poland.




By Raw Material: Polyester Gains Share as FDI Targets Synthetic Integration
Synthetic fibers held 49.37% of 2025 revenue and are scaling faster than cotton, thanks to integrated polyester investments in SCZone that trim lead times to under two weeks. Polyester enjoys cost advantages at USD 1.30 per kilogram versus USD 2.00-plus for Giza cotton. Cotton’s share is limited by irrigation constraints, although blockchain-enabled traceability increases its premium potential within the Egyptian textile manufacturing industry market size context. Recycled fibers are emerging on the back of 212,000 tons of yearly pre-consumer waste, with a Kafr El Dawar plant converting 30,000 tons into export-grade yarn.
Expanding virgin polyester capacity collides with CBAM carbon pricing; without renewable energy offsets, exporters face an 8-12% duty. Recycled polyester fiber offers a compliance workaround, saving 40% energy and capturing circular-economy premiums. Specialty fibers such as aramid and carbon remain under 1% share due to high capex and limited local demand. Wool and silk retain small but profitable niches in luxury home textiles. The synthetic-heavy trajectory keeps Egypt aligned with global sportswear growth while underlining the need for emissions-mitigation investments.
By Process: Non-Woven Technologies Gain Traction in Technical Segments
Woven fabrics still represent 52.15% of 2025 output, but non-wovens are accelerating at 5.95% yearly, mirroring technical-textile momentum. A Kafr El Dawar facility transforms textile waste into needle-punched felt for automotive interiors, tapping demand for sound-dampening materials in regional vehicle assembly. Spunbond polypropylene capacity supports surgical-drape production, yet domestic supply meets only 15% of needs, leaving room for greenfield lines. Knitted fabrics, focused on activewear, face price pressure from Turkey yet benefit from Egypt’s QIZ duty-free access to the United States.
The Egyptian textile manufacturing industry is upgrading from shuttle to air-jet looms under the EGP 56 billion program, raising productivity 30-40%. Hydro-entangled non-wovens using recycled fibers meet EU Ecolabel thresholds, fetching 20-25% price premiums. 3D weaving remains niche due to equipment costs topping USD 500,000 per loom. Needle-punched geotextiles align with Egypt’s road expansion, where 15,000-20,000 tons of annual demand is forecast. Investment in IT infrastructure allows predictive-maintenance software to lift loom uptime to 95%, a key metric for contract stability.
Geography Analysis
Greater Cairo contributed 38.17% of 2025 production, leveraging adjacency to two international ports that handle 56% of textile exports. The cluster’s skilled workforce and supplier networks keep utilization high, but land prices of USD 150-200 per square meter and congestion push new projects outward. The rest of Egypt, covering Minya and Fayoum textile cities, benefits from EGP 3.5 billion in decentralization incentives that reduce logistics costs by 15-20% and grant 10-year tax holidays. These cities integrate ginning, spinning, and finishing on 500-hectare footprints, anchoring future growth at a projected 5.73% CAGR.
The Nile Delta remains the historical heartland with Misr Spinning & Weaving’s Ghazl 4 in El Mahalla and recycling complexes in Kafr El Dawar. Delta mills face water-quota cuts that shrink cotton feedstock, compelling greater synthetic use. Alexandria serves as a synthetic-fiber hub, with SPINALEX expanding circular-knitting lines after a capital increase to EGP 721 million. Rising power tariffs hit Alexandria dye houses hard, though rooftop solar projects offset 20-25% of electricity bills.
Upper Egypt’s reclaimed lands open new cotton acreage, yet saline soils limit yields to 1.5 tons per hectare. Linking these fields with nearby Minya mills could secure premium traceable cotton for export shirting. The Suez Canal Economic Zone straddles Ismailia, Port Said, and Suez; its bonded status and zero-duty machinery imports attracted USD 490 million of FDI in two years. Polyester-integrated entrants there challenge Cairo’s dominance by hitting 10-12-day order cycles for EU buyers needing speed-to-market. Overall, geographic diversification is diluting Cairo’s share while preserving national supply-chain resilience.
Regulatory Landscape
Egyptian textile manufacturing is shaped by import and quality-compliance controls led by the General Organisation for Export and Import Control (GOEIC). Market access for regulated textile and apparel consignments is enforced through the Verification of Conformity (VOC) program under Ministerial Decrees 961/2012, 991/2015, and 403/2022, alongside mandatory Egyptian Standards issued by the Egyptian Organization for Standardization and Quality (EOS) that drive testing and certification (for example, composition and colorfastness checks) via Certificates of Inspection and lab reports.
Trade and documentation compliance has tightened through digitization and risk controls. Since January 2026, importers must file Advanced Cargo Information Declaration (ACID) through the CargoX platform, with a 19-digit ACID number required on shipping documents. This raises the importance of accurate pre-shipment documentation and supplier registration. At the policy level, the government has elevated textiles and ready-made garments within the National Industrial Strategy 2026-2030, targeting USD 100 billion in non-oil exports, and reinforcing programs that deepen local manufacturing while reducing intermediate-goods imports.
Value Chain Analysis
Egypts textile value chain runs from fiber supply (cotton and flax cultivation) through ginning, spinning, weaving/knitting, dyeing and finishing, and onward to ready-made garments and export distribution. State-led modernization and zone-based FDI are pushing a seed-to-shelf structure that reduces reliance on imported yarns and fabrics, while also shortening lead times by concentrating multiple steps in single estates. Key ecosystem actors include the Ministry of Industry and Transport, the Ministry of Public Business Sector, the Federation of Egyptian Industries and its relevant chambers, and export bodies such as the Ready-Made Garments Export Council.
New integrated industrial footprints are changing upstream and midstream linkages. In April 2025, the government launched two integrated textile cities in Minya and Fayoum spanning 11 million sqm. In January 2026, Elsewedy Industrial Development and Crystal International Group signed a USD 350 million agreement to establish an integrated spinning and textile complex in New October City on an 800,000 sqm site under the private free zones system. In May 2026, the Ministry of Investment and Foreign Trade announced plans for a USD 1.5-2 billion carbon-neutral textile industrial city in Port Said with China Enterprise Cloud Chain across 4.5 million sqm, underscoring the shift toward clustered utilities, logistics, and compliance-ready infrastructure for exporters.
Competitive Landscape
The Egyptian textile manufacturing industry market remains fragmented, with state-owned companies controlling roughly 40-45% of spinning and weaving capacity. Consolidation targets nine integrated entities by 2026, yet only two, Ghazl 4 and Ghazl 1, are fully operational so far. Private players such as Arafa Holding and Nile Linen Group specialize in apparel and home textiles, respectively, while Chinese and Turkish entrants in SCZone compress polyester-to-fabric cycles, challenging incumbents on speed and cost.
Technology segmentation splits the field. State plants deploy AI-driven looms and automated doffing, cutting labor 40% per ton of yarn; many private mills still run 20-year-old machines at 60-70% efficiency. Compliance with Ministerial Decree 44/2000 on effluent limits creates a two-tier market: mills that invest in nano-filtration earn 5-8% price premiums from EU buyers demanding audits. Oriental Weavers leads on sustainability, installing a 50-megawatt rooftop solar array that trims electricity bills by one-quarter and aligns with CBAM metrics.
Strategic moves illustrate competitive intensity. Zhejiang Hengsheng’s USD 70 million West Qantara plant aims for USD 300 million annual revenue through vertically integrated polyester lines. Kafr El Dawar’s recycling projects monetize waste, turning compliance costs into export revenues. Eroglu’s USD 120 million venture taps QIZ duty-free access to the United States, combining Turkish design with Egyptian manufacturing. Market concentration is expected to rise modestly as consolidation and FDI favor larger, capital-efficient players.
Egypt Textile Manufacturing Industry Leaders
Cotton & Textile Industries Holding Co.
Misr Spinning & Weaving (El Mahalla)
Oriental Weavers
Arafa Holding
Alexandria Spinning & Weaving (SPINALEX)
- *Disclaimer: Major Players sorted in no particular order

Market Opportunities and Future Outlook
Near-term whitespace is concentrated in integrated capacity that displaces imported intermediate goods (yarn, greige fabric, and finished fabric) and improves compliance readiness for export corridors. The governments Industrial Development Strategy 2030 lists textiles and ready-made garments among seven priority industries tied to the USD 100 billion industrial exports ambition, and 2026 actions have centered on execution roadmaps and private-sector partnerships to accelerate asset utilization in state and zone-based projects. Investment announcements also point to continued buildout of fabric-making capacity closer to ports and free zones, including the January 2026 USD 350 million New October City integrated complex (Elsewedy Industrial Development and Crystal International Group).
Sustainability-linked infrastructure and a higher-value product mix represent the clearest opportunity areas. EU-facing exporters are aligning with carbon and traceability requirements while expanding technical capabilities, and the May 2026 plan for a USD 1.5-2 billion carbon-free textile industrial city in Port Said targets lower-emissions production infrastructure. Paradise Textiles also announced a USD 102 million integrated fabric facility in the Alexandria Amreya Public Free Zone, with operations scheduled for Q3 2026, which increases local conversion capacity. On the demand side, garment exports reached USD 1.15 billion in the first four months of 2026 (up 15% year-on-year), supporting further investment in faster-turn, vertically integrated supply chains that can meet audit, documentation, and delivery requirements for EU and US buyers.
Recent Industry Developments
- July 2026: The Ministry of Industry toured Misr Spinning and Weaving Co.s El Mahalla El Kubra complex (about 2.5 million square meters) to review modernization progress tied to investments cited at EGP 27 billion. The visit reinforced the states emphasis on scaling upgraded spinning and weaving capacity and improving utilization of newly built assets.
- May 2026: The government initiated evaluations for the temporary listing of Cotton & Textile Industries Holding Co. subsidiaries, including Egyptian Cotton Hub and Misr for Trading & Ginning Cotton Co, on the Egyptian Exchange. This move supports financing and governance pathways for state-linked textile and cotton-trading assets that sit upstream of yarn and fabric manufacturing.
- May 2025: Oriental Weavers launched a new polyester yarn dyeing unit at its 10th of Ramadan City facility with an investment of EGP 50 million and daily capacity of 4.75 tons. The added dyeing capability strengthens in-country value addition for synthetic-based home-textile inputs amid rising scrutiny on lead times and specifications.


Research Methodology Framework and Report Scope
Market Definition and Coverage
For this study, the market is defined as the value of textile manufacturing activity in Egypt, covering conversion from fibers to yarn, fabrics, and finished textile products, across key industrial processes and installed machinery used to produce them.
Scope exclusions: This sizing does not count retail apparel sales margins or downstream brand and distribution markups outside factory gate values.
Segmentation Overview
- By Application
- Fashion & Apparel
- Industrial/Technical Textiles
- Household & Home Textiles
- Medical & Healthcare Textiles
- Automotive & Transport Textiles
- Others (Protective, Sports Textiles, etc.)
- By Raw Material
- Natural Fibers
- Cotton
- Wool
- Silk
- Synthetic Fibers
- Polyester
- Nylon
- Rayon / Viscose
- Acrylic
- Polypropylene
- Recycled Fibers
- Others (Speciality High-Performance Fibers (Aramid, Carbon, UHMWPE))
- Natural Fibers
- By Process / Technology
- Woven
- Knitted
- Non-woven
- Spunlaid (Spunbond / Melt-blown)
- Dry-laid Hydro-entangled
- Wet-Laid
- Needle-punched
- 3-D Weaving & Spacer Fabrics
- By Geography
- Greater Cairo (Cairo & Giza)
- Nile Delta (incl. Gharbia/El Mahalla El Kubra, Kafr El Dawar, Sharqia, Dakahlia)
- Alexandria
- Rest of Egypt
Data Sources, Market Sizing, and Validation
Desk Research
Desk research is used to set the factual base for the model, so the numbers are tied to Egypt specific production and trade signals rather than broad global averages. We reviewed public statistics and policy releases that describe the operating backdrop for manufacturers, along with reference series that help convert activity into value.
Sources typically used include official trade and industry data such as CAPMAS releases, UN Comtrade trade tables, World Bank and IMF macro series, and trade association or chamber updates linked to textiles and apparel. We also cross-checked annual reports and investor presentations of listed manufacturers, reputed press coverage of capacity additions, and patent databases to understand process changes that can shift output mix and yields. For select checks, subscriptions that aggregate company financials, news, and shipment level trade records were used to speed up validation of export and import flows. These examples are not exhaustive, and many other public sources were also used for data collection, validation, and clarification.
Primary Interviews and Surveys
Primary work was done through expert interviews and structured surveys with manufacturers, machinery distributors and service providers, sourcing managers, and industry bodies that track demand and compliance needs. Since this is a single country market, we focused on respondents with coverage across major industrial clusters and export channels, so the assumptions on utilization, product mix, and pricing could be challenged and corrected.
Distribution of primary research fieldwork respondents
| Company type | Respondent position |
|---|---|
| Top tier: 27% | CXOs: 17% |
| Mid tier: 53% | Functional/Unit leaders: 38% |
| Smaller Players: 20% | Managers: 45% |
Market-Sizing & Forecasting
Sizing starts with a top-down build that reconstructs the Egypt textile manufacturing value pool from observable production and trade patterns, and then links that pool to realistic conversion steps across fibers, yarn, fabrics, and garments. To keep the totals grounded, we corroborated them with selective bottom-up checks, such as sampled capacity and utilization by process line, exporter shipment cadence, and indicative price bands by product category.
Key inputs used in the model include textile and apparel export values, import levels for key intermediate goods, installed machinery additions and replacements, plant utilization ranges by process type, and shifts in product mix between basic and higher value output. We also used macro indicators that typically move textile demand and investment timing, such as industrial output growth, FX movement that affects imported inputs, and policy led incentives for manufacturing and exports. When company level data was incomplete, gaps were handled by using peer averages by process and by applying conservative utilization and price assumptions validated through interviews.
Forecasts were built using scenario analysis, where demand and supply side drivers are projected under a base case, and then stress-tested for changes in export order strength, input cost pass-through, and capacity ramp-up timing. Expert feedback was used to keep forward assumptions practical, particularly on achievable utilization, lead times, and selling price progression in USD terms.
Data Validation & Update Cycle
Model outputs are checked against independent signals like export momentum, machinery import trends, and reported capacity announcements to see if the implied production value looks realistic. Variances are reviewed in steps, first at segment level and then at total market level, followed by an internal analyst review before sign-off.
If an outlier is found, we re-check the underlying drivers and re-contact select respondents when the gap cannot be explained by public data alone. Reports are refreshed annually, and interim updates are made when material events occur, such as major policy changes, large capacity starts, or sharp currency moves. Before delivery, a final pass is completed so clients receive the latest updated view.
Mordor Intelligence's Egypt Textile Manufacturing Industry Study Market Estimate Compared With Other Published Estimates
Published market sizes for Egypt textile manufacturing do not always match because different studies pick different start points for what counts as the market, and they also use different years, exchange-rate timing, and pricing logic. Some estimates lean more on high level sector revenue assumptions, and others lean more on trade values, so the totals can spread even when the topic name looks similar.
A common split comes from mixing factory output with downstream textiles and apparel selling value, and also from how much of imports, re-exports, and informal production are assumed to be inside the model. Some external figures anchor on a single base year and then extend CAGR forward without re-checking utilization and mix shifts. Some estimates also fold in broader textiles and apparel market value that includes distribution markups. For Mordor Intelligence, only factory-gate manufacturing value in Egypt is counted, and the totals are constrained using process-level capacity and export-led demand checks so retail and brand margins are not included.
Benchmark comparison
| Source | Market Size | Gaps in Research Methodology |
|---|---|---|
| Mordor Intelligence | USD 10.08 B (2026) | |
| Global Consultancy A | USD 4.32 B (2024) | Uses an earlier base year and a narrower value pool that appears to under-count intermediate manufacturing activity across yarn and fabric conversion, which keeps the total lower even before forecast growth is applied. |
| Trade Journal B | USD 3.87 B (2024) | Often treated as a broader textiles coverage that can follow trade and sector commentary more than process-level manufacturing build-ups, and it may rely on simplified price progression that does not fully adjust for product mix and FX timing. |
The spread mainly comes from year choice and what is counted as manufacturing value versus wider textiles related value. By keeping inputs traceable to exports, capacity utilization, and product mix, the approach gives a practical total that can be repeated and re-checked as new signals come in.


Key Questions Answered in the Report
How large is the Egyptian textile manufacturing industry market in 2026?
It is valued at USD 10.08 billion and is forecast to reach USD 12.34 billion by 2031.
Which segment is growing fastest within the Egyptian textile manufacturing industry market?
Industrial and technical textiles are expanding at a 6.12% CAGR through 2031.
What share do synthetic fibers hold in the Egyptian textile manufacturing industry market?
Synthetic fibers accounted for 49.37% of 2025 revenue, led by polyester lines in the Suez Canal Economic Zone.
How are power-tariff reforms affecting producers?
Removing a 10-piastre subsidy lifted electricity costs 15-20%, prompting mills to install rooftop solar or shift to less energy-intensive processes.
What role does the Suez Canal Economic Zone play?
Its bonded free zones attracted USD 490 million in FDI for vertically integrated polyester-to-fabric projects that cut lead times to under 14 days.
How is Egypt addressing EU carbon rules?
Exporters are adopting renewable energy, recycled fibers, and blockchain traceability to reduce embedded emissions and meet CBAM requirements.
Page last updated on:


 Your data is secure and never sold or shared.


