Drone Sensor Market Size and Share
Market Overview
| Study Period | 2020 - 2031 |
|---|---|
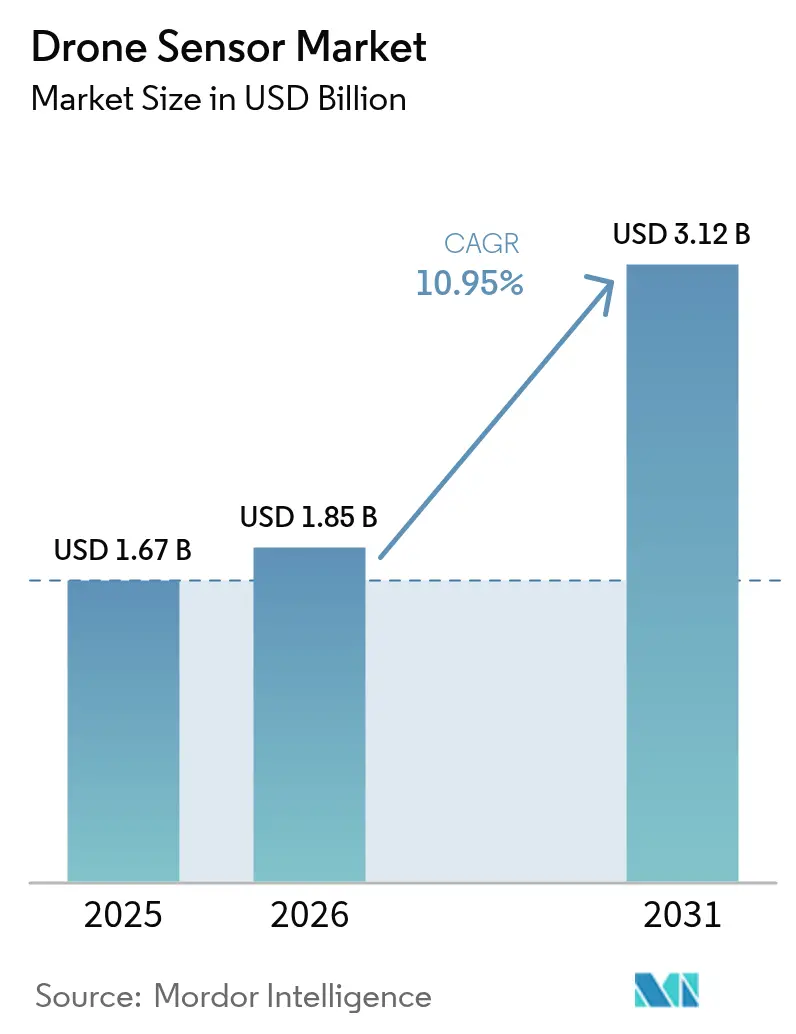
| Market Size (2026) | USD 1.85 Billion |
| Market Size (2031) | USD 3.12 Billion |
| Growth Rate (2026 - 2031) | 10.95% CAGR |
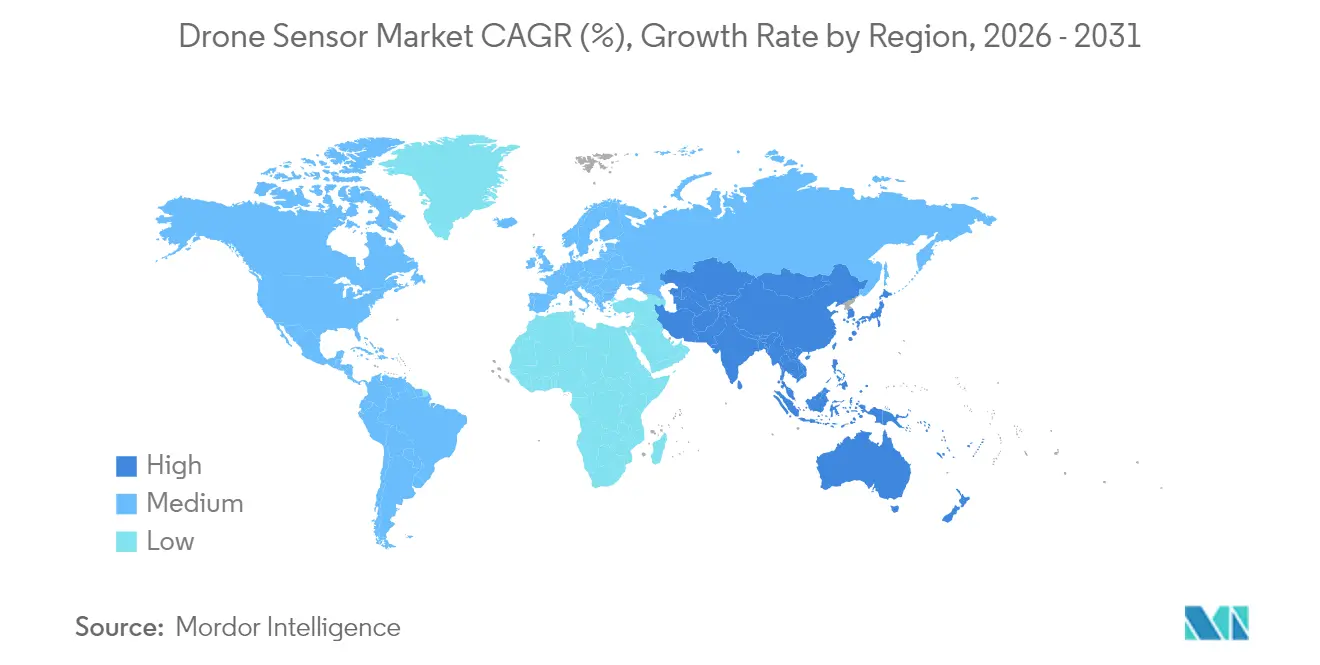
| Fastest Growing Market | Asia Pacific |
| Largest Market | North America |
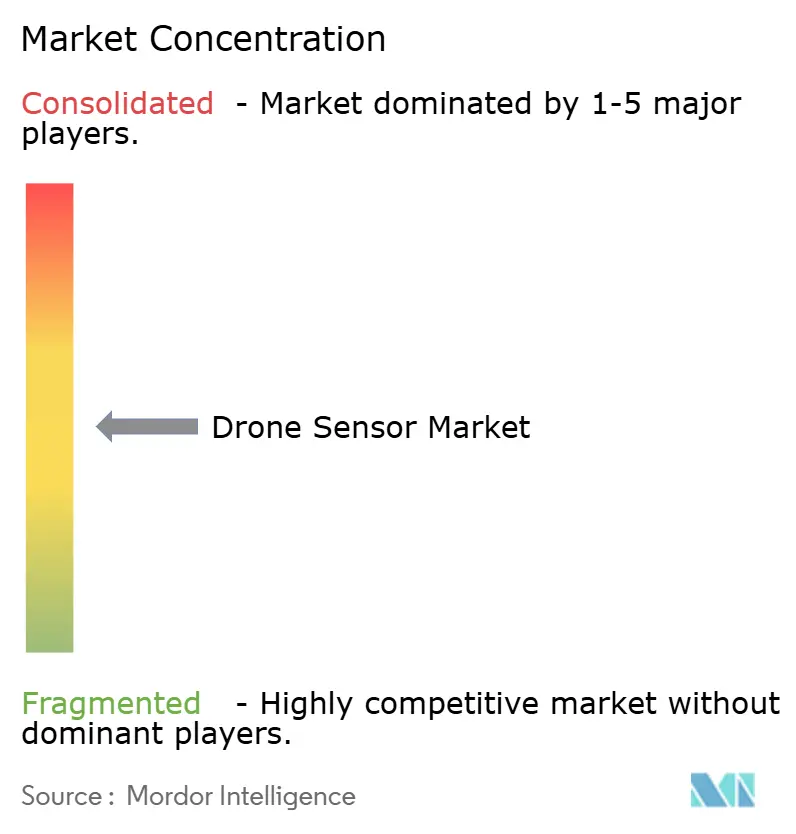
| Market Concentration | Medium |
Major Players *Disclaimer: Major Players sorted in no particular order Image © Mordor Intelligence. Reuse requires attribution under CC BY 4.0. | |
Drone Sensor Market Analysis by Mordor Intelligence
The drone sensor market size is expected to grow from USD 1.67 billion in 2025 to USD 1.85 billion in 2026 and is forecast to reach USD 3.12 billion by 2031 at 10.95% CAGR over 2026-2031. Near-term demand was propelled by mandatory Remote ID adoption, precision agriculture requirements, and continuous platform miniaturization that improved size, weight, and power (SWaP) metrics.[1]Source: Federal Aviation Administration, “Remote Identification of Unmanned Aircraft,” faa.gov Defense allocations and commercial investment in autonomous flight continued to anchor procurement budgets. Regulatory clarity around BVLOS operations supported uptake, while multispectral imaging expanded farm-level analytics, lifting sensors from optional payloads to essential avionics. Vendors responded by embedding edge-AI co-processors that processed data onboard, trimming latency and bandwidth needs. Consolidation among MEMS suppliers, coupled with emerging LiDAR specialists, signaled a shift toward vertically integrated, sensor-fusion-ready modules.
Key Report Takeaways
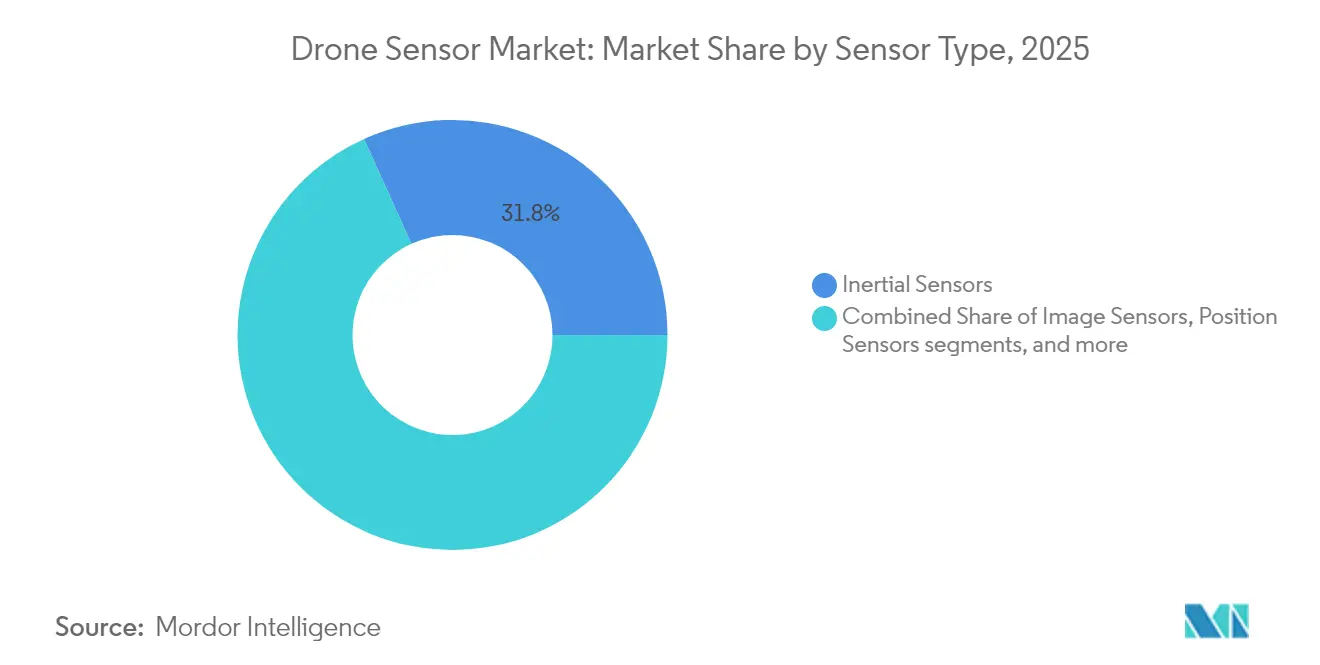
- By sensor type, inertial sensors led the drone sensor market with 31.75% of the share in 2025, while LiDAR sensors are projected to grow at a 12.35% CAGR through 2031.
- By platform type, VTOL configurations accounted for 57.90% of the drone sensor market share in 2025, and hybrid platforms are expected to expand at a 13.85% CAGR to 2031.
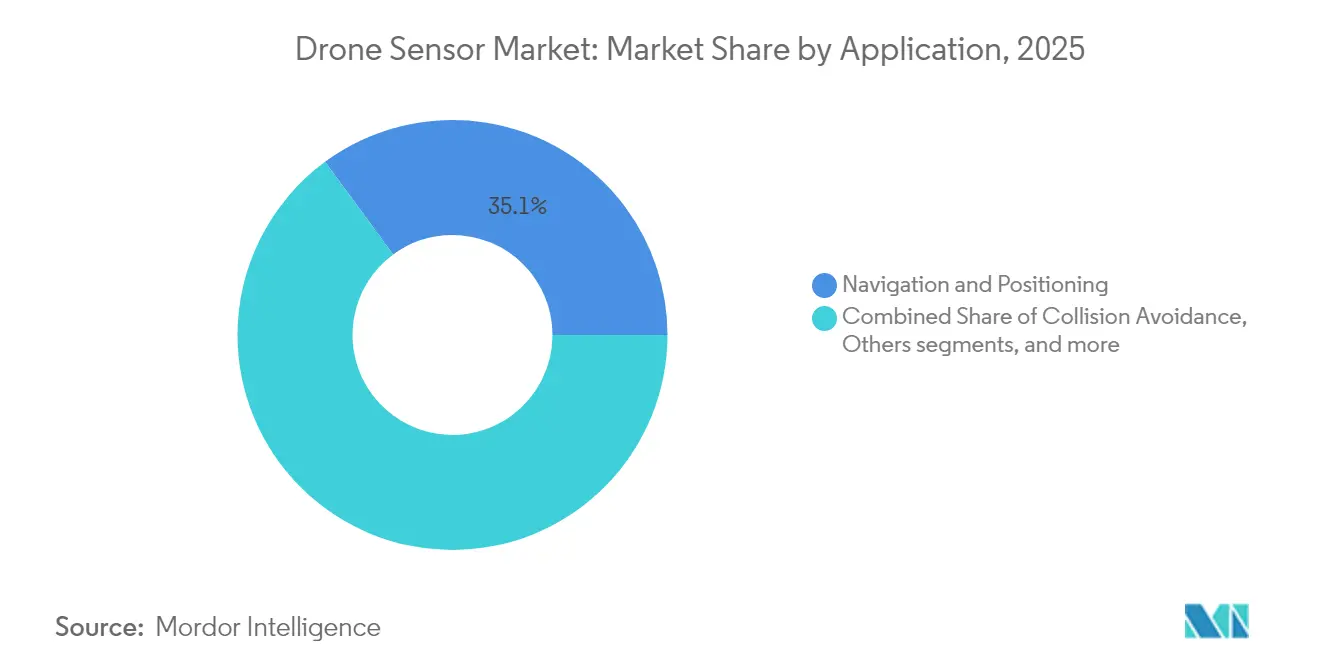
- By application, navigation systems held 35.10% of the drone sensor market size in 2025, whereas collision avoidance solutions are advancing at a 12.95% CAGR over the forecast horizon.
- By end-user industry, defense and security captured 30.95% of the drone sensor market share in 2025, while logistics and warehousing are projected to rise at a 13.60% CAGR through 2031.
- By geography, North America commanded 37.25% of the drone sensor market share in 2025, and Asia-Pacific is forecasted to post a 11.75% CAGR through 2031.
Note: Market size and forecast figures in this report are generated using Mordor Intelligence’s proprietary estimation framework, updated with the latest available data and insights as of 2026.
Global Drone Sensor Market Trends and Insights
Drivers Impact Analysis*
| Driver | (~) % Impact on CAGR Forecast | Geographic Relevance | Impact Timeline |
|---|---|---|---|
| Rising autonomy-ready sensor-fusion demand | +2.8% | North America, Europe | Medium term (2-4 years) |
| Rapid miniaturisation and SWaP optimisation | +2.1% | Asia-Pacific manufacturing hubs | Short term (≤ 2 years) |
| Mandatory Remote-ID compliance deadlines | +1.9% | North America, Europe | Short term (≤ 2 years) |
| Precision-agriculture push for multispectral sensing | +1.7% | Global farming regions | Medium term (2-4 years) |
| Energy-efficient edge-AI co-processor integration | +1.4% | North America, Asia-Pacific | Long term (≥ 4 years) |
| Commercial roll-out of mm-wave imaging radar | +1.2% | North America, Europe | Medium term (2-4 years) |
| Source: Mordor Intelligence | |||
Rising Autonomy-Ready Sensor-Fusion Demand
Autonomous flight requires coordinated input from inertial, visual, and ranging sensors to maintain accuracy in GPS-denied spaces. Multi-sensor fusion cuts navigation error rates by up to 67% relative to single-sensor baselines, improving BVLOS reliability.[2]Source: Nicolae Niculescu, “Multi-Sensor Navigation in GPS-Denied Environments,” mdpi.com Drone makers, therefore, favored pre-validated sensor suites that bundled IMUs, cameras, and LiDAR to shorten development cycles. Commercial operators also adopted redundancy strategies that met civil aviation safety expectations, reinforcing premium demand for fusion-ready modules.
Rapid Miniaturisation and SWaP Optimisation
MEMS IMUs reached tactical-grade performance inside 3 mm × 3 mm packages, enabling integration into nano-drones under 10 g. Advanced packaging, including 3D chip stacking, reduced component counts, and power draw. The resulting 10-fold efficiency gains prolonged flight endurance without increasing battery mass. Manufacturers incorporated novel heat-dissipation materials to offset thermal density, preserving sensor accuracy in compact frames, supporting advancements in the drone sensor market.
Mandatory Remote-ID Compliance Deadlines
The United States enforced Remote ID broadcasting from 2024, affecting more than 865,000 registered drones and spurring immediate retrofits or replacement purchases. Compliance modules transmitted identification, position, and emergency status, adding USD 50–300 per platform. Parallel rule-making in Europe signaled wider adoption, anchoring a multiyear replacement cycle for legacy fleets.[3]Source: Federal Aviation Administration, “Remote ID Final Rule,” federalregister.gov
Precision-Agriculture Push for Multispectral Sensing
Multispectral cameras provided 6 cm ground resolution from 1.5 km altitude, allowing farmers to calculate vegetation indices such as NDVI in real time. Field trials reported fertilizer and pesticide savings of up to 30%, lifting return on investment for sensor-equipped UAVs. Integration with onboard AI processors delivered in-flight analytics, speeding responses to crop stress events, driving growth in the drone sensor market.
Restraints Impact Analysis*
| Restraint | (~) % Impact on CAGR Forecast | Geographic Relevance | Impact Timeline |
|---|---|---|---|
| High thermal drift in MEMS IMUs | -1.8% | Global | Short term (≤ 2 years) |
| Rare-earth magnetics supply bottlenecks | -1.5% | North America, Europe | Medium term (2-4 years) |
| Spectrum-sharing regulations for 60 GHz radar | -1.2% | North America, Europe | Medium term (2-4 years) |
| Short life-cycles due to interface obsolescence | -0.9% | Global | Long term (≥ 4 years) |
| Source: Mordor Intelligence | |||
High Thermal Drift in MEMS IMUs
Temperature swings pushed drift coefficients to 7 µg/°C in standard accelerometers, forcing complex compensation that raised system cost and power draw. Dual closed-loop control and on-chip heaters improved stability but added weight and design overhead. Long-duration missions remained sensitive to cumulative bias errors, limiting MEMS adoption in high-precision surveying, posing a challenge to the drone sensor market.
Rare-Earth Magnetics Supply Bottlenecks
Sensors that relied on high-performance magnets faced risk from China’s 80% share of global rare-earth processing capacity. Export restrictions on gallium and germanium threatened availability for motor and actuator assemblies. Defense programs pursuing NDAA compliance accelerated domestic sourcing initiatives, increasing costs during transition, impacting the drone sensor market.
*Our forecasts treat driver/restraint impacts as directional, not additive. The impact forecasts reflect baseline growth, mix effects, and variable interactions.
Segment Analysis
By Sensor Type: Inertial Sensors Lead Despite LiDAR Acceleration
In 2025, inertial sensors accounted for 31.75% of the drone sensor market share, owing to their indispensable role in stabilization and navigation across every airframe. Advanced IMUs incorporated bias correction and thermal calibration, sustaining reliability in variable climates. Despite price compression, the segment maintained steady value because each new platform still required multiple inertial nodes. LiDAR units trailed in volume but posted a 12.35% CAGR, reflecting adoption in 3D mapping, obstacle avoidance, and terrain-following tasks.
Accuracy improvements and falling component prices widened LiDAR’s addressable market into mid-tier commercial fleets. Single-photon and flash architectures offered centimeter-level resolution at longer ranges, making them viable for corridor inspection and high-density urban missions. Image sensors served aerial photography and security surveillance. In contrast, barometric pressure sensors provided redundancy for altitude hold functions. Emerging gas-analysis payloads entered environmental monitoring niches, though their contribution to the drone sensor market remained small.


By Platform Type: VTOL Dominance Challenged by Hybrid Innovation
VTOL designs held 57.90% of 2025 revenue, reflecting immediate take-off capability and hover stability that simplified sensor alignment and payload swapping. Multi-rotor airframes also support precise waypoint missions essential for infrastructure inspection and cinematic work. Fixed-wing aircraft retained relevance for long-range mapping where endurance trumped agility, but their share plateaued as urban use cases multiplied, shaping trends in the drone sensor market.
Hybrid tilt-rotor concepts recorded a 13.85% CAGR by combining VTOL convenience with aerodynamic cruise efficiency. These platforms presented complex hand-off regimes between rotors and wings, demanding sophisticated flight-control sensors. Vendors embedded redundant IMUs, magnetometers, and high-rate barometers to manage transition phases. Sensor makers, therefore, positioned integrated packages calibrated for dynamic mounting orientations.
By Application: Navigation Leads While Collision Avoidance Accelerates
Navigation systems represented 35.10% of 2025 spending, as every autonomous platform required robust position and attitude information. Sensor fusion engines combined GNSS, inertial, and optical flow data to maintain centimeter-level accuracy in urban canyons. Growth in regulatory approvals for BVLOS cargo flights reinforced demand for high-integrity navigation stacks inside the drone sensor market.
Collision avoidance, while smaller, expanded at 12.95% CAGR on the back of safety mandates that obliged real-time obstacle detection. Compact LiDAR, stereo cameras, and mm-wave radar converged into lightweight pods that detect obstacles within 25 m during 20 m/s transit. Mapping and surveying continued to exploit high-resolution optical and LiDAR combinations for digital-twin generation. Environmental monitoring adopted particulate and gas sensors for wildfire and air-quality surveillance, diversifying revenue channels in the drone sensor market.
By End-User Industry: Defense Leadership Faces Logistics Challenge
Defense and security commanded a 30.95% share in 2025, leveraging protected budgets and mission-critical performance needs that justified premium sensor packages. Military requirements for GPS-denied navigation and hardened electronics created high barriers to entry, favoring suppliers with ITAR and NDAA credentials. Systems such as Ouster’s OS1 passed Blue UAS vetting, unlocking production contracts.
Logistics and warehousing exhibited the fastest expansion at 13.60% CAGR, driven by e-commerce providers trialing autonomous stock counts and last-mile deliveries. Material-handling drones demanded accurate indoor positioning using LiDAR and optical flow rather than GNSS, opening opportunities for specialized sensor vendors. Agriculture and forestry sustained the uptake of multispectral imaging for yield optimization, while energy utilities applied thermal sensors for remote line inspections.
Geography Analysis
North America generated 37.25% of 2025 revenue, reflecting early regulatory clarity and strong defense procurement. The Federal Aviation Administration’s rule-making provided certainty that guided investment in Remote ID-ready avionics. The United States also prioritized domestic sourcing, encouraging MEMS foundries in Arizona and Texas to scale sensor production under secure-supply programs, strengthening the drone sensor market.
Europe registered steady adoption as EASA progressed toward harmonized BVLOS standards. Germany and France deployed drones for renewable-energy inspections, while the United Kingdom focused on maritime border surveillance. Platform makers leveraged regional LiDAR specialists to meet GDPR and cybersecurity requirements for data handling.
Asia-Pacific outpaced all regions with a 11.75% CAGR, supported by China’s manufacturing ecosystem and rising enterprise use in Japan, South Korea, and India. Chinese OEMs shipped high-volume, low-cost sensor sets, but geopolitical tensions accelerated diversification into Southeast Asia and Australia. India’s agri-drone subsidies further widened adoption, with domestic startups pairing multispectral cameras and AI chips to boost crop yields. Emerging markets in South America and Africa remained nascent but demonstrated high potential for infrastructure monitoring once regulatory paths mature.

Competitive Landscape
The drone sensor market displayed moderate concentration with established MEMS giants and specialized newcomers sharing growth. Bosch Sensortec, Sony Semiconductor Solutions, and InvenSense capitalized on automotive and consumer volumes to fund aerospace-grade iterations. Niche players like Ouster and LeddarTech targeted high-resolution LiDAR, while Trimble leveraged GNSS heritage to deliver integrated positioning modules.
Mergers and acquisitions accelerated capability expansion. VIAVI Solutions completed a USD 150 million purchase of Inertial Labs, adding navigation and LiDAR payloads for defense clients. Deere’s acquisition of Sentera extended precision-agriculture offerings with proprietary multispectral cameras. Supply-chain resiliency surfaced as a differentiator, with North American and European primes favoring suppliers able to prove non-Chinese rare-earth content.
Technology roadmaps emphasized sensor-fusion stacks bundled with edge-AI processing to offload cloud dependence. Vendors competed on SWaP metrics, promoting integrated camera-IMU-LiDAR boards that saved up to 35 g compared to discrete assemblies. Strategic partnerships, including Sony’s tie-up with Swift Navigation for centimeter-level GNSS, illustrated the move toward turnkey positioning ecosystems.
Drone Sensor Industry Leaders
InvenSense, Inc.
TE Connectivity Corporation
Sony Semiconductor Solutions Corporation
Ouster, Inc.
Bosch Sensortec GmbH (Robert Bosch GmbH)
- *Disclaimer: Major Players sorted in no particular order

Recent Industry Developments
- June 2025: Ouster received the US Department of Defense approval for its OS1 digital LiDAR sensor under the Blue UAS framework, enabling integration into military drone programs.
- February 2025: Ondas Holdings partnered with Volatus Aerospace to deploy LiDAR-equipped Optimus drones for border surveillance missions.
- July 2024: Inertial Labs and ideaForge combined RESEPI LiDAR with UAV platforms for high-density mapping.


Research Methodology Framework and Report Scope
Market Definitions and Key Coverage
Our study defines the drone sensor market as the total annual revenue earned from the sale of inertial, image, LiDAR, pressure, position, flow, and other onboard sensing modules that are factory-installed in new civilian and military unmanned aerial vehicles, regardless of platform size or propulsion. Valuation is recorded at manufacturer selling price in USD.
Scope exclusion: We deliberately exclude retrofit sensor upgrades, ground-based detection kits, and counter-drone sensor suites.
Segmentation Overview
- By Sensor Type
- Inertial Sensors (IMU, Gyro, Accelerometer)
- Image Sensors
- Speed and Distance Sensors
- Position Sensors
- Pressure and Differential Barometric Sensors
- Altimeter
- Flow
- LiDAR Sensors
- Others
- By Platform Type
- Vertical Take-Off and Landing (VTOL)
- Fixed-wing
- Hybrid
- By Application
- Navigation and Positioning
- Collision Avoidance
- Aerial Mapping and Surveying
- Environmental and Atmospheric Monitoring
- Payload Handling and Delivery Assistance
- Others (Cinematography, Inspection)
- By End-user Industry
- Defense and Security
- Agriculture and Forestry
- Energy and Utilities
- Construction and Mining
- Consumer
- Logistics and Warehousing
- Environmental Research and Conservation
- Media and Entertainment
- Others
- By Geography
- North America
- United States
- Canada
- Mexico
- Europe
- Germany
- United Kingdom
- France
- Russia
- Rest of Europe
- Asia-Pacific
- China
- Japan
- India
- South Korea
- Australia
- Rest of Asia-Pacific
- South America
- Brazil
- Rest of South America
- Middle East and Africa
- Middle East
- United Arab Emirates
- Saudi Arabia
- Turkey
- Rest of Middle East
- Africa
- South Africa
- Rest of Africa
- Middle East
- North America
Detailed Research Methodology and Data Validation
Desk Research
We first gather publicly available building blocks from tier-one sources such as the Federal Aviation Administration drone registration dashboard, EASA open-category waiver data, UN Comtrade exports of accelerometers and optical modules, and peer-reviewed work on MEMS miniaturization in IEEE Xplore. Company filings, IPO prospectuses, and investor decks add pricing and mix insights, while paid tools like D&B Hoovers and Dow Jones Factiva help us verify revenue splits. These materials frame shipment volumes and average selling prices for each platform class.
Additional insight comes from trade bodies including AUVSI and the Japan UAS Industrial Development Association, patent analytics via Questel that flag emerging LiDAR designs, and authoritative press coverage that tracks defense contract awards. The sources listed are illustrative, and many others inform data checks and narrative clarity.
Primary Research
Our analysts speak with flight-controller engineers, sensor OEM product managers, defense procurement officers, and crop-mapping service providers across North America, Europe, Asia-Pacific, and the Middle East. These conversations validate attach-rate assumptions, regional compliance costs, and early adoption signals that rarely surface in open data.
Market-Sizing & Forecasting
A top-down model starts by reconstructing the global drone stock and yearly additions from registration, delivery, and procurement statistics. We then multiply those pools by verified sensor bundles and price trajectories. Supplier roll-ups, channel checks, and ASP × volume math give a selective bottom-up lens that tempers the totals. Key model inputs include commercial drone shipments, military UAV orders, multi-sensor pod penetration, LiDAR cost deflation, and BVLOS regulatory approvals. A multivariate regression blended with ARIMA projects values through 2030, letting volume and price drivers move independently yet remain linked to macro activity.
Data Validation & Update Cycle
Outputs pass three layers of analyst review, where variance thresholds trigger re-contact with experts. We benchmark results against independent import data and contract values, flag anomalies, and adjust before sign-off. Reports refresh every twelve months, with interim updates after material events.
Why Mordor's Drone Sensor Baseline Earns Trust
Published estimates often diverge because firms choose different sensor families, price points, and update rhythms. Our disciplined scope and annual refresh make such variations transparent.
Key gap drivers include whether aftermarket retrofits are counted, the inclusion of ISR payload sensors that inflate totals, currency conversions fixed at earlier rates, and the use of unvetted attach-rate assumptions. Mordor Intelligence reports only factory-installed airborne sensors and updates exchange rates at every refresh.
Benchmark comparison
| Market Size | Anonymized source | Primary gap driver |
|---|---|---|
| USD 1.67 B (2025) | Mordor Intelligence | |
| USD 1.40 B (2024) | Global Consultancy A | Counts retrofit kits and uses static price deck |
| USD 1.40 B (2023) | Industry Journal B | Bundles ISR payloads and applies single-region growth proxy |
These comparisons show that Mordor Intelligence's step-wise modeling, transparent scope, and rolling data checks deliver a balanced baseline that decision-makers can trace and replicate with confidence.


Key Questions Answered in the Report
What was the drone sensor market size in 2026 and where is it headed by 2031?
The drone sensor market reached USD 1.85 billion in 2026 and is projected to grow to USD 3.12 billion by 2031, reflecting an 10.95% CAGR.
Which sensor type presently dominates the drone sensor market?
Inertial measurement units led with 31.75% market share in 2025 because every drone relies on gyroscopes and accelerometers for stable flight.
Why are hybrid airframes gaining traction?
Hybrid tilt-rotor designs combine VTOL convenience with fixed-wing efficiency, enabling longer missions and posting a 13.85% CAGR that outpaces other platform types.
Which region is expanding the fastest in the drone sensor market?
Asia-Pacific is forecasted to record a 11.75% CAGR through 2031, supported by large-scale manufacturing in China and rising commercial use in Japan, India, and South Korea.
How do Remote ID regulations influence sensor demand?
Mandatory broadcasting rules in the United States and forthcoming European standards compel fleet owners to retrofit or replace drones with compliant sensor modules, adding USD 50–300 per unit and driving short-term sales.
What challenges arise from rare-earth dependency in sensor producti
China processes over 80% of rare-earth materials, and export restrictions pose supply risks, prompting North American and European buyers to seek alternative sources or redesign sensors to reduce magnet dependence.
Page last updated on:


