Drag Reducing Agents Market Size and Share
Market Overview
| Study Period | 2020 - 2031 |
|---|---|
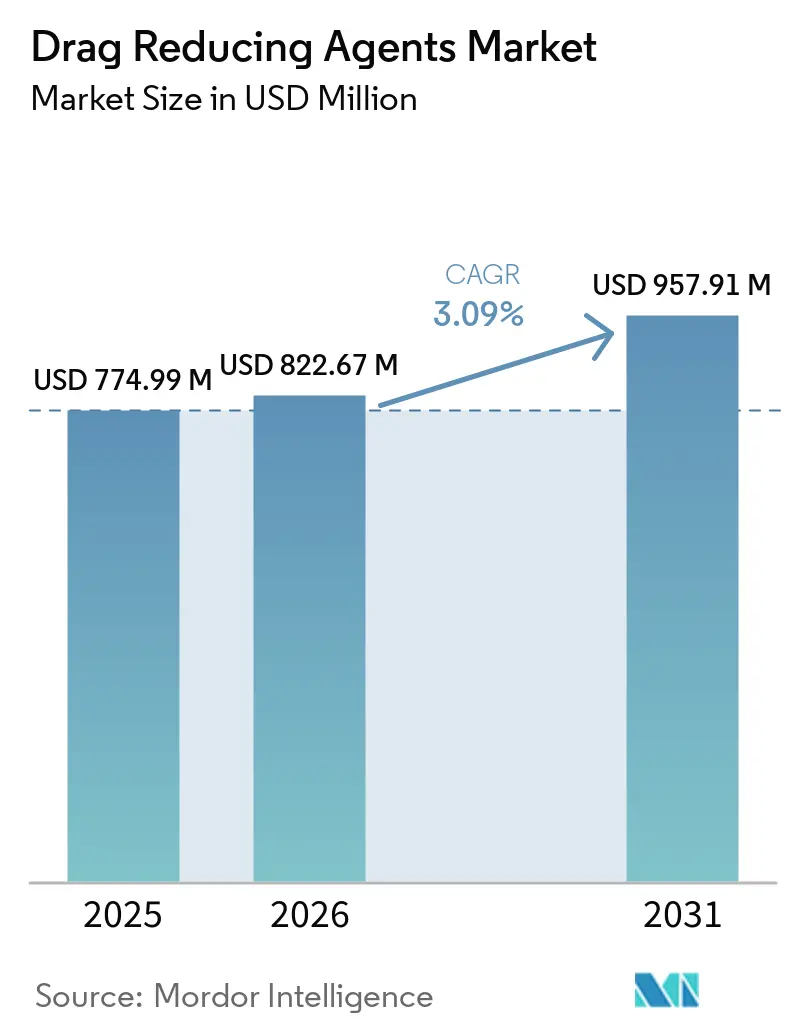
| Market Size (2026) | USD 822.67 Million |
| Market Size (2031) | USD 957.91 Million |
| Growth Rate (2026 - 2031) | 3.09% CAGR |
| Fastest Growing Market | Asia-Pacific |
| Largest Market | North America |
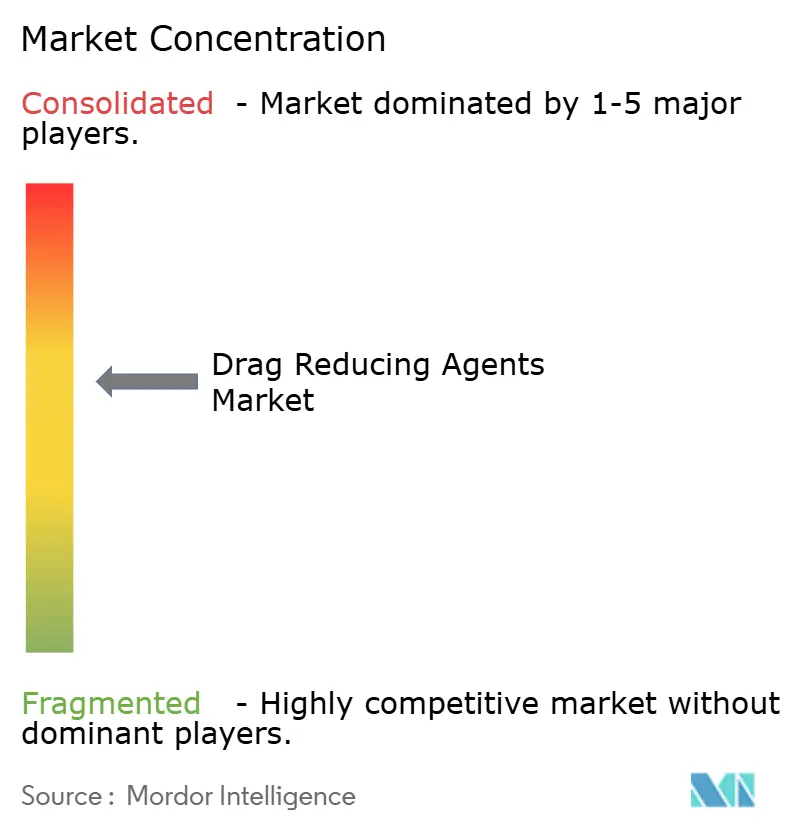
| Market Concentration | Medium |
Major Players *Disclaimer: Major Players sorted in no particular order Image © Mordor Intelligence. Reuse requires attribution under CC BY 4.0. | |
Drag Reducing Agents Market Analysis by Mordor Intelligence
The Drag Reducing Agents Market size was valued at USD 774.99 million in 2025 and is estimated to grow from USD 822.67 million in 2026 to reach USD 957.91 million by 2031, at a CAGR of 3.09% during the forecast period (2026-2031). Continued emphasis on pipeline throughput optimization, aging infrastructure in mature basins, and regulatory pressure to cut emissions collectively sustain robust demand. Operators view drag reducing agents as a cost‐effective alternative to new construction, especially as volatile commodity prices constrain capital budgets. The drag reducing agents market draws further strength from heavy-crude development and expanding transcontinental gas corridors that require friction reduction to curb compression energy. Competition is intensifying as producers seek integrated chemical-plus-digital solutions that assure performance and address end-of-life polymer concerns. As a result, the drag reducing agents market now attracts both diversified chemicals majors and niche innovators with nano-dispersed or electric-field technologies.
Key Report Takeaways
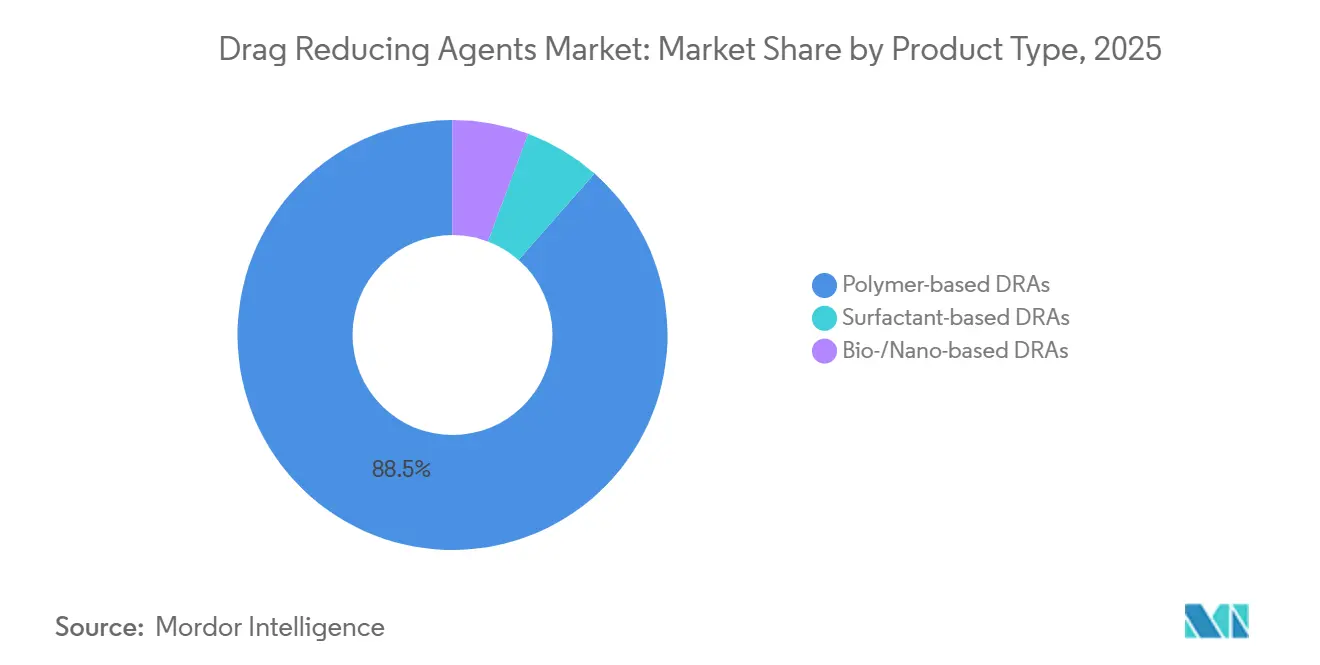
- By product type, polymer-based DRAs captured 88.52% of drag reducing agents market share in 2025; surfactant-based DRAs are advancing at a 4.63% CAGR through 2031.
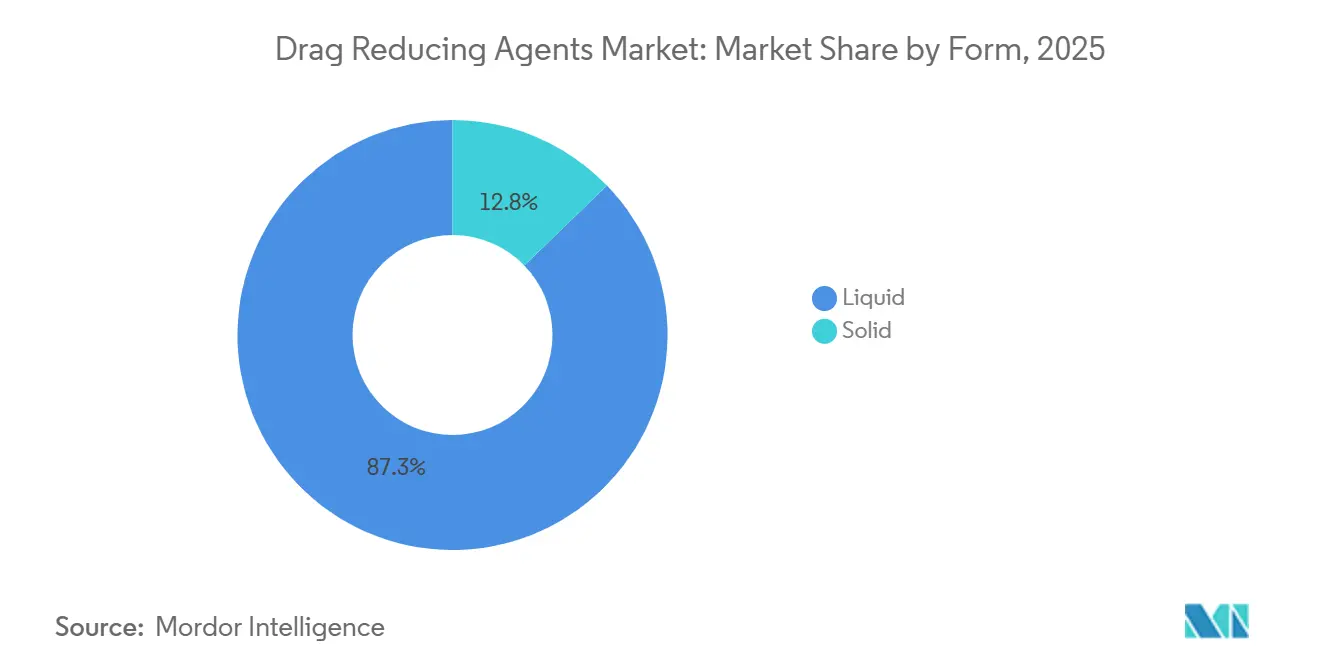
- By form, liquid form accounted for 87.25% of the drag reducing agents market size in 2025; solid form record the highest 4.93% CAGR through 2031.
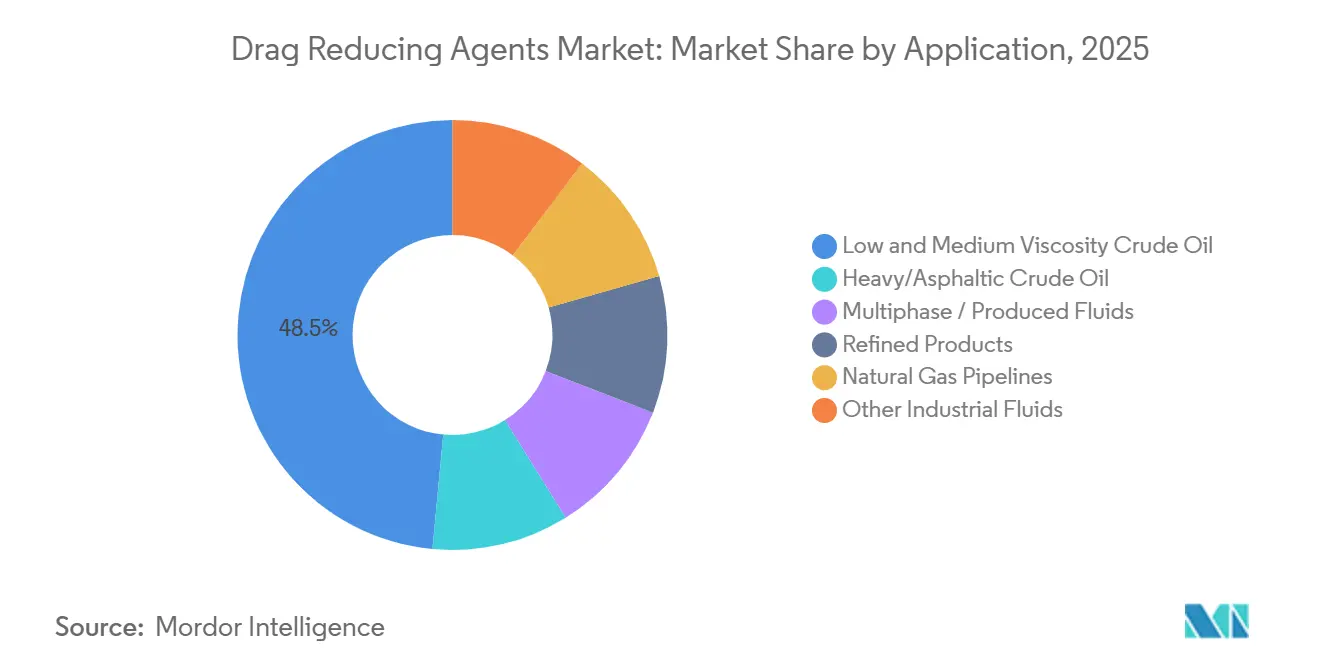
- By application, low- and medium-viscosity crude oil held 48.52% of the drag reducing agents market size in 2025; while natural gas pipelines are expanding at a 6.69% CAGR through 2031.
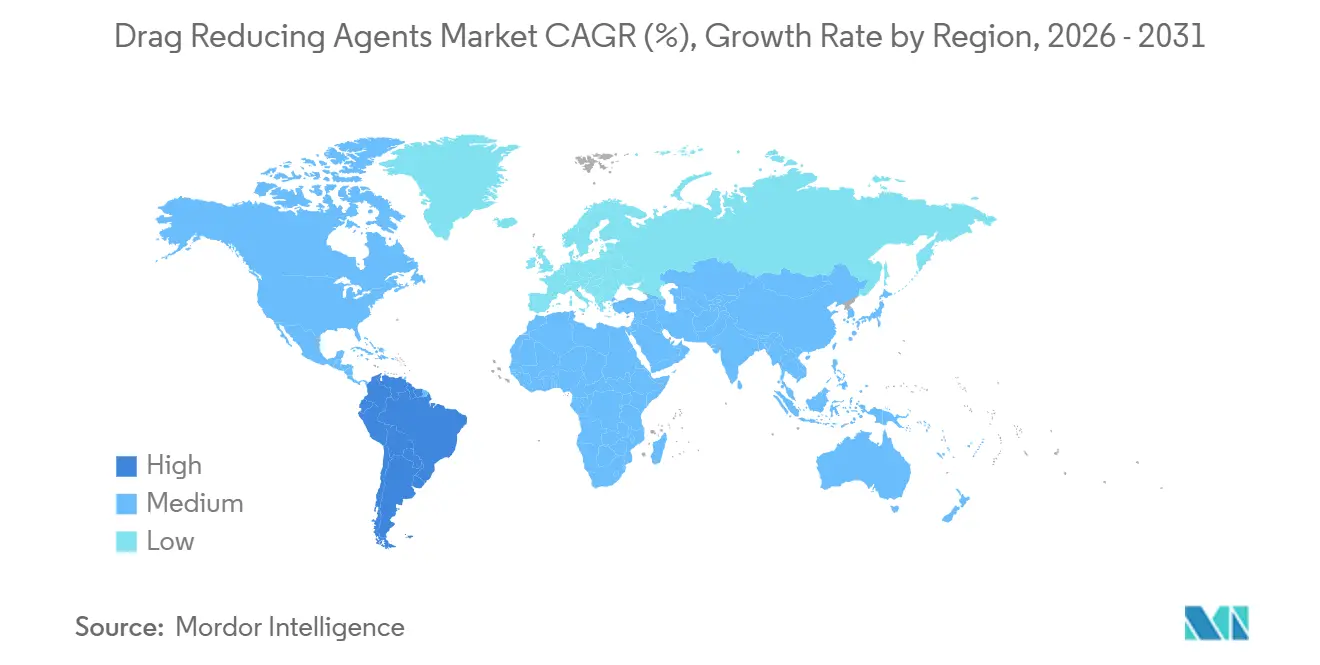
- By geography, North America led with 57.13% revenue share in 2025, while South America is forecast to grow 5.48% CAGR to 2031.
Note: Market size and forecast figures in this report are generated using Mordor Intelligence’s proprietary estimation framework, updated with the latest available data and insights as of 2026.
Global Drag Reducing Agents Market Trends and Insights
Drivers Impact Analysis*
| Driver | (~) % Impact on CAGR Forecast | Geographic Relevance | Impact Timeline |
|---|---|---|---|
| Pipeline Capacity Expansion in North America and Asia | +1.6% | North America and Asia-Pacific core, spill-over to Middle East | Medium term (2-4 years) |
| Operational Cost-Cutting and Energy-Efficiency Push | +1.4% | Global, with early gains in North America, Europe | Short term (≤ 2 years) |
| Rising Heavy-Crude Output Requiring Flow Optimisation | +1.1% | North America, Middle East, South America | Medium term (2-4 years) |
| Take-Away Bottlenecks in Shale Plays | +0.7% | North America core, Texas Permian and North Dakota Bakken | Short term (≤ 2 years) |
| Nano-Dispersed DRA Formulations Enabling Low Dosages | +0.8% | Global, technology leaders in North America and Europe | Long term (≥ 4 years) |
| Emission-Reduction Rules Boosting Gas-Pipeline DRA Use | +0.6% | Europe and North America regulatory focus, spill-over to APAC | Medium term (2-4 years |
| Source: Mordor Intelligence | |||
Pipeline Capacity Expansion in North America and Asia
Active pipeline construction and debottlenecking programs compel operators to squeeze every barrel of flow from existing lines before sanctioning new projects. Enbridge’s Southern Illinois Connector and the CAD 2 billion Yellowhead Mainline illustrate how capacity additions of 200,000 barrels per day hinge on chemical optimisation. Trans Mountain’s plan to lift throughput by 300,000 barrels per day via drag reducing agents underlines the technology’s role as a bridge between current constraints and future pipe builds[1]Pipeline Journal Editors, “Trans Mountain Evaluates DRA for 300,000 BPD Expansion,” pipeline-journal.com . Such projects are most urgent in shale-rich basins and rapidly industrialising Asian economies where regulatory approvals for new lines remain protracted. Consequently, the drag reducing agents market benefits from near-term chemical demand followed by ongoing maintenance volumes once new pipes come online. This dynamic fosters supplier interest in multi-year offtake contracts tied to named expansion projects.
Operational Cost-Cutting and Energy-Efficiency Push
Volatile prices elevate the importance of operating cost control. Drag reducing agents enable pipelines to maintain target flow at lower pump pressures, trimming power bills by 10–15% and extending equipment life. Electricity savings resonate strongly in North America and Europe where carbon pricing and ESG scrutiny penalise energy-intensive assets. The drag reducing agents industry also benefits from recent EPA restrictions on gas-driven pneumatic pumps, which encourage chemical optimisation over incremental compression capacity. These factors trigger quick payback periods that align with management mandates to defer discretionary capex.
Rising Heavy-Crude Output Requiring Flow Optimisation
Producers in Canada’s oil sands, Venezuela’s Orinoco Belt, and Middle Eastern heavy-oil fields contend with high viscosity that drives up line pressure and diluent cost. Field trials record friction reduction of 16–25% at 300–1,000 ppm polymer dose, allowing operators to hit throughput targets without costly diluent or extensive pump upgrades. With light-crude reserves flattening, the drag reducing agents market anchors long-distance heavy-oil projects that underpin medium-term global supply.
Take-Away Bottlenecks in Shale Plays
Permian and Bakken producers frequently outpace local pipe capacity, creating price discounts and flaring risk. Short-cycle deployment of drag reducing agents can add interim capacity within weeks compared with multi-year pipe builds. This makes chemical solutions indispensable to midstream firms seeking tariff revenue while navigating tight construction windows and land-owner negotiations prevalent in U.S. shale.
Restraints Impact Analysis*
| Restraint | (~) % Impact on CAGR Forecast | Geographic Relevance | Impact Timeline |
|---|---|---|---|
| Crude-Price Volatility Dampening OPEX Budgets | -1.1% | Global, acute in North America shale regions | Short term (≤ 2 years) |
| Polymer-DRA End-of-Life Environmental Concerns | -0.8% | Europe, North America regulatory focus | Medium term (2-4 years) |
| Supply Crunch of High-Purity Α-Olefin Monomers | -0.6% | Global, supply concentrated in North America and Middle East | Medium term (2-4 years) |
| Shift to Renewable-Powered Electric Pumps | -0.4% | Europe and North America early adoption, APAC selective | Long term (≥ 4 years) |
| Source: Mordor Intelligence | |||
Crude-Price Volatility Dampening OPEX Budgets
Sharp commodity swings prompt operators to cut discretionary chemical spending even though drag reducing agents often pay for themselves through energy savings. The effect is most pronounced in shale regions with high breakevens, where short-term cash flow preservation overrides efficiency programs. As prices stabilise, spending typically rebounds, but the cyclical nature of budget allocation injects forecasting uncertainty into supplier order books.
Polymer-DRA End-of-Life Environmental Concerns
Regulators in Europe and several U.S. states scrutinise persistence of synthetic polymers in pipeline systems. Pending rules could limit approved chemistries, forcing suppliers to accelerate biodegradable alternatives. Until robust field proof emerges, some operators delay blanket adoption, especially in environmentally sensitive corridors.
*Our forecasts treat driver/restraint impacts as directional, not additive. The impact forecasts reflect baseline growth, mix effects, and variable interactions.
Segment Analysis
By Product Type: Polymers Dominate Despite Bio-Innovation
Polymer-based DRAs captured 88.52% of drag reducing agents market share in 2025, underscoring deep operator trust in their proven 16–25% friction-reduction performance at 300–1,000 ppm dosage. This dominance means polymer products accounted for the largest slice of drag reducing agents market size, generating dependable volume for established suppliers. Surfactant-based DRAs are expected to grow at 4.63% through 2031 and serve niche contexts such as multiphase or compatibility-sensitive lines, while bio- and nano-based DRAs are growing by leveraging lower dosage, biodegradability, and simplified disposal.
Sustainability mandates accelerate R&D into bio-based chemistries exemplified by Indian Oil Corporation’s XtraFlo portfolio, which matches polymer efficacy yet eases environmental compliance. Suppliers highlight nano-dispersed variants that cut active polymer mass by half, lowering freight costs and diminishing shear breakdown in high-RPM booster pumps. The interplay of performance certainty and regulatory acceptance will determine how quickly these emerging chemistries erode polymer share through 2031.


By Form: Liquid Dominance Reflects Handling Preferences
Liquid formulations represented 87.25% of drag reducing agents market size in 2025, favored for turnkey injection through existing metering pumps. Their share is reinforced by automated dosing skids that integrate with pipeline SCADA platforms. Solid and granular products cater to remote sites lacking liquid-handling facilities, with granular gaining 4.93% CAGR on the strength of lower freight cost and longer shelf life.
Advances in rapid-dissolve carriers enable granular beads to hydrate at the injection point, narrowing performance gaps with liquids. Operators weigh capital savings on storage tanks against possible residue accumulation, a trade-off suppliers seek to solve via cleaner dissolving aids. As supply chains globalize, the freight savings of water-free granular shipments could lift their cost competitiveness, especially for landlocked Asia-Pacific markets.
By Application: Heavy Crude Drives Specialized Demand
Low- and medium-viscosity crude oil comprised 48.52% of the drag reducing agents market size in 2025 due to the sheer mileage of legacy oil lines. Natural gas pipelines, however, deliver the fastest 6.69% CAGR as operators prioritize methane-saving throughput gains over new compressors. Heavy crude and asphaltic lines adopt higher-grade DRAs to offset viscosity penalties, commanding premium price points that bolster supplier margins.
The intensifying focus on methane regulations in the United States and Europe encourages gas-pipeline operators to trial drag reducing agents as a non-mechanical efficiency lever. Concurrently, electric-field innovations from QS Energy promise a chemical-free alternative for heavy-oil corridors, potentially complementing rather than displacing polymers by addressing segments where chemical carryover is problematic.
Geography Analysis
North America’s 57.13% revenue leadership in 2025 owes to an extensive pipeline grid, early DRA adoption, and shale production that magnifies takeaway constraints. Major operators such as Trans Mountain and Enbridge rely on drag reducing agents to unlock near-term throughput, adding up to 300,000 barrels per day on legacy corridors. Regulatory momentum toward lower emission intensity further embeds chemical optimisation into maintenance budgets, creating steady replacement demand even as new projects arrive. Three decades of field data also give North American buyers confidence in supplier performance claims, reinforcing incumbent supplier positions.
Asia-Pacific is one of the fastest-growing regions through 2031 thanks to China’s long-haul gas grid expansion and India’s import-pipeline build-out. Local chemical firms leverage technology licensing, such as Indian Oil’s XtraFlo, to reduce reliance on imports while tailoring formulations to regional crudes. Government support for strategic energy corridors pairs capital funding with efficiency mandates, embedding drag reducing agents into project specifications from day one. As networks mature, demand transitions from commissioning volumes to continuous optimisation, mirroring the North American lifecycle.
Europe exhibits flat but resilient consumption driven by strict environmental rules that favor bio-degradable or nano-dispersed products. South America is expected to be the fastest growing region at 5.48% through 2031. Heavy-oil exporters in the Middle East and selective African and South American nations deploy high-performance DRAs on export pipelines to maintain flow rates amid rising viscosity blends. These corridors often pair chemical solutions with pump station upgrades, creating hybrid demand cycles that stabilise global supplier order books.

Competitive Landscape
Market structure is moderately fragmented. Baker Hughes, Lubrizol, Innospec, Flowchem, and SNF anchor the incumbent tier with proprietary ultra-high-molecular-weight polymers, global logistics, and field-engineering support. Each firm bundles chemicals with dosing skid design and real-time monitoring, reinforcing switching costs for pipeline clients.
Regional challengers such as Indian Oil Corporation leverage captive refining assets and domestic policy support to scale offerings like XtraFlo, providing cost advantages in Asia’s price-sensitive markets. Niche innovators, notably QS Energy, pursue non-chemical viscosity reduction via electric-field systems that promise 10% throughput gains without additive carryover. While early-stage, successful pilots could pressure polymer volumes on select heavy-oil lines rather than mainstream crude or gas routes.
Strategic themes include sustainability, digitalisation, and lifecycle services. Suppliers race to certify bio-based or rapidly degradable polymers under Europe’s upcoming disposal guidelines, while integrated SCADA analytics optimise dose rates to save customers chemical spend. Partnerships between chemical majors and automation vendors proliferate, delivering turnkey optimisation contracts that blend chemistry, hardware, and data analytics.
Drag Reducing Agents Industry Leaders
Baker Hughes
Flowchem
Innospec
LiquidPower Specialty Products Inc.
Dorf Ketal Chemicals India Pvt Ltd
- *Disclaimer: Major Players sorted in no particular order

Recent Industry Developments
- July 2025: Baker Hughes secured a contract to supply FLO product line drag-reducing agents (DRAs) for two major offshore oil pipelines in the U.S Gulf Coast, facilitating light and heavy crude transportation from offshore platforms to Texas and Louisiana facilities.
- April 2024: Indian Oil Corporation Ltd. patented a titanium halide-based process for manufacturing ultra-high molecular weight drag reducing polymer powder, achieving intrinsic viscosity more than 10 dL/g and conversion more than 90%.


Global Drag Reducing Agents Market Report Scope
A drag-reducing agent is a chemical with a high molecular weight that is introduced to a pipe to reduce turbulence and thereby increase the ability and efficiency of flow through the pipe. The friction or interaction between the moving stream and the pipe wall causes turbulence in a pipeline. Drag-reducing compounds are widely utilized in the oilfield industry whereas their rising application in the transportation of crude oil, refined petroleum products, multi-phase liquids, and water is fueling market demand. The drag-reducing agent market is segmented by applications and geography. By application, the market is segmented into low- and medium-phase crude oil, heavy/asphaltic crude, multiphase fluid, refined products, and other applications. The report covers the market size and forecast for the drag-reducing agent market in 15 countries across major regions. For each segment, the market sizing and forecasts have been done based on the value (USD million) for all the above segments.
| Polymer-based DRAs |
| Surfactant-based DRAs |
| Bio-/Nano-based DRAs |
| Liquid |
| Solid |
| Low and Medium Viscosity Crude Oil |
| Heavy/Asphaltic Crude Oil |
| Multiphase / Produced Fluids |
| Refined Products |
| Natural Gas Pipelines |
| Other Industrial Fluids |
| Asia-Pacific | China |
| India | |
| Japan | |
| South Korea | |
| ASEAN Countries | |
| Rest of Asia-Pacific | |
| North America | United States |
| Canada | |
| Mexico | |
| Europe | Germany |
| United Kingdom | |
| France | |
| Italy | |
| Russia | |
| NORDIC Countries | |
| Rest of Europe | |
| South America | Brazil |
| Argentina | |
| Rest of South America | |
| Middle East and Africa | Saudi Arabia |
| South Africa | |
| Rest of Middle East and Africa |
| By Product Type | Polymer-based DRAs | |
| Surfactant-based DRAs | ||
| Bio-/Nano-based DRAs | ||
| By Form | Liquid | |
| Solid | ||
| By Application | Low and Medium Viscosity Crude Oil | |
| Heavy/Asphaltic Crude Oil | ||
| Multiphase / Produced Fluids | ||
| Refined Products | ||
| Natural Gas Pipelines | ||
| Other Industrial Fluids | ||
| By Geography | Asia-Pacific | China |
| India | ||
| Japan | ||
| South Korea | ||
| ASEAN Countries | ||
| Rest of Asia-Pacific | ||
| North America | United States | |
| Canada | ||
| Mexico | ||
| Europe | Germany | |
| United Kingdom | ||
| France | ||
| Italy | ||
| Russia | ||
| NORDIC Countries | ||
| Rest of Europe | ||
| South America | Brazil | |
| Argentina | ||
| Rest of South America | ||
| Middle East and Africa | Saudi Arabia | |
| South Africa | ||
| Rest of Middle East and Africa | ||


Key Questions Answered in the Report
How large is the drag reducing agents market in 2026?
The Drag Reducing Agents Market size was valued at USD 774.99 million in 2025 and is estimated to grow from USD 822.67 million in 2026 to reach USD 957.91 million by 2031, at a CAGR of 3.09% during the forecast period (2026-2031).
Which region leads demand for drag reducing agents?
North America holds 57.13% revenue share, driven by extensive shale pipelines and early technology adoption.
What is the fastest-growing application for drag reducing agents?
Natural gas pipelines, expanding at a 6.69% CAGR, lead growth due to methane-emission regulations.
Which product type dominates supplier revenue?
Polymer-based drag reducing agents command 88.52% market share owing to proven 16–25% friction-reduction efficacy.
Page last updated on:


