Digital Twin (DT) Market Size and Share
Market Overview
| Study Period | 2019 - 2030 |
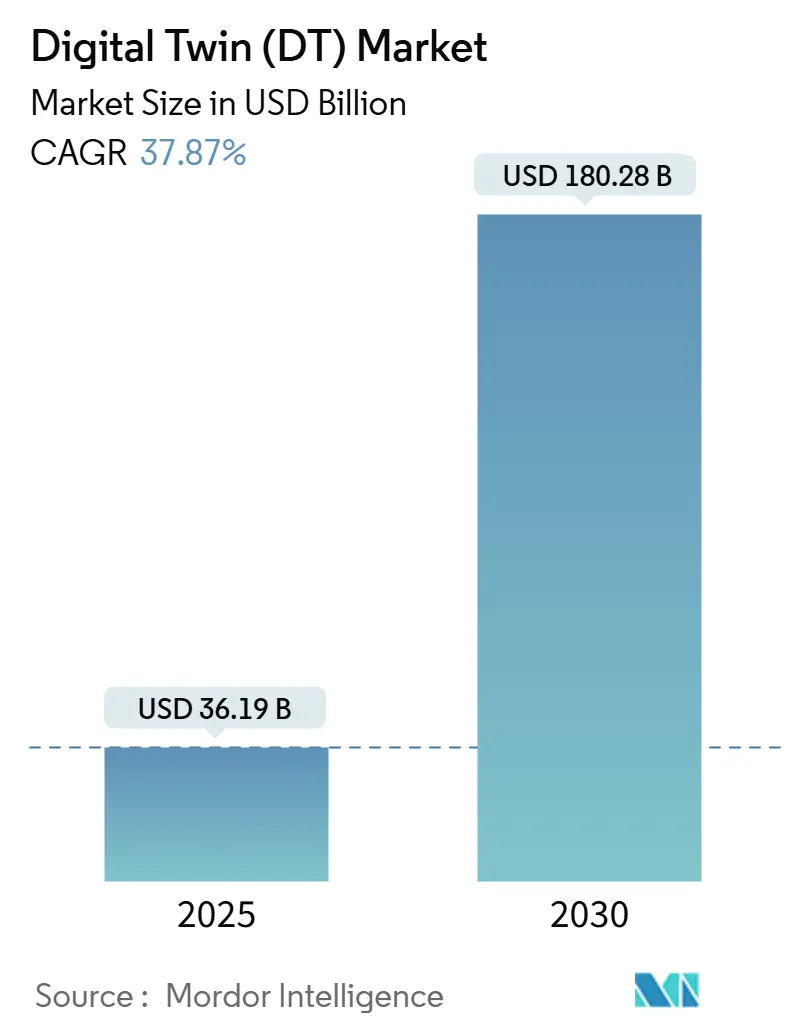
| Market Size (2025) | USD 36.19 Billion |
| Market Size (2030) | USD 180.28 Billion |
| Growth Rate (2025 - 2030) | 37.87% CAGR |
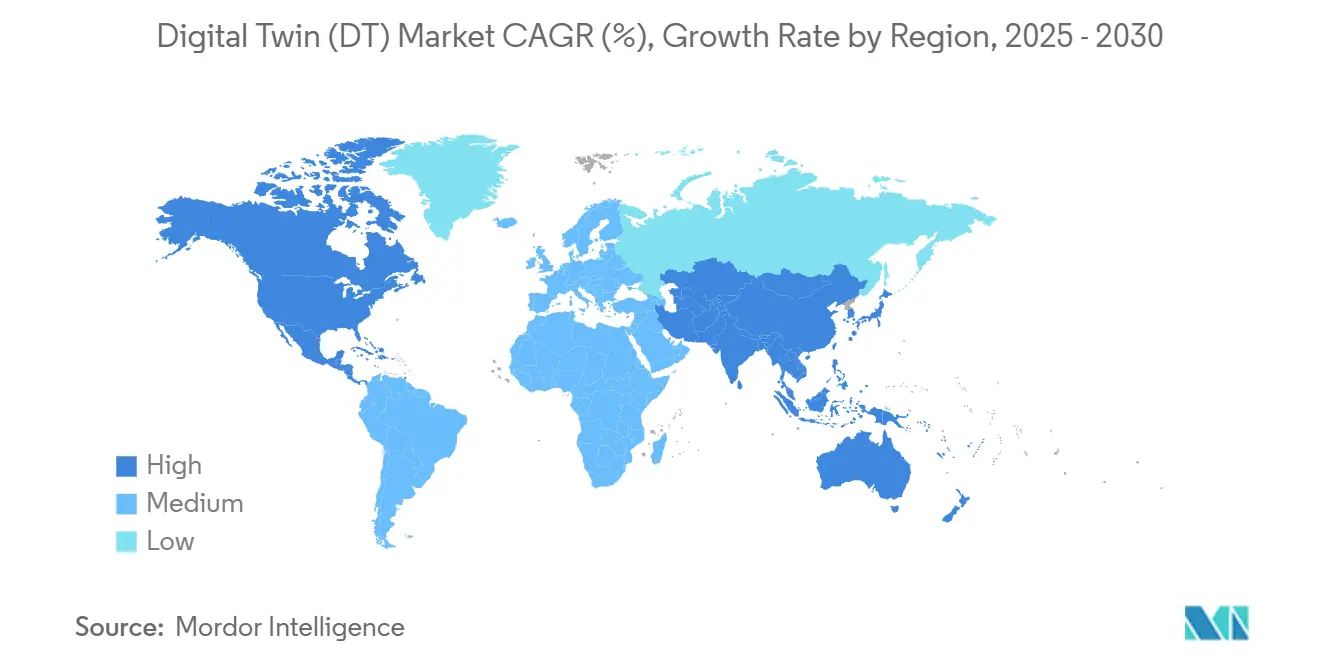
| Fastest Growing Market | Asia Pacific |
| Largest Market | North America |
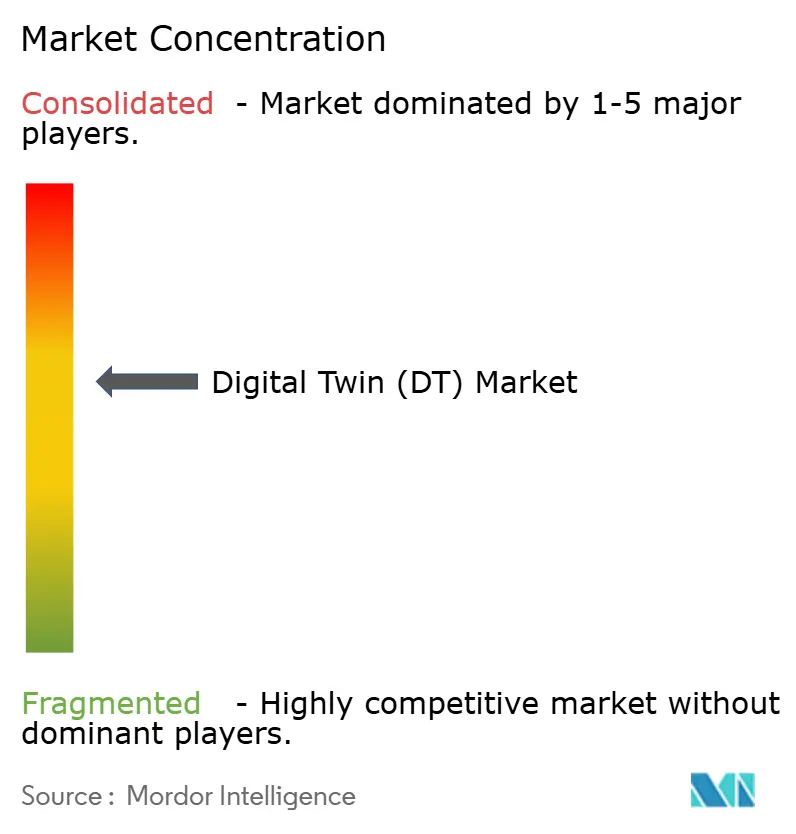
| Market Concentration | Medium |
Major Players*Disclaimer: Major Players sorted in no particular order Image © Mordor Intelligence. Reuse requires attribution under CC BY 4.0. |
|
Digital Twin (DT) Market Analysis by Mordor Intelligence
The digital twin market currently stands at USD 36.19 billion in 2025 and is projected to reach USD 180.28 billion in 2030, advancing at a 37.87% CAGR. Tailwinds include the maturation of industrial IoT platforms, wider edge-AI deployment, and regulatory requirements for safety-critical infrastructure. Manufacturing remains the largest application thanks to established smart-factory investments, while Oil and Gas shows the strongest growth as producers seek asset-integrity gains in harsh operating conditions. Regionally, North America retains the lead, but Asia-Pacific is closing the gap as public programs in China, India, and Japan channel funding toward large-scale digitalization. Solutions account for most spending today, yet services are scaling quickly as firms seek integration expertise. Cloud deployment is growing faster than on-premises, signaling rising confidence in remote data-management safeguards and scalable architectures. Cyber-security gaps and scarce physics-based modeling talent temper the growth outlook, though they have not altered the primary trajectory of adoption.
Key Report Takeaways
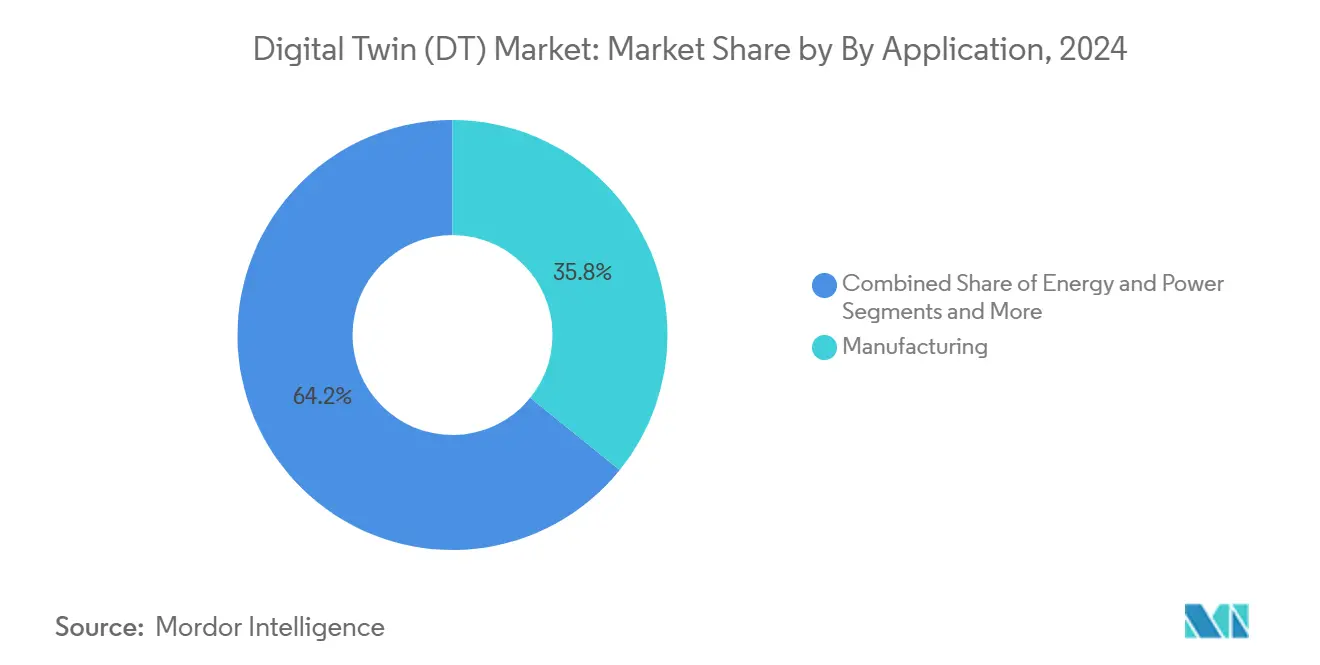
- By application, manufacturing led with 35.8% of digital twin market share in 2024; Oil & Gas is forecast to expand at a 29.3% CAGR through 2030.
- By component, solutions captured 63.6% revenue share in 2024, while services are projected to grow at 31.4% CAGR to 2030.
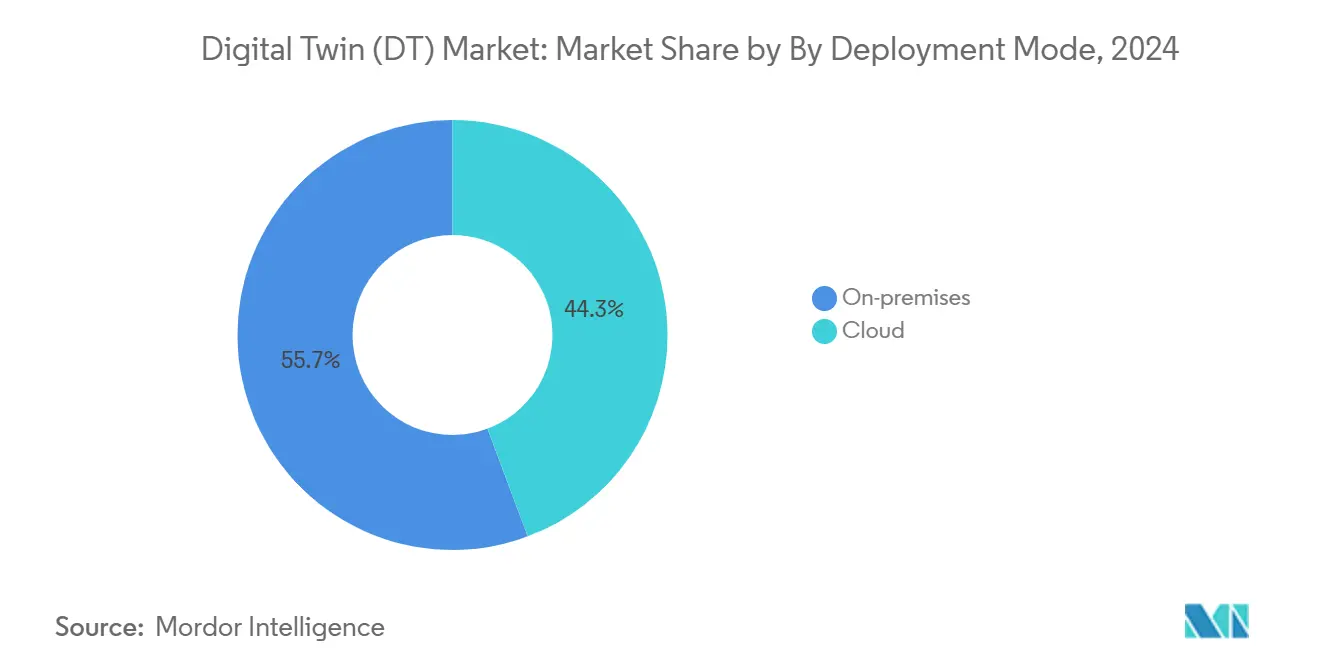
- By deployment mode, on-premises held 55.7% share of the digital twin market size in 2024; cloud is advancing at a 32.8% CAGR to 2030.
- By enterprise size, large enterprises commanded 68.12% share in 2024; small and medium enterprises are the fastest-growing at 28.7% CAGR.
- By geography, North America led with 38.4% of the digital twin market share in 2024, whereas Asia-Pacific is set to rise at a 27.2% CAGR through 2030.
Global Digital Twin (DT) Market Trends and Insights
Drivers Impact Analysis
| Driver | (~) % Impact on CAGR Forecast | Geographic Relevance | Impact Timeline |
|---|---|---|---|
| Rapid growth of industrial IoT platforms | +8.2% | Global, with Asia-Pacific leading adoption | Medium term (2-4 years) |
| Expansion of edge/AI inference at the device level | +7.5% | North America and EU, spill-over to APAC | Short term (≤ 2 years) |
| Regulatory push for asset-intensive industries to digitise safety-critical infrastructure | +6.8% | EU and North America, expanding to Asia-Pacific | Long term (≥ 4 years) |
| Demand for virtual commissioning to cut CAPEX in brownfield projects | +5.3% | Global, concentrated in manufacturing hubs | Medium term (2-4 years) |
| Rise of outcome-based service contracts needing real-time asset replica data | +4.9% | North America and EU, aerospace/energy focus | Long term (≥ 4 years) |
| Proliferation of digital product passports in EU and U.S. | +4.1% | EU and U.S., expanding globally | Medium term (2-4 years) |
Source: Mordor Intelligence
Rapid growth of industrial IoT platforms
Widespread IIoT deployment supplies real-time data that keeps digital models synchronized with factory floors. Siemens reported EUR 9 billion (USD 9.72 billion) digital business revenue in 2024, up 22% on the strength of its Xcelerator ecosystem[1]Roland Busch, “Siemens FY 2024 Press Conference,” Siemens AG, siemens.com. Honeywell’s Forge platform processes 3 billion+ datapoints daily, cutting unplanned downtime by 35% in client plants. Standardized protocols such as OPC UA and MQTT reduce integration friction, enabling plants to deploy twins in weeks rather than months. The result is steady cost avoidance, quicker root-cause analysis, and more predictable capacity planning.
Expansion of edge/AI inference at the device level
Moving analytics from cloud to edge trims latency and preserves data sovereignty. Microsoft and Siemens co-developed Industrial Foundation Models that run inference at the asset, allowing millisecond-level responses for anomaly detection. Audi now operates virtual PLCs through edge-deployed twins that optimize cycle times in real manufacturing lines. Local simulation also limits bandwidth consumption because only exception of data moves upstream. Specialized chips and containerized runtimes further cut deployment costs for tier-two suppliers, accelerating the spread of AI-ready twins throughout value chains.
Regulatory push for asset-intensive industries to digitise safety-critical infrastructure
The EU digital product passport rule (2024-2027) obliges manufacturers to maintain granular digital records for textiles, electronics, and building materials. Aviation regulators now accept simulation-based certification; Siemens and UL Solutions secured the first drive certification via a digital twin, slashing verification time by 40%. Compliance mandates shift digital twins from optional efficiency tools to required documentation layers, boosting adoption among conservative sectors such as chemicals and rail.
Demand for virtual commissioning to cut CAPEX
Cambridge University research shows virtual commissioning can shrink project timelines by 25% and eliminate up to 60% of physical tests in complex lines. Shell leverages refinery twins to trial process changes virtually, reducing downtime risk and accelerating investment payback. As facilities age, brownfield upgrades grow costlier; virtual validation lets engineers adjust parameters in software first, minimizing field-work overruns and material waste.
Restraints Impact Analysis
| Restraint | (~) % Impact on CAGR Forecast | Geographic Relevance | Impact Timeline |
|---|---|---|---|
| Cyber-physical security vulnerabilities across IT/OT stacks | -3.8% | Global, concentrated in critical infrastructure | Short term (≤ 2 years) |
| Shortage of domain-specific physics-based modelling expertise | -3.2% | Global, acute in emerging markets | Long term (≥ 4 years) |
| Opaque IP ownership of data generated in federated twins | -2.1% | EU and North America, regulatory focus | Medium term (2-4 years) |
| Fragmentation of simulation standards limiting interoperability | -1.9% | Global, industry-specific variations | Long term (≥ 4 years) |
Source: Mordor Intelligence
Cyber-physical security vulnerabilities across IT/OT stacks
The Spanish National Cybersecurity Institute notes that twins bridging IT and OT widen attack surfaces, exposing process controllers to data-integrity threats. Recent ransomware events forced manufacturers to halt production for days while cleansing twin data lakes. Average deployment delays of 18 months arise as firms integrate zero-trust architectures and train staff. Multi-tenant twins add complexity because partner access must be segmented without slowing collaboration.
Shortage of domain-specific physics-based modelling expertise
OECD surveys indicate 67% of European SMEs cite skills scarcity as the primary adoption barrier. Building a turbine twin demands aerodynamics, materials science, and control-theory knowledge in addition to software skills. Emerging-market firms struggle more, pushing up consulting costs and prolonging time-to-value. Academic-industry consortia are launching micro-credential courses, yet the near-term talent gap remains a drag on scale-up.
Segment Analysis
By Application: Manufacturing retains the lead while Oil and Gas accelerates
Manufacturing contributed 35.8% of the digital twin market in 2024 thanks to embedded IIoT sensors, predictive maintenance programs, and continuous-improvement cultures. Automotive and electronics plants deploy line-level twins to analyze takt-time fluctuations and quality-yield patterns, trimming scrap rates by double digits. Energy-efficiency gains add another payback layer, particularly in resource-intensive metallurgy and cement operations. The segment is forecast to expand steadily, preserving its quantitative edge even as other verticals catch up.
Oil and Gas, though smaller today, is projected to grow at a 29.3% CAGR to 2030 as offshore operators require remote inspection and fault-isolation capabilities. The upstream segment deploys reservoir twins that integrate seismic data and production logs, allowing engineers to simulate well-workover scenarios before mobilizing rigs. Midstream companies apply pipeline twins for leak detection, while downstream refineries like Shell have documented 20% unplanned downtime reductions using twins verified by DNV standards. Government decarbonization targets further propel adoption as twins optimize flare minimization and heat-integration strategies. Across both segments, AI-assisted scenario testing elevates twins from monitoring to decision-support systems, reinforcing their share of total deployments.
Note: Segment shares of all individual segments available upon report purchase
By Component: Solutions dominate yet services take off
The solutions category—software platforms, physics engines, and connected hardware—accounted for 63.6% of spending in 2024 as companies acquired core capabilities. Vendors bundle modeling libraries with visualization engines so process engineers can assemble replicas without coding from scratch. Licensing models are shifting to consumption-based tiers, broadening access among tier-two suppliers.
Services, however, are scaling faster at a 31.4% CAGR. Implementation consultancies align data pipelines, create semantic models, and validate simulation fidelity. Managed-service contracts monitor twin health metrics, apply patches, and tune algorithms for drift, yielding predictable OPEX for asset owners. As outcome-based agreements proliferate—Rolls-Royce TotalCare guarantees engine uptime backed by twin analytics—service partners assume more risk, tying fees to efficiency gains rather than billable hours[2]Rolls-Royce TotalCare Overview,” Rolls-Royce Holdings plc, rolls-royce.com. This model strengthens customer loyalty and encourages continuous platform enhancements.
By Deployment Mode: Cloud gains ground despite on-premises predominance
On-premises architectures held 55.7% of the digital twin market size in 2024 because operators of critical infrastructure prioritize data custody and deterministic latency. Utilities and aerospace primes, governed by strict export-control rules, maintain local clusters where models interact with PLCs in microseconds.
Cloud, advancing at 32.8% CAGR, benefits from hyperscalers’ security certifications and elastic compute. Azure Digital Twins and AWS IoT TwinMaker offer pre-built ontologies and time-series databases, cutting provisioning time from months to days. Hybrid models route sensitive control loops to the factory edge while streaming aggregated telemetry to regional clouds for AI training. Vendors embed policy-based data-placement tools so compliance officers specify residency constraints, balancing resilience with sovereignty.
By Enterprise Size: SMEs emerge as the fastest movers
Large enterprises held 68.12% share in 2024, leveraging multi-disciplinary teams and sizable capex to create plant-wide twins. Early adopters have now moved into second-generation projects, layering AI agents onto established models. Their focus is shifting toward cross-site federation, linking product-lifecycle twins with supply-chain twins for end-to-end visibility.
Small and medium enterprises are growing at 28.7% CAGR as SaaS pricing and low-code interfaces reduce entry barriers. Government vouchers in the EU’s Digital Europe Program offset pilot costs for SMEs in machinery and food processing. Regional clusters share best-practice templates, allowing a metal-fab shop in Italy to reuse a welding-robot cell twin designed by peers in Germany. Financing hurdles persist, but pay-per-use models and vendor backed leasing options are easing capital constraints, accelerating SME penetration.
Geography Analysis
North America commanded 38.4% of digital twin market revenue in 2024 driven by early Industry 4.0 rollouts, extensive aerospace programs, and robust venture funding for industrial SaaS. U.S. aviation regulators’ acceptance of simulation-based certification has spurred widespread twin investment among aircraft OEMs and Tier-1 suppliers. Energy majors in Canada and the United States deploy pipeline and LNG terminal twins to cut methane leak rates, aligning with tightening environmental policy. Cloud adoption is particularly strong due to mature cyber-insurance frameworks and standardized data-protection mandates.
Asia-Pacific posts the highest CAGR at 27.2%, supported by government megaprojects. China’s Digital China Construction plan mandates urban digital twins for new infrastructure, creating large procurement pipelines for domestic and foreign vendors. India’s Sangam Digital Twin scheme integrates network twin capability into nationwide telecom upgrades as the country moves toward 6G readiness. Japan’s NTT Digital Twin Computing Initiative supports city-scale replicas that feed transportation and disaster-response algorithms[3]NTT Corporation, “Digital Twin Computing Initiative,” ntt.com. South Korea and Singapore push smart-factory and smart-port pilots, emphasizing real-time carbon-footprint tracking. The region’s supply-chain centrality means lessons learned here propagate quickly to global OEMs.
Europe advances steadily as regulatory imperatives take center stage. The digital product passport forces manufacturers to embed traceability across product life cycles, effectively making a lightweight twin mandatory for high-volume goods. Germany’s Plattform Industrie 4.0 provides standardized administration shell guidelines, reducing integration overhead for SMEs. France invests in virtual shipyard twins to maintain competitive edge in naval construction, while the Nordics use building twins to meet net-zero codes. The Middle East and Africa remain nascent but promising: the UAE and Saudi Arabia are piloting oil-field twins and giga-project city twins, seeking efficiency and sustainability benefits prior to large-scale expansion.
Competitive Landscape
Market concentration remains moderate. Siemens bolstered its portfolio by acquiring Altair Engineering for USD 10.6 billion in 2024, merging simulation depth with its Xcelerator platform. Dassault Systèmes continues to integrate Modelica libraries into 3DEXPERIENCE to capture mechanical and systems co-simulation workflows. PTC positions ThingWorx and Kepware as plug-and-play data spines for mid-market manufacturers. ANSYS focuses on fidelity, embedding reduced-order models that speed runtime without sacrificing accuracy. Microsoft, AWS, and Google vie for platform mindshare by rolling out managed twin services with built-in connectors to their broader cloud ecosystems.
Strategic partnerships shape competition. NVIDIA works with KION and Accenture to deliver warehouse automation twins that harness GPU-accelerated physics for real-time pallet routing. Capgemini’s purchase of Unity’s services arm gives it immersive visualization chops to differentiate in client bids. Palantir leverages Foundry to create energy-sector twins for BP, blending OT data with financial and emissions metrics. Smaller vendors target vertical niches: healthcare-focused twin platforms mesh imaging, sensor telemetry, and patient records to enable personalized treatment simulations. Standard fragmentation persists; thus, vendors that support ISO 23247, IEEE 1451, and AML interchange stand out by lowering customer lock-in fears.
Price competition is limited, as buyers value reliability over pure license cost. Instead, vendors jockey on total-cost-of-ownership metrics, emphasizing faster go-live and reduced downtime. Generative AI infused into twins emerges as a new battleground: providers that embed proactive scenario generation and automated root-cause analysis capture premium margins. MandA activity is expected to continue as platform suppliers seek complementary analytics, visualization, and security assets, gradually tightening the competitive field.
Digital Twin (DT) Industry Leaders
-
General Electric Company
-
IBM Corporation
-
Siemens AG
-
Dassault Systèmes SE
-
PTC Inc.
- *Disclaimer: Major Players sorted in no particular order
Recent Industry Developments
- March 2025: Siemens and Microsoft expanded their partnership to co-develop Industrial Foundation Models that infuse AI into digital twins for autonomous optimization.
- February 2025: Capgemini closed its acquisition of Unity’s Digital Twin Professional Services arm to boost real-time 3D implementation capacity.
- January 2025: KION Group, NVIDIA, and Accenture partnered to create AI-driven warehouse digital twins for logistics automation.
- January 2025: Siemens and UL Solutions achieved the first product certification via digital twin simulation with minimal physical testing for the SINAMICS G220 drive.
Global Digital Twin (DT) Market Report Scope
A digital twin is a virtual simulation that accurately replicates a physical object. The digital twin market has been defined based on the revenues generated from the software and services used in various applications such as oil and gas, manufacturing, automobile, aerospace, and other end users around the globe.
The digital twin market is segmented by application (manufacturing, energy and power, aerospace, oil and gas, automobile, and other applications) and geography (North America [United States, Canada], Europe [United Kingdom, Germany, France, and the Rest of Europe], Asia-Pacific [China, Japan, India, and the Rest of Asia-Pacific], and the Rest of the World). The market sizes and forecasts are provided in terms of value in USD for all the above segments.
| By Application | Manufacturing | |||
| Energy and Power | ||||
| Aerospace and Defense | ||||
| Oil and Gas | ||||
| Automotive | ||||
| Others | ||||
| By Component | Solutions/Platforms | |||
| Services | ||||
| By Deployment Mode | On-premises | |||
| Cloud | ||||
| By Enterprise Size | Large Enterprises | |||
| Small and Medium Enterprises (SMEs) | ||||
| By Geography | North America | United States | ||
| Canada | ||||
| Mexico | ||||
| South America | Brazil | |||
| Argentina | ||||
| Rest of South America | ||||
| Europe | United Kingdom | |||
| Germany | ||||
| France | ||||
| Italy | ||||
| Spain | ||||
| Nordics | ||||
| Rest of Europe | ||||
| Middle East and Africa | Middle East | Saudi Arabia | ||
| United Arab Emirates | ||||
| Turkey | ||||
| Rest of Middle East | ||||
| Africa | South Africa | |||
| Egypt | ||||
| Nigeria | ||||
| Rest of Africa | ||||
| Asia-Pacific | China | |||
| India | ||||
| Japan | ||||
| South Korea | ||||
| ASEAN | ||||
| Australia | ||||
| New Zealand | ||||
| Rest of Asia-Pacific | ||||
| Manufacturing |
| Energy and Power |
| Aerospace and Defense |
| Oil and Gas |
| Automotive |
| Others |
| Solutions/Platforms |
| Services |
| On-premises |
| Cloud |
| Large Enterprises |
| Small and Medium Enterprises (SMEs) |
| North America | United States | ||
| Canada | |||
| Mexico | |||
| South America | Brazil | ||
| Argentina | |||
| Rest of South America | |||
| Europe | United Kingdom | ||
| Germany | |||
| France | |||
| Italy | |||
| Spain | |||
| Nordics | |||
| Rest of Europe | |||
| Middle East and Africa | Middle East | Saudi Arabia | |
| United Arab Emirates | |||
| Turkey | |||
| Rest of Middle East | |||
| Africa | South Africa | ||
| Egypt | |||
| Nigeria | |||
| Rest of Africa | |||
| Asia-Pacific | China | ||
| India | |||
| Japan | |||
| South Korea | |||
| ASEAN | |||
| Australia | |||
| New Zealand | |||
| Rest of Asia-Pacific | |||
Key Questions Answered in the Report
What is the current size of the digital twin market?
The digital twin market size is USD 36.19 billion in 2025 and is projected to reach USD 180.28 billion by 2030 at a 37.87% CAGR.
Which segment contributes the largest share to the digital twin market?
Manufacturing leads with 35.8% market share in 2024, driven by smart-factory programs and mature IIoT infrastructure.
Which region is expected to grow the fastest?
Asia-Pacific is forecast to post a 27.2% CAGR through 2030, supported by large-scale government initiatives in China, India, and Japan.
Why are services growing faster than software platforms?
As deployments scale, enterprises seek integration, data-governance, and performance-management expertise, pushing services to a 31.4% CAGR.
What are the main barriers to wider adoption?
Cyber-physical security vulnerabilities and a shortage of domain-specific modeling talent are the top constraints, collectively shaving more than 7% off potential growth.

