Online Salvage Auction Market Size and Share
Market Overview
| Study Period | 2019 - 2030 |
|---|---|
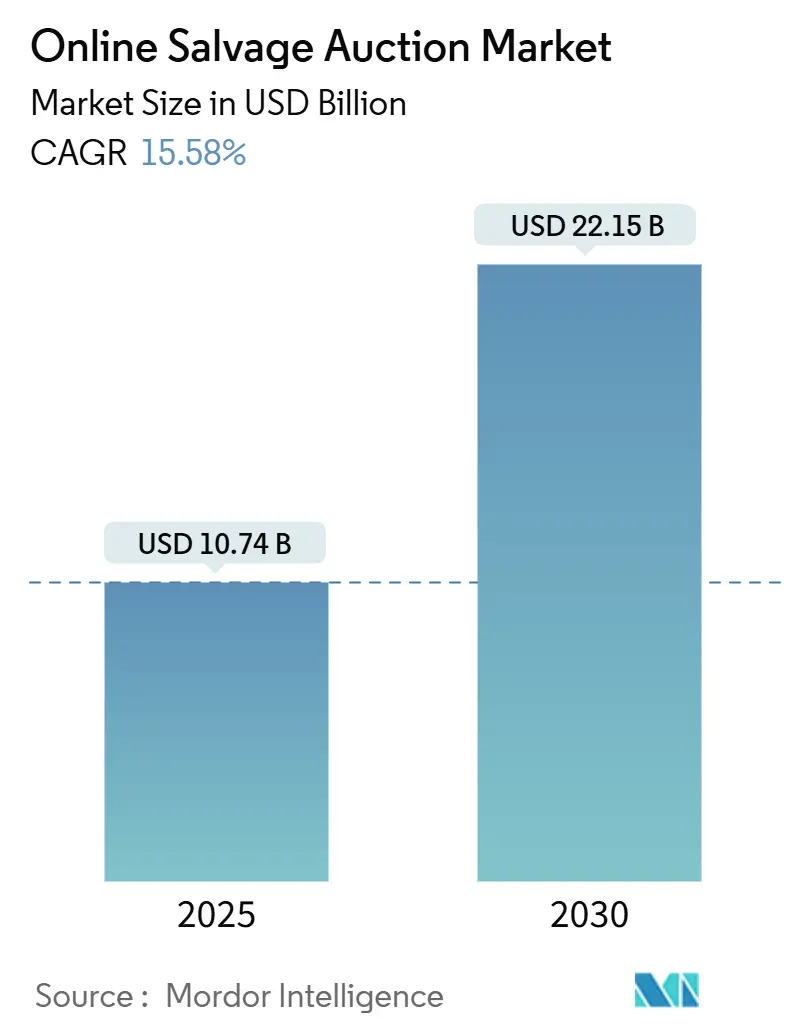
| Market Size (2025) | USD 10.74 Billion |
| Market Size (2030) | USD 22.15 Billion |
| Growth Rate (2025 - 2030) | 15.58% CAGR |
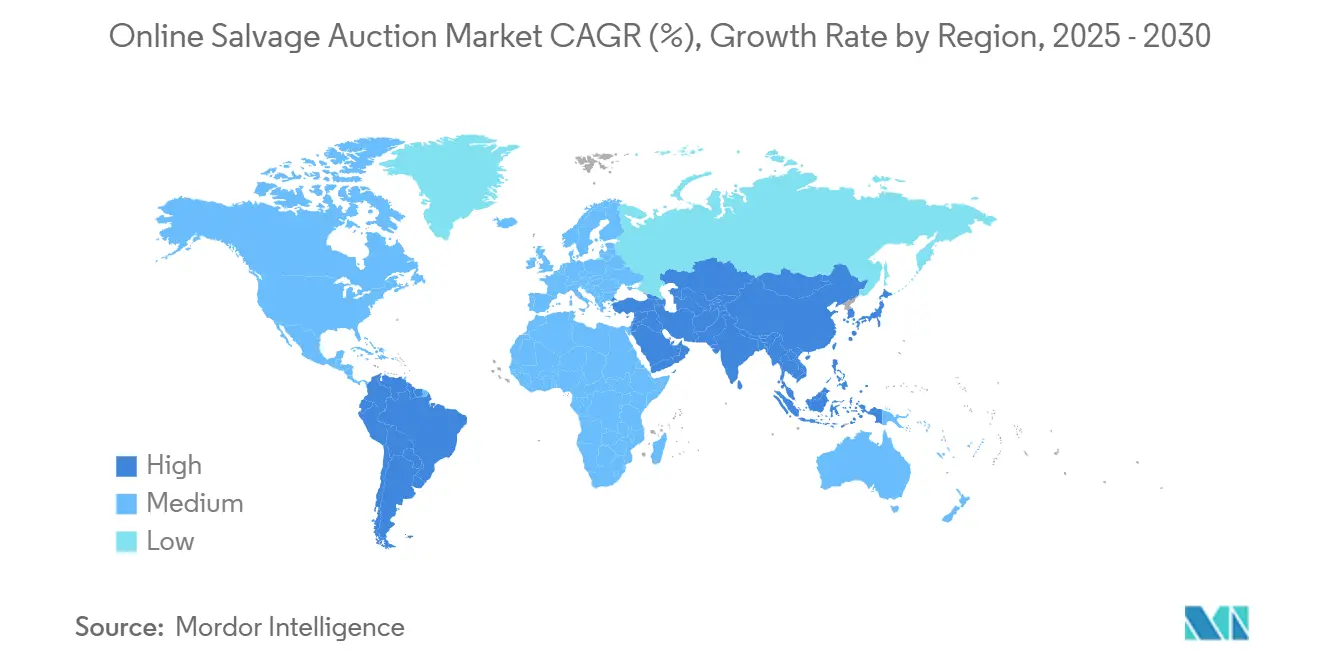
| Fastest Growing Market | Asia Pacific |
| Largest Market | North America |
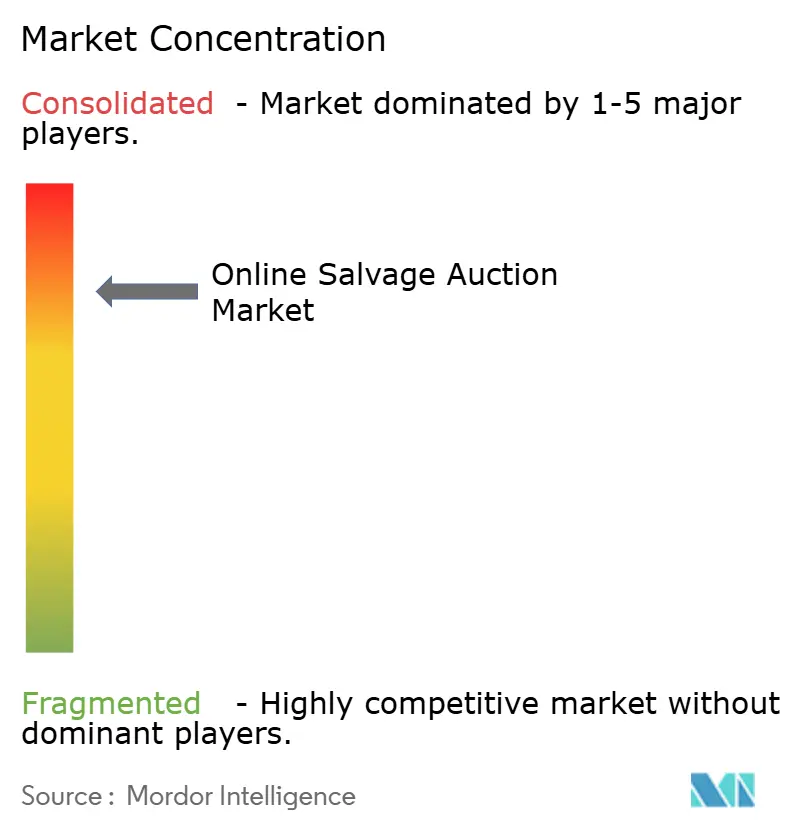
| Market Concentration | High |
Major Players *Disclaimer: Major Players sorted in no particular order Image © Mordor Intelligence. Reuse requires attribution under CC BY 4.0. | |
Online Salvage Auction Market Analysis by Mordor Intelligence
The online salvage auction market size reached USD 10.74 billion in 2025 and is forecast to climb to USD 22.15 billion by 2030, reflecting a 15.58% CAGR. Continued growth stems from higher total-loss declarations triggered by complex electronics, climate-related catastrophes that funnel vehicles into digital channels, and the expanding reach of mobile bidding technologies. Platform operators gain pricing power from artificial-intelligence-driven valuations, while blockchain verification and multilingual apps attract cross-border buyers, deepening liquidity across inventory classes. Elevated total-loss frequency has established insurers as dominant consignors, yet fleet owners, rental companies, and repossession agencies are accelerating direct dispositions, providing new revenue streams. Competitive intensity remains concentrated because the leading two firms control physical storage, proprietary marketplaces, and long-term insurance relationships that deter new entrants. Meanwhile, regional opportunities widen in Asia-Pacific and South America, where vehicle ownership and digital commerce adoption outpace legacy remarketing infrastructure.
Key Report Takeaways
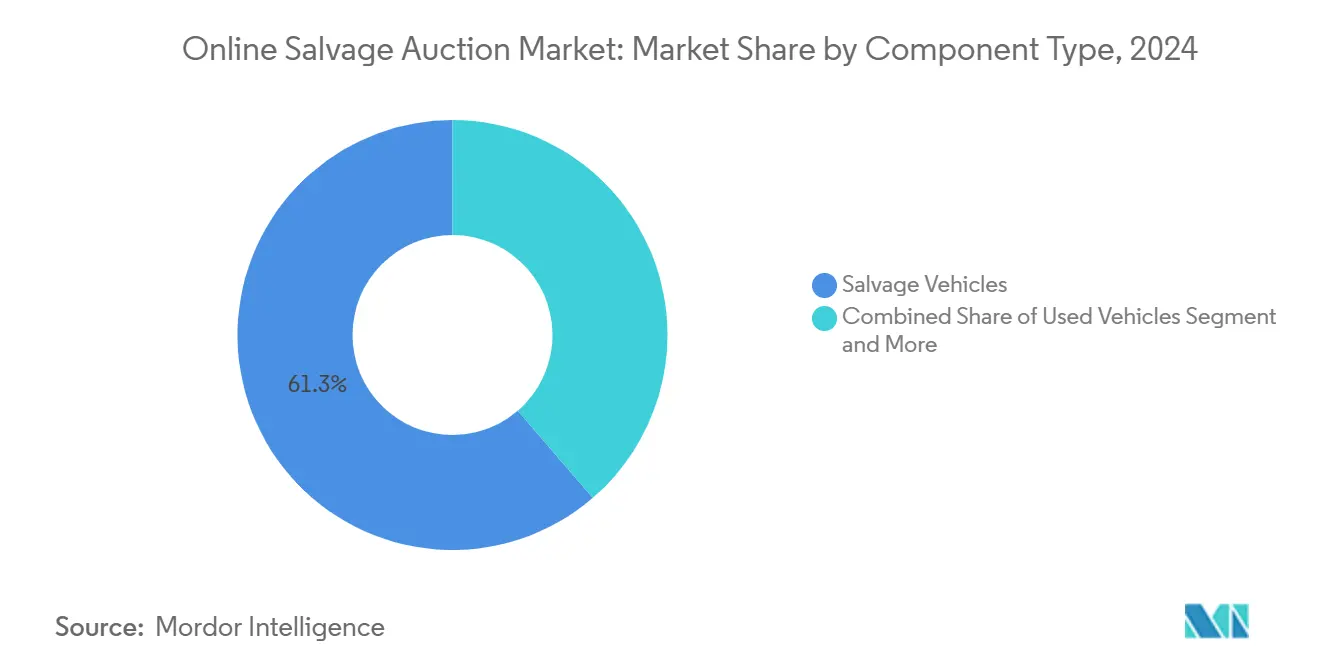
- By component, salvage vehicles held 61.32% of the online salvage auction market share in 2024; title and documentation services are advancing at a 15.78% CAGR through 2030.
- By application, banks and financial services institutions held a 29.25% share of the online salvage auction market in 2024, while repossession companies are expanding at a 16.26% CAGR to 2030.
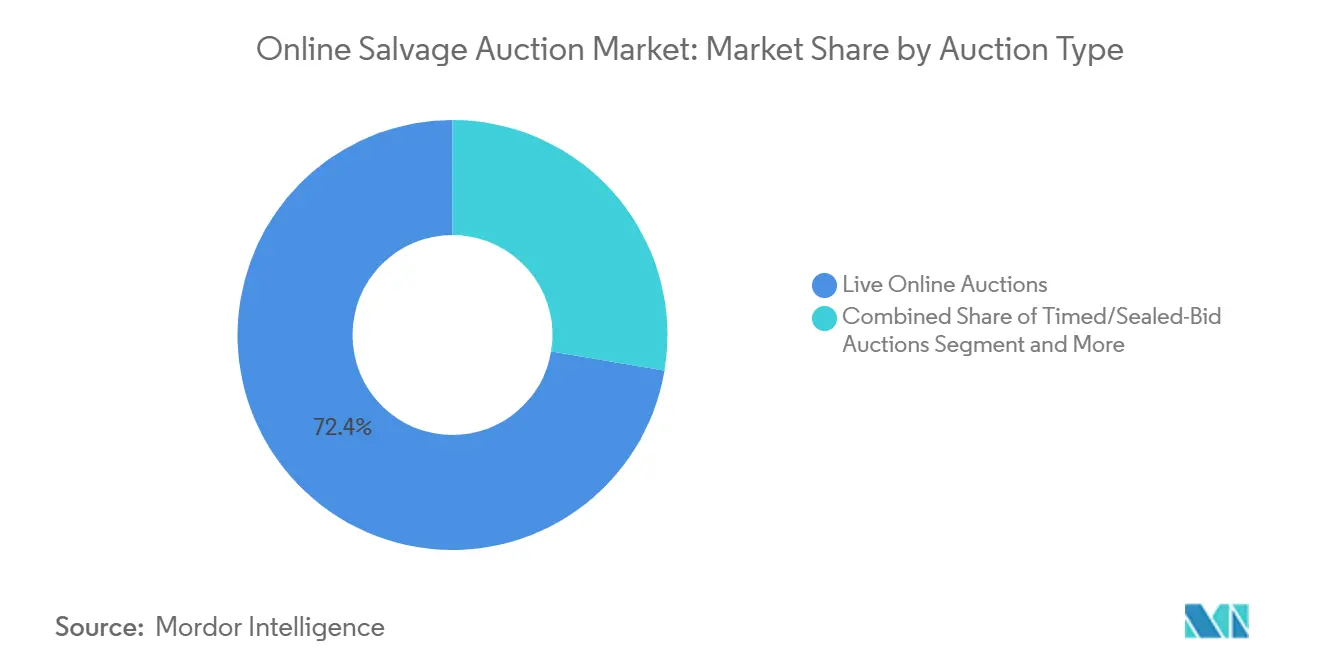
- By auction type, live online formats led with 72.43% revenue share in 2024; timed and sealed-bid events are projected to grow at a 15.82% CAGR through 2030.
- By vehicle ownership source, insurance carriers supplied 79.82% of all consignments in 2024, whereas fleet and rental sellers are rising at a 13.82% CAGR over the forecast horizon.
- By geography, North America commanded a 44.27% share in 2024; Asia-Pacific is on track for a 16.28% CAGR, the fastest worldwide.
Global Online Salvage Auction Market Trends and Insights
Drivers Impact Analysis*
| Driver | (~) % Impact on CAGR Forecast | Geographic Relevance | Impact Timeline |
|---|---|---|---|
| Rising Total-Loss Rates | +3.2% | Global, with highest impact in North America and Europe | Medium term (2-4 years) |
| Shift to Digital Salvage Platforms | +2.8% | North America and Europe primary, expanding to APAC | Long term (≥ 4 years) |
| Auction Volume Surges from Disasters | +2.7% | Global, with highest impact in climate-vulnerable regions | Short term (≤ 2 years) |
| End-of-Life EV Battery Salvage | +2.4% | Global, concentrated in EV adoption markets | Long term (≥ 4 years) |
| Multilingual Apps for Cross-Border Bidding | +2.1% | Global, with early gains in Asia-Pacific, Latin America | Medium term (2-4 years) |
| Blockchain VIN Verification | +1.8% | Global, early adoption in North America and Europe | Medium term (2-4 years) |
| Source: Mordor Intelligence | |||
Rising Total-Loss Frequency from Complex Vehicle Electronics
Total-loss frequency has been growing in recent years, as advanced driver assistance systems and integrated infotainment make collision repairs costlier than vehicle values for models over seven years old. Electric vehicles require nearly four additional labor hours and 30% higher labor costs versus internal-combustion cars, pushing insurers toward faster salvage disposal. An aging fleet—average age 12.7 years—magnifies the issue because older cars with premium electronics become uneconomical to fix. The structural rise in total-loss counts feeds consistent supply into the online salvage auction market, boosting platform volumes and strengthening fee-based revenue visibility. Established operators gain negotiating leverage with insurers by guaranteeing yard capacity and accelerated cycle times that outclass fragmented local yards.
End-of-Life EV Battery Salvage Creating High-Value Parts Stream
ASEAN markets could see 2,166 GWh of reusable batteries in 2040, turning damaged EVs into lucrative commodities for nickel, cobalt, and lithium extraction[1]“ASEAN Battery Outlook,”, ERIA, eria.org. Veolia and other recyclers are commissioning battery processing plants across Europe to meet mandatory recycled-content quotas in new packs. Specialist lots command premium bids on the online salvage auction market because recyclers value pure metal streams over cosmetic vehicle conditions. Auctioneers respond with fire-suppression yards, battery-state grading tools, and certified hazmat handling to comply with safety codes, enhancing service revenue resilience.
Blockchain-Based VIN Provenance Boosting Buyer Trust
Immutable ledgers verify title history, odometer accuracy, and export compliance, a pivotal assurance for cross-border transactions where domestic databases are inaccessible. Smart contracts automate payment release upon confirmed ownership transfer, cutting settlement from days to minutes and lowering fraud risk. Vehicles with authenticated records sell at tighter bid-ask spreads, reflecting higher buyer confidence and boosting platform take-rates. Early deployments in North America and Europe create reference templates that APAC regulators increasingly reference when drafting digital-title laws.
Climate-Driven Catastrophe Losses Flooding Auction Pipelines
Hurricanes, floods, and wildfires cause episodic surges of tens of thousands of total-loss units, stressing yard capacity. IAA’s catastrophe response uses predictive weather analytics, mobile tow apps, and remote-inspection drones to process excess volumes without degrading service time. Container freight rates jumped 120% between October 2023 and June 2024 after Red Sea disruptions, illustrating the secondary logistical pressures catastrophes impose on global vehicle redistribution[2]“Container Shipping Market Review 2024,”, UNCTAD, unctad.org. Platforms that scale transport, storage, and merchandising rapidly capture incremental fee revenue and reinforce insurer reliance.
Restraints Impact Analysis*
| Restraint | (~) % Impact on CAGR Forecast | Geographic Relevance | Impact Timeline |
|---|---|---|---|
| Cross-Border Salvage-Title Gaps | -2.1% | Global, with highest friction in North America-Europe corridors | Long term (≥ 4 years) |
| Odometer & Title Fraud | -1.8% | Global, concentrated in markets with weak verification systems | Medium term (2-4 years) |
| Freight & Logistics Cost Pressure | -1.7% | Global, with highest impact on cross-border transactions | Short term (≤ 2 years) |
| EV Battery Fire Safety Costs | -1.6% | Global, early impact in EV-mature markets | Medium term (2-4 years) |
| Source: Mordor Intelligence | |||
Odometer and Title Fraud Risks Undermining Price Realization
Post-pandemic fraud spikes prompted the FTC’s July 2024 Combating Auto Retail Scams Rule, mandating accurate pricing disclosures and prohibiting misrepresentation. Texas follows with July 2025 electronic-title and record-keeping rules for salvage dealers[3]“Salvage Dealer Regulations,”, Texas Secretary of State, sos.texas.gov. Enhanced paperwork elevates cost structures while persistent fraud fears keep international buyers cautious, widening bid-offer spreads and depressing realized prices on the online salvage auction market.
Rising Freight and Logistics Costs Squeezing Arbitrage Margins
DAT’s New Rate Differential shows shipper contract rates overtaking spot quotes in 2025, signaling structural carrier pricing power that raises inland transport fees. Simultaneous ocean-freight volatility tied to geopolitical disruptions strains budgets for exporters of low-value units. Higher freight erodes the arbitrage that fuels cross-regional trade, reducing bidder appetite and curbing liquidity on the online salvage auction market.
*Our forecasts treat driver/restraint impacts as directional, not additive. The impact forecasts reflect baseline growth, mix effects, and variable interactions.
Segment Analysis
By Components: Services Monetize Compliance Complexity
Salvage vehicles generated 61.32% of 2024 revenue, cementing them as the inventory backbone that sustains daily auction cadence on the online salvage auction market. Still, administrative services such as title processing, inspection, and logistics are outpacing unit growth at a 15.78% CAGR, underpinning a pivot toward fee diversification that insulates platforms from cyclical volume swings. Title Express handled nearly 1 million instruments in 2024, illustrating how compliance outsourcing transforms cost centers into profit pools. AI-driven inspection suites like ACV’s ClearCar deliver precise condition grades, fostering buyer trust and enabling higher hammer prices that boost commission per vehicle.
The shift enlarges take-rate resilience because service bundles command predictable per-transaction fees even when consignments ebb. As regulators elevate paperwork standards, platforms with integrated documentation escalate market share, funneling more consignors into their ecosystems. Conversely, smaller regional yards face rising compliance costs without offsetting fee income, intensifying consolidation pressures that benefit scale leaders in the online salvage auction industry.


By Application: Repossession Surges Amid Economic Strain
Banks and financial institutions captured 29.25% of the online salvage auction market size in 2024, using auction portals to liquidate lease maturities and loan-loss recoveries swiftly. Integrated payment modules like ACV Capital streamline settlement and line-of-credit access, encouraging higher bidding limits and quicker asset turnover. Repossession companies, however, are the growth standout at a 16.26% CAGR as rising consumer delinquencies push more collateral into auctions.
Economic headwinds amplify recovery volumes, and specialized repossession inventory requires rapid sale to offset storage accruals. Auctioneers provide immediate nationwide buyer exposure, circumventing regional wholesale markets and raising sale proceeds. This diversification lowers platforms’ dependence on insurance cycle volatility and widens data assets that refine predictive pricing algorithms across inventory types, reinforcing moats within the online salvage auction market.
By Auction Type: Timed Events Gain Strategic Bidders
Live online sessions dominated with a 72.43% share in 2024, favored for real-time excitement and discover-as-you-bid transparency that heightens final prices. Yet timed and sealed-bid formats are scaling at 15.82% CAGR because certain buyers prefer deliberate assessment windows and strategic bid placement without time pressure. ADESA Clear melds AI valuations with extended bidding to furnish data-rich listings that mitigate buy-side risk for international traders.
Hybrid models allow consignors to route inventory into the format that maximizes clearance velocity and margin. Timed events also accommodate global buyers across disparate time zones, supporting wider participation and stabilizing price discovery. As platforms fine-tune format algorithms, they enhance liquidity across vehicle classes, deepening participation that enlarges the online salvage auction market share for data-augmented, multi-format operators.
By Vehicle Ownership Source: Fleet Sellers Diversify Supply
Insurance carriers still produced 79.82% of consignments in 2024, anchoring predictable inflow critical to platform capacity planning. Copart’s long-term contracts with Allstate and Nationwide exemplify structural capture of carrier volumes that deter rival bidding platforms. Aligned with cost-optimization drives, corporate fleet and rental owners are onboarding directly at a 13.82% CAGR, bypassing physical wholesalers to harvest higher residual values through direct digital dispositions.
Non-insurance volumes reduce reliance on catastrophe cycles and enrich the inventory mix with late-model units that are attractive to export buyers. Platforms respond by customizing fleet remarketing portals, guaranteed transport, and analytic dashboards that benchmark recovery rates. The broadened consignor base fortifies network effects, sustaining inventory diversity that draws persistent bidder engagement on the online salvage auction market.
Geography Analysis
North America retained absolute leadership with 44.27% revenue share in 2024, underpinned by mature insurance outsourcing models, a dense yard network exceeding 200 sites, and early adoption of mobile bidding. The region benefits from legal clarity on digital signatures and electronic titles that streamline cycle times. Live auctions dominate here because broadband penetration supports real-time streaming, and regulatory frameworks incentivize rapid total-loss disposal. Government emissions policies for model years 2027-2032 will funnel more hybrid and EV units into salvage channels, broadening high-voltage inventory categories.
Asia-Pacific, registering the fastest 16.28% CAGR, is propelled by surging vehicle ownership, digital-commerce enthusiasm, and growing insurance penetration. Japan’s booming export pipeline and China’s 35% EV sales mix spawn specialized salvage niches, including battery-grade dismantling; these require the sophisticated condition grading offered by established platforms, stimulating their regional expansion. Mobile-first consumer behavior reduces adoption friction, and supportive fintech ecosystems ease international payments, accelerating participant onboarding to the online salvage auction market.
Europe remains sizable but regulation-heavy, balancing circular-economy mandates with cross-border compliance hurdles. EU battery directives make high-value EV components a strategic salvage segment and incentivize technologically equipped operators. Meanwhile, the Middle East shows rapid digital-channel adoption, with UAE buyers starting car searches online and becoming open to EVs, making it a vibrant re-export hub. South America and Africa are emerging frontiers; MercadoLibre’s growing digital auto sales signal underlying demand, yet logistics bottlenecks and currency volatility require tailored risk mitigation. Together, these markets offer a multi-decade runway for the online salvage auction market as infrastructure and regulatory frameworks mature.

Competitive Landscape
The arena functions as a duopoly: Copart, IAA trails closely, together steering majority of volumes. Scale translates into yard density, exclusive insurer contracts, and proprietary data platforms that yield durable cost and network advantages. Copart’s free cash flow surpassed USD 1 billion in 2024, funding AI-driven pricing engines, blockchain title pilots, and the acquisition of Purple Wave to diversify into heavy equipment. IAA counters with catastrophe-response tech and multilingual mobile interfaces that deepen global bidder pools.
Disruptive entrants focus on dealer wholesale segments; ACV Auctions lifted marketplace GMV to USD 2.5 billion in 2024 by offering clear-car valuation, mobile inspections, and same-day funding, although it still holds less share. Venture-backed niche players target specialty inventory such as classic cars or EV batteries, leveraging lightweight digital platforms without extensive yard ownership. Yet regulatory compliance, capital-intensive storage requirements, and trusted-seller relationships remain formidable entry hurdles that protect incumbents in the online salvage auction market.
Strategic maneuvers center on technology: AI that predicts optimal sale timing, 360-degree imaging for remote appraisal, and blockchain for VIN provenance. Cross-border partnerships enable localized last-mile logistics, while white-label portals are offered to fleets seeking branded disposal channels. Over the forecast period, consolidation is likely among mid-tier operators unable to finance compliance upgrades, further solidifying dominance by the top two firms and selectively by tech-enabled challengers carving high-margin niches.
Online Salvage Auction Industry Leaders
Copart Inc.
IAA Holdings LLC
Manheim
Ritchie Bros. Auctioneers
ACV Auctions Inc.
- *Disclaimer: Major Players sorted in no particular order

Recent Industry Developments
- February 2025: ADESA expanded its ADESA Clear platform with AI recommendations and wider geographic reach, combining Carvana technology with wholesale auction expertise.
- January 2025: ACV Auctions debuted ClearCar appraisal, QuickQuote lead sourcing, and ACV MAX mobile tools at the NADA 2025 show, enhancing real-time vehicle valuations.


Global Online Salvage Auction Market Report Scope
| Products | Used Vehicles |
| Salvage Vehicles | |
| Seized Vehicles | |
| Services | Auction Platform Fees |
| Title and Documentation Services | |
| Inspection and Logistics Services |
| Banks and Financial Service Institutions |
| Original Equipment Manufacturers (OEMs) |
| Fleet Management Companies |
| Rental Agencies |
| Repossession Companies |
| Live Online Auctions |
| Timed / Sealed-Bid Auctions |
| Buy-Now Fixed-Price Listings |
| Insurance Carriers |
| Non-Insurance Fleet & Rental |
| Franchised / Independent Dealerships |
| Government and Municipality |
| Private / Individual Sellers |
| North America | United States |
| Canada | |
| Mexico | |
| Europe | Germany |
| United Kingdom | |
| France | |
| Italy | |
| Spain | |
| Rest of Europe | |
| Asia-Pacific | China |
| Japan | |
| India | |
| South Korea | |
| Australia | |
| Rest of Asia-Pacific | |
| South America | Brazil |
| Argentina | |
| Rest of South America | |
| Middle East | Turkey |
| Saudi Arabia | |
| United Arab Emirates | |
| Rest of Middle East | |
| Africa | South Africa |
| Nigeria | |
| Kenya | |
| Rest of Africa |
| By Components | Products | Used Vehicles |
| Salvage Vehicles | ||
| Seized Vehicles | ||
| Services | Auction Platform Fees | |
| Title and Documentation Services | ||
| Inspection and Logistics Services | ||
| By Application | Banks and Financial Service Institutions | |
| Original Equipment Manufacturers (OEMs) | ||
| Fleet Management Companies | ||
| Rental Agencies | ||
| Repossession Companies | ||
| By Auction Type | Live Online Auctions | |
| Timed / Sealed-Bid Auctions | ||
| Buy-Now Fixed-Price Listings | ||
| By Vehicle Ownership Source | Insurance Carriers | |
| Non-Insurance Fleet & Rental | ||
| Franchised / Independent Dealerships | ||
| Government and Municipality | ||
| Private / Individual Sellers | ||
| By Geography | North America | United States |
| Canada | ||
| Mexico | ||
| Europe | Germany | |
| United Kingdom | ||
| France | ||
| Italy | ||
| Spain | ||
| Rest of Europe | ||
| Asia-Pacific | China | |
| Japan | ||
| India | ||
| South Korea | ||
| Australia | ||
| Rest of Asia-Pacific | ||
| South America | Brazil | |
| Argentina | ||
| Rest of South America | ||
| Middle East | Turkey | |
| Saudi Arabia | ||
| United Arab Emirates | ||
| Rest of Middle East | ||
| Africa | South Africa | |
| Nigeria | ||
| Kenya | ||
| Rest of Africa | ||


Key Questions Answered in the Report
What is the projected value of the online salvage auction market by 2030?
The sector is expected to reach USD 22.15 billion by 2030, supported by a 15.58% CAGR.
Which region is growing fastest in online salvage auctions?
Asia-Pacific leads with a 16.28% CAGR thanks to rising vehicle ownership, expanding insurance coverage, and digital commerce adoption.
Who are the dominant players in online salvage auctions?
Copart and IAA jointly control about major share of global volumes, operating proprietary platforms and expansive yard networks.
How do timed auctions differ from live online auctions?
Timed events give buyers longer evaluation windows and suit cross-time-zone participants, while live auctions offer real-time competition and rapid price discovery.
What impact do EVs have on the salvage auction sector?
Damaged EVs introduce high-value battery recycling streams but also raise yard safety costs due to fire-risk management protocols
Page last updated on:


