
Digital Rights Management (DRM) Market Size and Share
Market Overview
| Study Period | 2020 - 2031 |
|---|---|
| Market Size (2026) | USD 6.93 Billion |
| Market Size (2031) | USD 11.76 Billion |
| Growth Rate (2026 - 2031) | 11.16 % |
| Fastest Growing Market | Asia Pacific |
| Largest Market | North America |
| Market Concentration | Medium |
Major Players
*Disclaimer: Major Players sorted in no particular order Image © Mordor Intelligence. Reuse requires attribution under CC BY 4.0. |
|
Digital Rights Management (DRM) Market Analysis by Mordor Intelligence
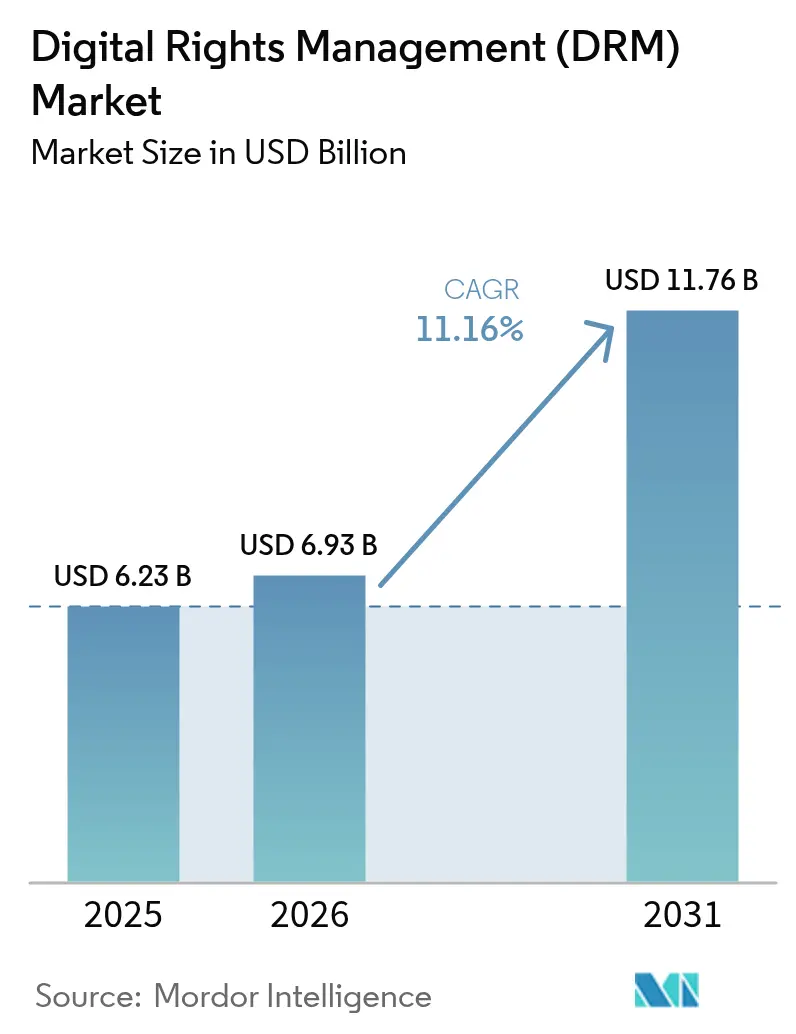
Digital Rights Management market size in 2026 is estimated at USD 6.93 billion, growing from 2025 value of USD 6.23 billion with 2031 projections showing USD 11.76 billion, growing at 11.16% CAGR over 2026-2031. This trajectory is anchored in enterprises’ heightened need to secure intellectual property as digital-first business models scale. The rapid uptick in OTT video subscriptions, permanent remote-work policies, and expanding AI-powered piracy threats collectively reinforce adoption of next-generation rights-protection platforms. Regulatory momentum around data-sovereignty and sector-specific cyber mandates also accelerates demand, while cloud deployment and multi-DRM architectures improve scalability and cost efficiency. North America’s mature regulatory environment sustains its leadership position, yet Asia Pacific’s mobile-first economies drive the fastest regional growth as government localization rules expand DRM use cases. Vendors that deliver seamless user experiences alongside strong encryption, blockchain-anchored licensing, and AI-based threat detection see the widest enterprise uptake.
Key Report Takeaways
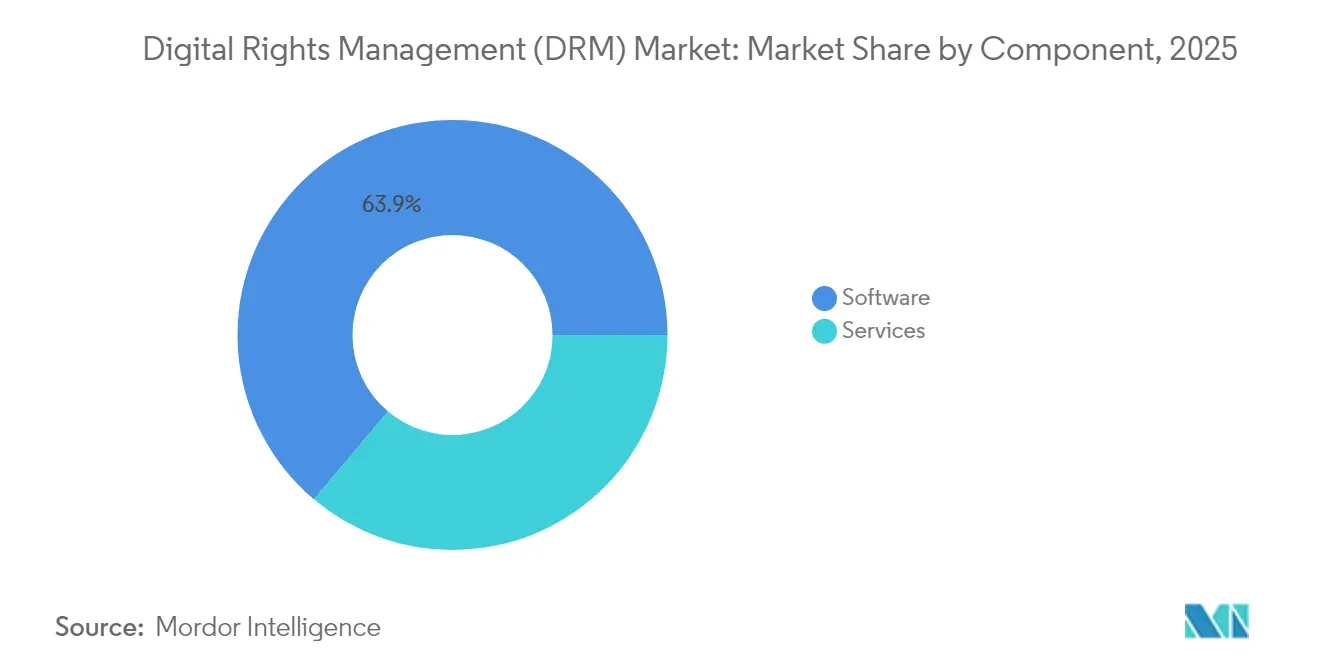
- By component, software dominated with 63.85% of Digital Rights Management market share in 2025, while services expanded at a 17.32% CAGR.
- By deployment mode, the cloud model accounted for 56.10% share of the Digital Rights Management market size in 2025 and is advancing at an 17.95% CAGR through 2031.
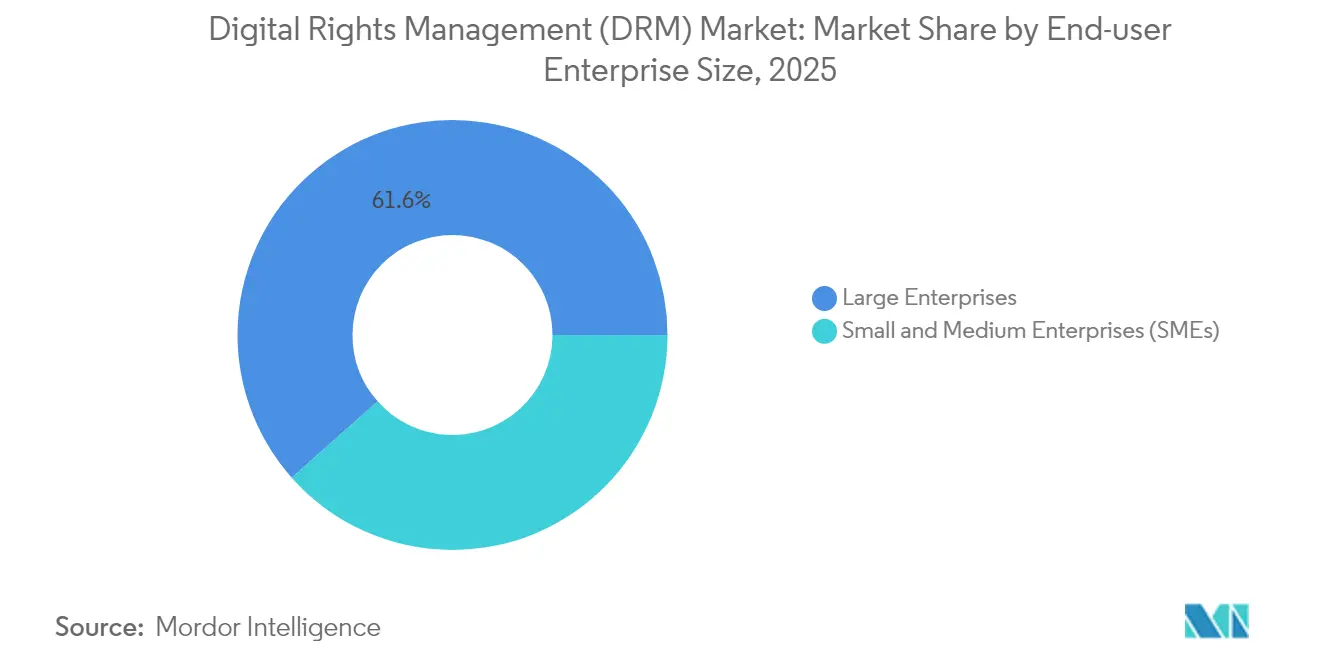
- By end-user enterprise size, large enterprises led with 61.55% share in 2025; SMEs recorded the highest projected CAGR at 19.18% to 2031.
- By end-user industry, BFSI captured 26.40% revenue share in 2025; healthcare is projected to post an 17.88% CAGR through 2031.
- By geography, North America retained 37.95% share in 2025, whereas Asia Pacific is forecast to grow at 15.94% CAGR through 2031.
Note: Market size and forecast figures in this report are generated using Mordor Intelligence’s proprietary estimation framework, updated with the latest available data and insights as of 2026.
Market Trends and Insights
Drivers Impact Analysis of Digital Rights Management (DRM) Market*
| Driver | (~) % Impact on CAGR Forecast | Geographic Relevance | Impact Timeline |
|---|---|---|---|
| Proliferation of OTT video and streaming subscriptions | +2.8% | Global, concentrated in North America and Asia Pacific | Medium term (2-4 years) |
| BYOD and remote-work data-security mandates | +2.1% | Global, particularly North America and Europe | Short term (≤ 2 years) |
| Rising digital-IP litigation and penalties | +1.7% | North America and Europe, expanding to Asia Pacific | Long term (≥ 4 years) |
| Government push for data-sovereignty compliance | +1.9% | Europe and Asia Pacific with spillover to other regions | Medium term (2-4 years) |
| Blockchain-anchored smart contracts for content monetization | +1.2% | Early adoption in North America | Long term (≥ 4 years) |
| Generative-AI-driven piracy deepfakes | +1.6% | Global, concentrated in content-heavy markets | Short term (≤ 2 years) |
| Source: Mordor Intelligence | |||
Proliferation of OTT Video and Streaming Subscriptions
OTT platforms distribute higher-value 4K and 8K assets that demand hardened encryption and multi-DRM strategies to span Widevine, FairPlay, and PlayReady. Live sports streaming intensifies low-latency protection requirements, especially across mobile-centric Asia Pacific audiences. Platform operators leverage adaptive bitrate streaming coupled with forensic watermarking to curb session hijacking. The diversity of connected devices from smart TVs to in-vehicle infotainment fuels demand for standards-based DRM that scales seamlessly across chipsets[1]Axinom. "Widevine on iOS." Accessed January 1, 2025. . Competitive differentiation now centers on delivering robust security without buffering or resolution downgrades, ensuring subscriber retention in an increasingly crowded content landscape.
BYOD and Remote-Work Data-Security Mandates
Permanent hybrid-work policies push DRM from content protection into file-centric data-security frameworks. Enterprises integrate Zero-Trust principles, requiring persistent encryption that travels with a document and authenticates user identity at every access point. Mobile-first DRM, exemplified by Fasoo’s GPS-aware screen-watermarking, safeguards data on unmanaged Android and iOS devices while feeding behavioral telemetry into security operations centers [2]Fasoo. "Mobile Document Security | Fasoo Enterprise DRM for Mobile." June 11, 2024. . Integration with identity-and-access-management platforms enables real-time revocation, meeting auditors’ insistence on demonstrable control. The driver is most pronounced in regulated verticals where fines for non-compliance escalate annually.
Rising Digital-IP Litigation and Penalties
Statutory damages and royalty disputes push content owners to deploy tamper-evident DRM to establish “reasonable protection” in court. Immutable blockchain-linked license records and automated royalty disbursement smart contracts safeguard creative assets while reducing collection-society overhead[3]Sharp, Amanda. "2023 ELI Writing Competition Runner-Up Essay: Addressing the Music Industry's Biggest Broken Record: Why Blockchain, Smart Contracts, and NFTs are An Unmatched Solution to the Music Industry's $424 Million Unmatched Royalty Problem." American Bar Association, February 2, 2024. . AI-generated derivative works further blur authorship lines, increasing the value of provenance tracking baked into DRM workflows. Cross-border lawsuits reveal enforcement complexity, motivating rights holders to adopt global license registries that harmonize regional compliance rules and automate takedown notices.
Government Push for Data-Sovereignty Compliance
Data-localization statutes in the EU, India, and Indonesia require content processing and key storage within national boundaries, reshaping DRM architecture. Providers now offer regional key vaults and policy-based routing to meet the EU’s evolving GDPR and the upcoming NIS2 cybersecurity directive. China’s compulsory DRM-enabled automotive broadcast receivers illustrate how government edicts can trigger mass hardware upgrades, with millions of cars shipping with DRM-capable chipsets. Vendors that bundle automated compliance reporting gain preference among multinational buyers that face simultaneous audits across jurisdictions.
Restraints Impact Analysis of Digital Rights Management (DRM) Market*
| Restraint | (~) % Impact on CAGR Forecast | Geographic Relevance | Impact Timeline |
|---|---|---|---|
| Persistent device/format incompatibilities | -1.4% | Global, affecting cross-platform deployments | Medium term (2-4 years) |
| User-experience backlash over intrusive controls | -1.1% | Global, concentrated in consumer-facing applications | Short term (≤ 2 years) |
| Open-source watermarking challenging proprietary DRM | -0.8% | Early impact in enterprise segments | Long term (≥ 4 years) |
| Quantum-computing threat to current encryption standards | -0.9% | High-security sectors worldwide | Long term (≥ 4 years) |
| Source: Mordor Intelligence | |||
Persistent Device/Format Incompatibilities
Ecosystem fragmentation forces content owners to juggle multiple DRM implementations as browser vendors deprecate legacy modules. Google’s discontinuation of Widevine CDM on iOS compels developers to integrate FairPlay for Apple hardware, doubling maintenance overhead. Older smart TVs and set-top boxes receive security patches irregularly, creating weak links in license enforcement chains. Enterprises with mixed mobile and desktop fleets struggle to standardize policy enforcement, elevating support costs and delaying rollout of new content formats.
User-Experience Backlash Over Intrusive Controls
Consumers voice frustration when resolution downgrades, offline-viewing limits, or screen-capture blocks hinder legitimate usage. Educational institutions cite fair-use concerns when DRM restricts copying excerpts for classroom discussion. Enterprise workers circumvent overly restrictive screen-watermarking by exporting sensitive slides to unsecured formats, inadvertently expanding attack surfaces. Vendors now experiment with friction-free watermarking and transparent encryption to reconcile usability with security expectations.
*Our forecasts treat driver/restraint impacts as directional, not additive. The impact forecasts reflect baseline growth, mix effects, and variable interactions.
Digital Rights Management (DRM) Market Segment Analysis
By Component:
Services Sustain the Fastest UpswingSoftware platforms retained 63.85% of Digital Rights Management market share in 2025, reflecting entrenched demand for integrated license servers, analytics dashboards, and rules engines. Services, however, posted a 17.32% CAGR as organizations turned to specialists for multi-DRM orchestration and blockchain integration. Managed-security providers bundle 24×7 license-server monitoring with rapid threat-intel updates, appealing to SMEs that lack in-house expertise.
Adobe’s Digital Media revenue of USD 4.23 billion in Q1 2025 underscores buyers’ willingness to invest in AI-infused DRM capabilities. Consulting engagements now extend beyond deployment into continuous compliance auditing, supporting a shift toward outcome-based service contracts. Over the forecast horizon, services are expected to bridge skills gaps as quantum-safe encryption pilots emerge, cementing their share of incremental expenditure.



By Deployment Mode:
Cloud Consolidates LeadershipThe cloud model represented 56.10% of Digital Rights Management market size in 2025 and is forecast to expand at 17.95% CAGR. Centralized license servers ease policy updates and scale elastically to support event-driven spikes such as live sports finals. IBM notes that 82% of data breaches occur in cloud venues, prompting enterprises to extend DRM controls into object-storage tiers and SaaS repositories.
Hybrid topologies flourish where creative assets remain on-premises for editing while distribution keys reside in regional clouds to satisfy localization mandates. Edge nodes embed lightweight DRM to secure 4K streams at sub-second latency, reducing buffering complaints in bandwidth-variable markets. On-premises deployments persist in defense and public-safety domains where air-gapped environments prevail, yet even these sectors explore private-cloud key management to cut operational overhead.
By Enterprise Size:
SME Adoption AcceleratesLarge corporations held 61.55% share of Digital Rights Management market in 2025 due to complex compliance workloads and global content footprints. SMEs, however, registered a 19.18% CAGR as subscription-priced SaaS DRM democratized access. Vitrium’s tiered offerings simplify onboarding with single-click policy templates that secure PDFs, videos, and CAD files for less than USD 1 per user monthly.
AI-powered wizards craft usage rules based on template libraries, allowing a 10-person design studio to replicate enterprise-grade protection once available only to Fortune 500 peers. Larger firms continue to invest heavily in real-time analytics and behavioral anomaly detection to pre-empt insider threats across distributed workforces. The divergent priorities cost simplicity for SMEs versus integration depth for large enterprises shape product-roadmap bifurcation among leading vendors.
By End-user Industry:
Healthcare Surges AheadBFSI retained 26.40% revenue share in 2025 as regulators mandate auditable protection for account statements, trading algorithms, and customer onboarding journeys. Healthcare, projecting an 17.88% CAGR, accelerates adoption as telemedicine scales and HIPAA rulemaking tightens breach penalties. Hospital chains deploy DRM to safeguard electronic health-record exports, diagnostic images, and cross-border clinical-trial data transfers.
IT-and-telecom operators employ DRM both to shield proprietary 5G network schematics and to offer content-security services to media clients. Education systems integrate document-centric DRM into learning-management systems to protect proprietary courseware while respecting academic-fair-use exceptions. Government agencies upgrade archival systems to meet open-data e-discovery mandates without compromising state secrets. This diversification broadens total addressable demand and compels vendors to field industry-specific policy packs.
Geography Analysis
North America Digital Rights Management (DRM) Market
North America accounted for 37.95% of Digital Rights Management market in 2025, supported by stringent sectoral mandates such as HIPAA, SOX, and the California Consumer Privacy Act. Financial institutions and media conglomerates lead multi-DRM rollouts that integrate blockchain-anchored license reconciliation to streamline royalty settlements. U.S. cloud providers partner with Canadian broadcasters to deploy cross-border key-vault redundancy that satisfies rival sovereignty laws without sacrificing latency.
APAC Digital Rights Management (DRM) Market
Asia Pacific is forecast to record a 15.94% CAGR through 2031, propelled by surging mobile video traffic and data-localization statutes in India, Indonesia, and Vietnam. China’s directive mandating DRM receivers in new-model vehicles underscores regulatory acceleration, pushing chipset suppliers to embed cost-optimized decryption blocks. Indian telecom operators bundle DRM as a revenue-sharing value-add for independent filmmakers, while Korean edtech companies secure interactive textbooks across BYOD tablets. Regional spending rises sharply as creative-industry exports require interoperable rights management to monetize globally.
Europe, South America and Africa Digital Rights Management (DRM) Market
Europe’s steady progression reflects the GDPR enforcement wave and the upcoming NIS2 directive that imposes higher cyber-resilience standards on critical-infrastructure operators. Media regulators encourage multi-DRM cooperation to standardize cross-border streaming, aiding pan-European content portals. Southern European broadcasters transition from legacy CAS smart-cards to converged DRM, trimming conditional-access costs by 30%. Meanwhile, emerging hubs in South America and Africa benefit from falling cloud-CDN pricing, adopting turnkey DRM to curb illegal IPTV services and protect locally produced drama series. These regions contribute incremental but rising shares as handset penetration and fiber rollout gather pace.
Regulatory Landscape
DRM adoption continues to be shaped by copyright anti-circumvention regimes and periodic rulemaking that clarifies what constitutes permissible access and security testing. In the United States, the Copyright Office and the Federal Register advanced the tenth triennial DMCA Section 1201 rulemaking in June 2026 to review temporary exemptions to the anti-circumvention provisions, following the prior cycle's final rule that took effect on October 28, 2024. These cycles influence how DRM vendors and enterprise buyers design controls for interoperability, repair, and security research while keeping enforceable access-control protections.
In Asia Pacific, enforcement campaigns and localization-oriented compliance raise the bar for auditable, policy-driven rights control across devices and platforms. China launched the Sword Net 2026 campaign in June 2026 through the National Copyright Administration and partner ministries, with explicit attention on AI-related copyright infringements, including unauthorized remixing and deepfakes. That pressure increases the need for forensic watermarking, provenance tracking, and rapid takedown workflows. On the standards side, ITU-T published DRM recommendations in March 2025 (J.1041 system architecture and J.1042 client) for video and audio distribution, reinforcing a technical compliance baseline that supports multi-DRM interoperability across broadcast and broadband ecosystems.
Competitive Landscape
Adobe, Microsoft, and Google collectively influence core encryption standards and hold scale advantages through embedded browser and OS footprints. Adobe’s AI-enhanced Document Cloud analyzes usage telemetry to recommend adaptive watermark density, delivering a 12% year-over-year subscription upsell to enterprise accounts. Google’s Widevine secures over 4 billion active devices, leveraging three security tiers to serve everything from budget Android phones to premium smart-TV chipsets. Microsoft aligns its PlayReady roadmap with Azure Media Services, facilitating turnkey key-vault geo-distribution for multinational broadcasters.
Specialized vendors address niche pain points such as blockchain-based royalty automation, quantum-safe key exchange, and medical-image DRM compliant with DICOM standards. Start-ups in cryptographic agility race to deliver lattice-based algorithms vetted by the U.S. National Institute of Standards and Technology, anticipating formal post-quantum guidance by 2027. Service integrators differentiate through multi-jurisdiction license analytics that detect anomalous consumption spikes, helping rights owners blacklist illicit CDN nodes within minutes.
Market consolidation remains moderate. Verimatrix’s focus on anti-piracy intelligence yields new partnerships with telcos in Latin America. Axinom collaborates with automotive OEMs to embed DRM directly into infotainment stacks that stream over-the-air upgrades. Story Protocol scales blockchain registries for independent creators to timestamp derivative works and receive micropayments. The competitive climate rewards firms that balance frictionless end-user flows with forensic-grade logging, positioning value-chain participants for recurring license revenues.
Digital Rights Management (DRM) Industry Leaders
-
Microsoft Corporation
-
Dell Technologies Inc.
-
Fasoo Inc.
-
Seclore
-
Oracle Corporation
- *Disclaimer: Major Players sorted in no particular order

Digital Rights Management (DRM) Market Companies Covered in this Report
- Adobe Inc.
- Microsoft Corporation
- Google LLC (Widevine)
- Apple Inc.
- Oracle Corporation
- IBM Corporation
- Amazon Web Services Inc. (AWS Elemental)
- Dell Technologies Inc.
- SAP SE (NextLabs Inc.)
- Seclore Technology Pvt Ltd
- Fasoo Inc.
- Irdeto B.V.
- OpenText Corporation
- Locklizard Limited
- Vitrium Systems Inc.
- Bynder B.V.
- CapLinked Inc.
- Digify Pte Ltd
- FADEL Partners Inc.
- ArtistScope Pty Ltd
- Widevine Technologies Inc. (legacy)

Market Opportunities and Future Outlook
Protection of AI-generated and AI-remixed media is expanding DRM buying centers beyond traditional OTT video, as rights owners look for combined license control, content authenticity, and downstream usage traceability. Company actions reflect this shift: in July 2026, Udio selected BuyDRM KeyOS MultiKey Service to deploy multi-DRM support across Widevine, FairPlay, and PlayReady for an AI-generated music platform, while Mostly Music selected BuyDRM in April 2026 to implement MultiMark forensic watermarking and MultiKey encryption for live and on-demand streaming. This broadens whitespace for vendors that can pair multi-DRM, forensic watermarking, and creator-friendly rights workflows, without adding device friction.
Standards and policy activity are also widening DRM's scope from streaming into digital publications and regulated enterprise information flows. ISO/IEC 23078-1/2/3:2024 defines DRM requirements for digital publications (including user key-based and device key-based protection), and ITU-T approved Recommendation J.1040 in October 2024 for video and audio distribution requirements, helping align procurement specifications across platforms. At the same time, the U.S. Copyright Office initiated the tenth DMCA Section 1201 exemption review in June 2026, keeping anti-circumvention boundaries and permitted access-control exceptions front-of-mind for product design, compliance reporting, and customer policies across North America and cross-border deployments.
Recent Industry Developments in Digital Rights Management (DRM) Market
- July 2026: Udio selected BuyDRM KeyOS MultiKey Service to protect and scale its AI music platform with multi-DRM support across Widevine, FairPlay, and PlayReady. The win signals active procurement for DRM stacks that address AI-era distribution needs where ownership, licensing, and downstream copying risks converge. It also reinforces multi-DRM as a practical requirement for reaching heterogeneous device ecosystems without fragmenting release workflows.
- February 2026: Seclore launched ARMOR, a unified Data Security Intelligence platform positioned to support secure enterprise AI adoption. The platform consolidates data-centric controls that align with DRM-adjacent requirements such as persistent protection, access governance, and visibility into how sensitive information is used across environments. The release strengthens vendor positioning around AI-driven data-in-use risks alongside classic content-protection use cases.
- September 2024: China advanced national standards mandating DRM support in vehicle radios for emergency broadcast reception through MIIT-led standardization efforts. The mandate accelerates embedded DRM capabilities in automotive infotainment and pushes chipset and OEM ecosystems toward compliant decryption and key-handling designs. It expands the addressable footprint for DRM technologies into connected-vehicle distribution channels where safety and compliance requirements are explicit.


Digital Rights Management (DRM) Market Report Scope and Research Methodology
Market Definition and Coverage
This market covers revenue earned from digital rights management software and related services that help protect, control, and track usage of digital content and files across devices, apps, and networks, with measurement reported in value terms.
Scope exclusions: Excluded from this sizing are general cybersecurity suites, pure identity and access management tools, payment processing, and unmanaged content hosting unless a DRM control function is directly provided and monetized.
Segments Covered in This Report
-
By Component
- Software
- Services
-
By Deployment Mode
- On-premises
- Cloud
-
By End-user Enterprise Size
- Small and Medium Enterprises (SMEs)
- Large Enterprises
-
By End-user Industry
- Media and Entertainment
- BFSI
- IT and Telecommunication
- Healthcare
- Education
- Government and Public Sector
- Others End-user Industry (Manufacturing, Retail, etc.)
-
By Geography
-
North America
- United States
- Canada
- Mexico
-
South America
- Brazil
- Argentina
- Rest of South America
-
Europe
- United Kingdom
- Germany
- France
- Italy
- Spain
- Russia
- Rest of Europe
-
Asia Pacific
- China
- Japan
- India
- South Korea
- Australia and New Zealand
- Rest of Asia Pacific
-
Middle East and Africa
-
Middle East
- Saudi Arabia
- United Arab Emirates
- Turkey
- Rest of Middle East
-
Africa
- South Africa
- Nigeria
- Kenya
- Rest of Africa
-
Middle East
-
North America
Data Sources, Market Sizing, and Validation
Desk Research
Desk work was used to set the guardrails for the model and to avoid double counting across adjacent security and content delivery spend. We referenced public sources such as FCC and NTIA releases for broadband and streaming behavior context, OECD and World Bank indicators for digital economy adoption signals, USITC and UN Comtrade series where trade flows helped sanity check hardware linked to protected content consumption, and NIST publications for standards language that clarifies what DRM is and is not.
On the supply side, we reviewed company filings, earnings decks, product documentation, and credible press coverage to map common packaging patterns (software versus services, on-premise versus cloud) and typical buyer groups. Where available, paid company financials and an intelligence subscription were used only to normalize revenue reporting and to track corporate actions that can distort year to year comparisons. These desk sources are illustrative, and many other public documents and datasets were also used for data collection, validation, and clarification during analysis.
Primary Interviews and Surveys
Primary inputs came from interviews and surveys with DRM platform teams, channel and integration partners, and enterprise and media buyers who manage content protection programs. We used these conversations across APAC, EMEA, and the Americas to confirm adoption timing, cloud migration pace, pricing movements, and how spending is booked when DRM is bundled with adjacent security or content delivery contracts.
Distribution of primary research fieldwork respondents
| Company type | Respondent position | Region |
|---|---|---|
| Top tier: 33% | CXOs: 14% | APAC: 43% |
| Mid tier: 49% | Functional/Unit leaders: 34% | EMEA: 32% |
| Smaller Players: 18% | Managers: 52% | Americas: 25% |
Market-Sizing & Forecasting
Sizing starts with a top-down build that reconstructs the demand pool by linking digital content distribution growth to DRM attach rates across key buyer groups, which are then adjusted by deployment mix and typical contract values. To keep the totals grounded, we corroborated outputs with selective bottom-up approximations, including sampled vendor and partner revenue rollups, channel checks, and ASP times volume logic for common use cases.
Inputs used in the model include OTT subscription and streaming traffic direction, enterprise cloud adoption and remote-work footprint, the share of DRM delivered as software versus services, cloud versus on-premise mix shifts, and pricing progression tied to multi-year contracts and renewals. When a bottom-up check had gaps (for example, privately held firms with limited disclosures), ranges were set using interview-backed benchmarks and then narrowed using regional demand indicators.
Forecasts were developed using scenario analysis supported by a small set of leading indicators, such as streaming growth, cloud migration pace, and regulatory and compliance intensity around protected content. Assumptions were iterated until the forward path aligned with what respondents described as realistic buying cycles and renewal behavior.
Data Validation & Update Cycle
Outputs are validated through multiple checks so the final totals do not drift away from real world demand signals. We compare computed market values with independent indicators like cloud security budget direction, media and entertainment technology spend patterns, and regional digital consumption momentum, and then investigate outliers before sign-off.
A second analyst review is used to recheck definitions, currency handling, and year alignment, followed by targeted re-contact when a major variance appears or when a new product or policy change could shift adoption. Reports are refreshed annually, and interim updates are made when material events occur, and then a final pre-delivery pass is completed so clients receive the latest view.
Mordor Intelligence's Digital Rights Management Drm Market Estimate Compared With Other Published Estimates
Published DRM market values often differ because the scope line between content protection, access control, and broader security spend is not drawn the same way, and because firms also pick different base years and conversion timing. Differences can also show up when one estimate leans on optimistic adoption curves, while another assumes slower enterprise rollouts and longer renewal cycles.
General security platforms and identity tools sit outside Mordor Intelligence's scope here, which reduces double counting versus estimates that fold those budgets into DRM totals or count media delivery controls as DRM by default. The spread is also affected by how services are treated, since some publishers include wider integration and managed services revenue even when DRM is only a small workstream, and by how currency and inflation assumptions are updated between refresh cycles.
Benchmark comparison
| Source | Market Size | Gaps in Research Methodology |
|---|---|---|
| Mordor Intelligence | USD 6.93 B (2026) | |
| Global Consultancy A | USD 6.72 B (2025) | Uses an earlier base year and a broader solution frame where adjacent content delivery and access controls can be captured within the DRM bucket, which can shift the total even if end demand is similar. |
| Industry Publisher B | USD 5.82 B (2024) | Represents an earlier year and applies a different revenue recognition treatment that can exclude portions of bundled services or count only defined DRM-linked revenues, creating a lower starting point. |
Taken together, the comparison mostly reflects differences in what gets counted as DRM, the year being referenced, and how bundled services and mixed contracts are allocated. By keeping the inputs tied to clear demand indicators and by cross-checking with interview feedback on attach rates and pricing, our estimate stays traceable and repeatable even when public disclosures are uneven.


Key Questions Answered in the Report
How large is the Digital Rights Management market in 2026 and how fast is it growing?
The Digital Rights Management market size is USD 6.93 billion in 2026 and it is projected to grow at an 11.16% CAGR to 2031.
Which region records the fastest expansion in Digital Rights Management adoption?
Asia Pacific posts the highest growth with a 15.94% CAGR through 2031, fueled by data-localization mandates and mobile streaming demand.
What component segment shows the quickest growth?
Services exhibit the fastest rise, advancing at a 17.32% CAGR as organizations outsource complex multi-DRM integration and compliance management.
Which industry vertical is projected to outpace others in DRM spending?
Healthcare is forecast to lead growth at an 17.88% CAGR as telemedicine and electronic health-record initiatives demand persistent data protection.
What deployment model now dominates new DRM projects?
Cloud deployment holds 56.10% share of current projects and is accelerating further, favored for elastic scaling and centralized policy management.
Are SMEs investing in Digital Rights Management?
Yes. SMEs record a 19.18% CAGR because subscription-priced SaaS DRM lowers entry barriers and offers automated policy templates.
Page last updated on:





