
Dental Autoclave Market Size and Share
Market Overview
| Study Period | 2020 - 2031 |
|---|---|
| Market Size (2026) | USD 326.44 Million |
| Market Size (2031) | USD 391.27 Million |
| Growth Rate (2026 - 2031) | 3.69 % |
| Fastest Growing Market | Asia-Pacific |
| Largest Market | North America |
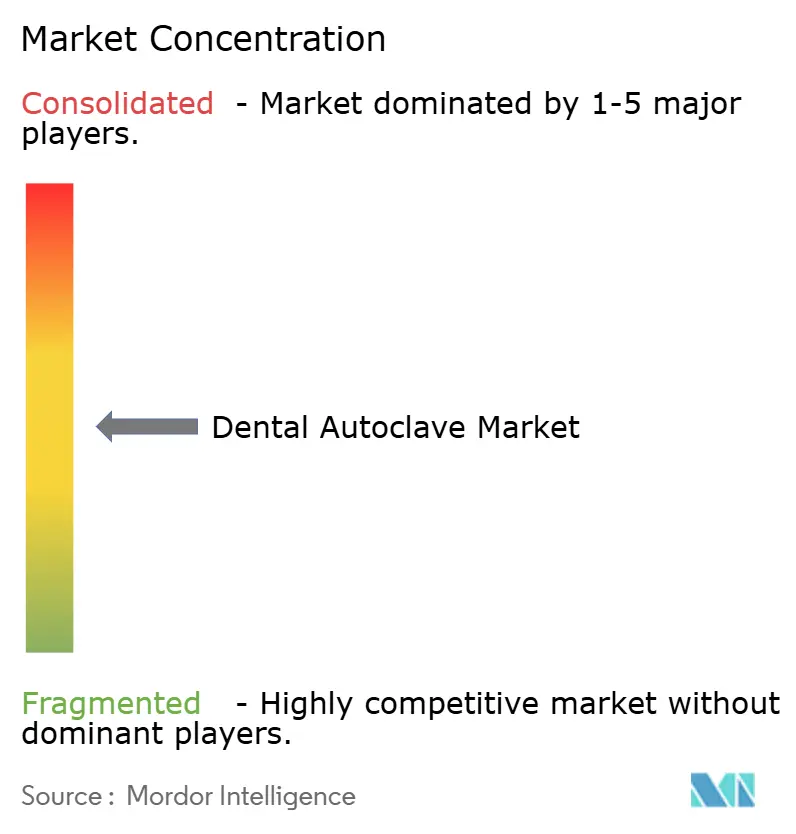
| Market Concentration | Medium |
Major Players *Disclaimer: Major Players sorted in no particular order Image © Mordor Intelligence. Reuse requires attribution under CC BY 4.0. | |
Dental Autoclave Market Analysis by Mordor Intelligence
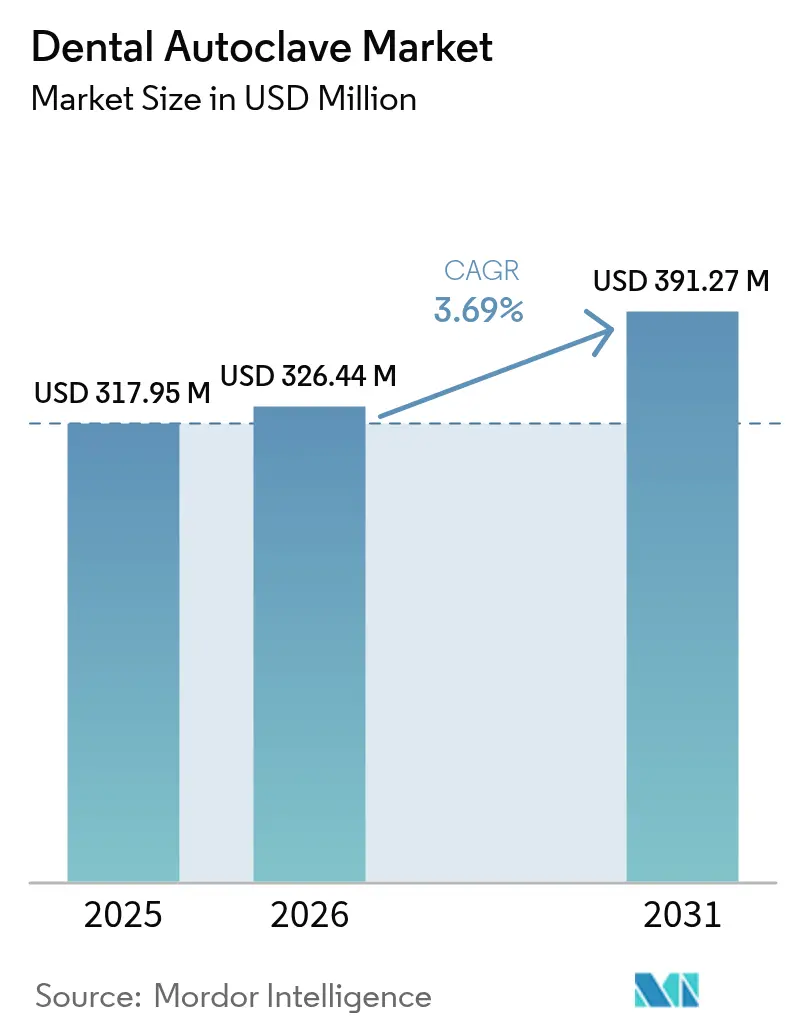
The Dental Autoclave Market size is projected to be USD 317.95 million in 2025, USD 326.44 million in 2026, and reach USD 391.27 million by 2031, growing at a CAGR of 3.69% from 2026 to 2031.
Momentum is shifting toward multi-country dental service organizations that standardize sterilization fleets, while solo practices feel regulatory and competitive pressure to replace legacy Class N models. The U.S. FDA’s December 2024 recognition of ISO 17665 (2024) and the Quality Management System Regulation that takes effect in February 2026 have made documented cycle validation and traceability essential purchase criteria.[1]U.S. Food & Drug Administration Staff, “Recognized Consensus Standards: ISO 17665 First Edition 2024-03,” FDA, fda.gov Rapid-cycle Class B technology, IoT connectivity, and water-saving designs are therefore outpacing the broader dental autoclave market, while supply-chain risk for vacuum pumps and rising European wastewater fees add cost headwinds.
Key Report Takeaways
- By product type, Class B vacuum autoclaves held 41.22% of 2025 revenue and are advancing at a 7.58% CAGR, the fastest rate across categories.
- Fully automatic units captured 44.68% of 2025 sales and are growing at a 6.84% CAGR as labor shortages lift demand for hands-free operation.
- Table-top systems commanded 64.78% of 2025 volume, whereas portable designs are expanding the quickest at a 7.81% CAGR due to dental-tourism clinics in Asia–Pacific.
- The 20-50 liter bracket accounted for 59.82% of 2025 installations; autoclaves above 50 liters are rising at a 6.53% CAGR thanks to centralized processing in large DSOs.
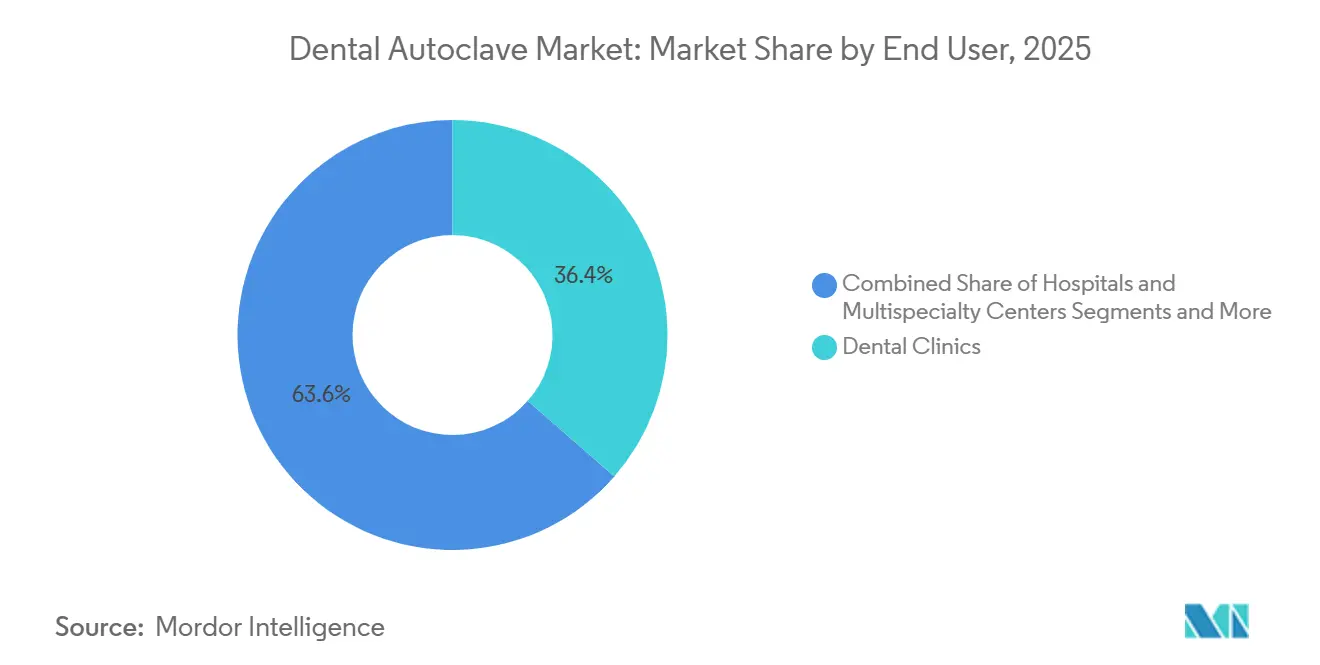
- Dental clinics provided 36.44% of 2025 demand, but hospitals and multispecialty centers show the strongest trajectory at a 5.78% CAGR as dentistry migrates into ambulatory surgery settings.
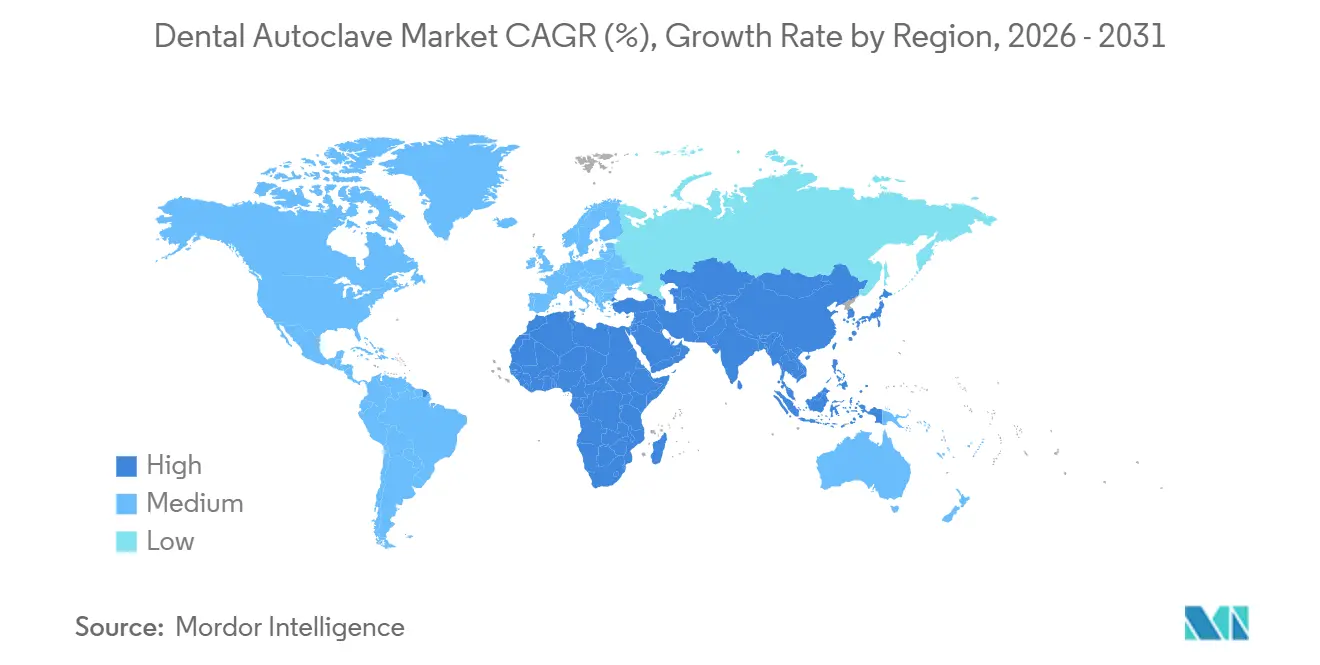
- North America led with a 41.26% share in 2025, while Asia–Pacific is on course for a 5.33% CAGR, propelled by tourism and import-substitution policies.
Note: Market size and forecast figures in this report are generated using Mordor Intelligence’s proprietary estimation framework, updated with the latest available data and insights as of 2026.
Global Dental Autoclave Market Trends and Insights
Drivers Impact Analysis*
| Driver | (~) % Impact on CAGR Forecast | Geographic Relevance | Impact Timeline |
|---|---|---|---|
| Stricter Global Infection-Control Regulations | +0.8% | Global, with early enforcement in North America & EU | Long term (≥ 4 years) |
| Rising Volume of Dental & Cosmetic Procedures | +0.7% | Global, concentrated in North America, Europe, APAC urban centers | Medium term (2-4 years) |
| Technological Advances in Rapid-Cycle Class B Units | +0.6% | Global, with premium adoption in North America & Western Europe | Medium term (2-4 years) |
| IoT-Enabled Traceability Driving DSO Procurement | +0.5% | North America & Europe, early spill-over to APAC DSO networks | Short term (≤ 2 years) |
| APAC Dental-Tourism Clinics Upgrading Sterilizers | +0.4% | APAC core (Thailand, Malaysia, India), spill-over to Middle East | Medium term (2-4 years) |
| Expansion of Multi-Country DSOs Standardizing Sterilization Fleets | +0.5% | North America primarily, expanding to Europe & Latin America | Short term (≤ 2 years) |
| Source: Mordor Intelligence | |||
Stricter Global Infection-Control Regulations
The FDA recognition of ISO 17665 (2024) in December 2024 and the Quality Management System Regulation effective February 2026 compel manufacturers and clinics alike to document every sterilization cycle. Autoclaves now need built-in printers, USB export, or cloud uplinks, features that add USD 1,500-2,000 to base price but reduce inspection risk. U.S. CDC audits from June 2024 show that 15-65% of practices still fail routine spore tests, most often due to operator error, fueling demand for automatic verification and door-lockout safeguards.[2]Centers for Disease Control and Prevention Staff, “Sterilization Guidance for Dental Settings,” CDC, cdc.gov These mandates lengthen replacement cycles for sub-validated devices, effectively tilting the dental autoclave market toward premium Class B models with end-to-end traceability.
Rising Volume of Dental & Cosmetic Procedures
Elective esthetic dentistry and multi-visit implant workflows are pushing instrument turnover beyond the capacity of legacy gravity autoclaves. ADA surveys from 2024 reveal that 28.4% of owner dentists invested in major equipment, the highest share since the pandemic rebound.[3]American Dental Association Health Policy Institute Staff, “2024 Dental Equipment Purchase Survey,” ADA, ada.org Clinics focused on veneers, aligners, and whitening complete more cycles per patient hour, increasing the economic penalty of downtime. Rapid-cycle Class B autoclaves that finish wrapped loads in under 25 minutes therefore deliver a measurable return on patient throughput.
Technological Advances in Rapid-Cycle Class B Units
Euronda’s E10 shortens a B134 cycle for wrapped hollow instruments to roughly 20 minutes for an 18-liter chamber, while energy-saving ECO Dry designs from W&H cut electricity use by 20-25%. Midmark’s 2024 models extend service life to 25,000 cycles and offer autofill systems, trimming three minutes of prep time per load. Collectively, these advances let a 20-liter rapid-cycle unit match the daily throughput of a standard 35-liter model, lowering purchase and operating costs for DSOs consolidating hundreds of sites.
IoT-Enabled Traceability Driving DSO Procurement
Platforms such as Tuttnauer’s T-Connect stream live cycle data from more than 1,000 Aspen Dental locations, cutting documentation time from four minutes to under 30 seconds and allowing predictive maintenance based on pump runtime. Bar-code linkage of cassettes to patient files creates a defensible audit trail that shields clinics from liability. As FDA post-market surveillance rules tighten, DSOs view connected autoclaves as a compliance and logistics asset rather than a mere piece of equipment.
Restraints Impact Analysis*
| Restraint | (~) % Impact on CAGR Forecast | Geographic Relevance | Impact Timeline |
|---|---|---|---|
| High Upfront Cost of Advanced Class B Units | -0.6% | Global, acute in price-sensitive APAC, Latin America, MEA markets | Long term (≥ 4 years) |
| Low Sterilization Awareness in Low-Income Regions | -0.4% | Sub-Saharan Africa, South Asia, parts of Southeast Asia & Latin America | Long term (≥ 4 years) |
| Vacuum-Pump Component Supply-Chain Volatility | -0.3% | Global, with acute shortages affecting European & North American OEMs | Short term (≤ 2 years) |
| Rising Wastewater-Discharge Compliance Costs for Steam Sterilizers in Europe | -0.2% | Europe, concentrated in Germany, France, Netherlands, Nordics | Medium term (2-4 years) |
| Source: Mordor Intelligence | |||
High Upfront Cost of Advanced Class B Units
Class B autoclaves list from USD 7,000 to over USD 10,000, a USD 5,000-8,000 premium versus Class N equipment, equal to three to six months of net income for dentists in India or Brazil. Annual maintenance, vacuum-pump service, and water-purification systems add another USD 1,500-3,500 per year. Although leasing is emerging at roughly USD 250 monthly, penetration remains under 15% because many small practices lack reliable credit histories.
Low Sterilization Awareness in Low-Income Regions
Curricula in several South Asian and African dental schools allocate limited hours to infection control, leading to under-specification and misuse of equipment. WHO guidance places the operating cost of a small clinical autoclave at USD 0.13-0.36 per kilogram of waste, yet outages averaging four hours daily in many regions render these estimates optimistic. Continued reliance on dry-heat or chemical methods that fail to reach a 10^-6 sterility assurance level curbs the effective demand pool for the dental autoclave market.
*Our forecasts treat driver/restraint impacts as directional, not additive. The impact forecasts reflect baseline growth, mix effects, and variable interactions.
Segment Analysis
By Product Type: Class B Dominance Reflects Lumened-Instrument Mandates
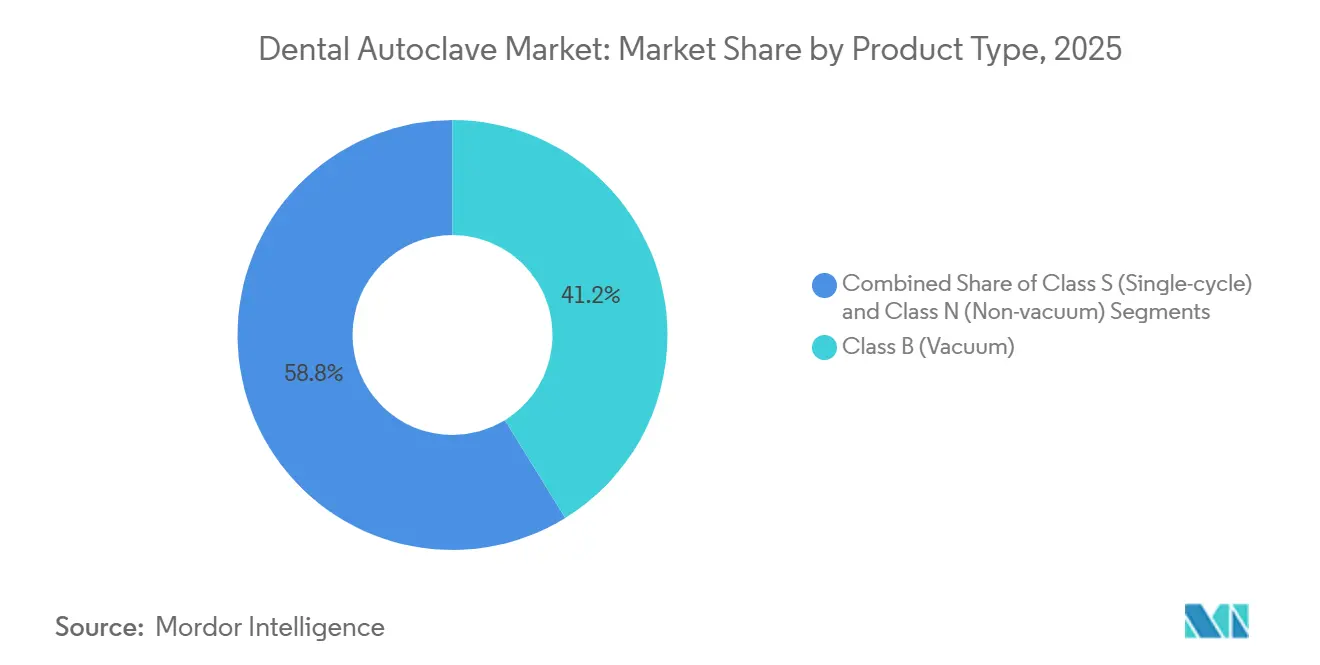
Class B vacuum autoclaves held 41.22% revenue share in 2025, and the dental autoclave market share for this segment is on track to widen through a 7.58% CAGR to 2031. Demand reflects the prevalence of hollow handpieces and bagged cassette storage, both of which require pre-vacuum penetration and post-vacuum drying.
Class N models remain the low-cost choice for clinics sterilizing only unwrapped solids, especially in emerging economies, but increasing inspections under EN 13060 and ANSI/AAMI ST55 are pushing multi-disciplinary offices toward Class B. Upgrade-ready products such as Tuttnauer’s T-Edge, which can shift from Class S to Class B through modular kits, give smaller practices a migration path without immediate capital burden.



By Automation Type: Labor Scarcity Accelerates Fully Automatic Adoption
Fully automatic systems represented 44.68% of 2025 revenue and are expanding at a 6.84% CAGR, well above the broader dental autoclave market. Their automated fill, drain, and cycle-selection functions cut per-load labor by up to five minutes, a material saving in markets where dental assistants earn USD 20-25 hourly.
Semi-automatic models still outsell manual units in retrofit clinics that lack direct plumbing, yet rising staff attrition in North American and European practices makes full automation the default in new builds. DSOs also favor automated autoclaves because integrated maintenance timers and cloud alerts reduce variability across hundreds of sites, protecting workflow during technician shortages.
By Modality: Portable Units Gain Traction in Dental-Tourism Hubs
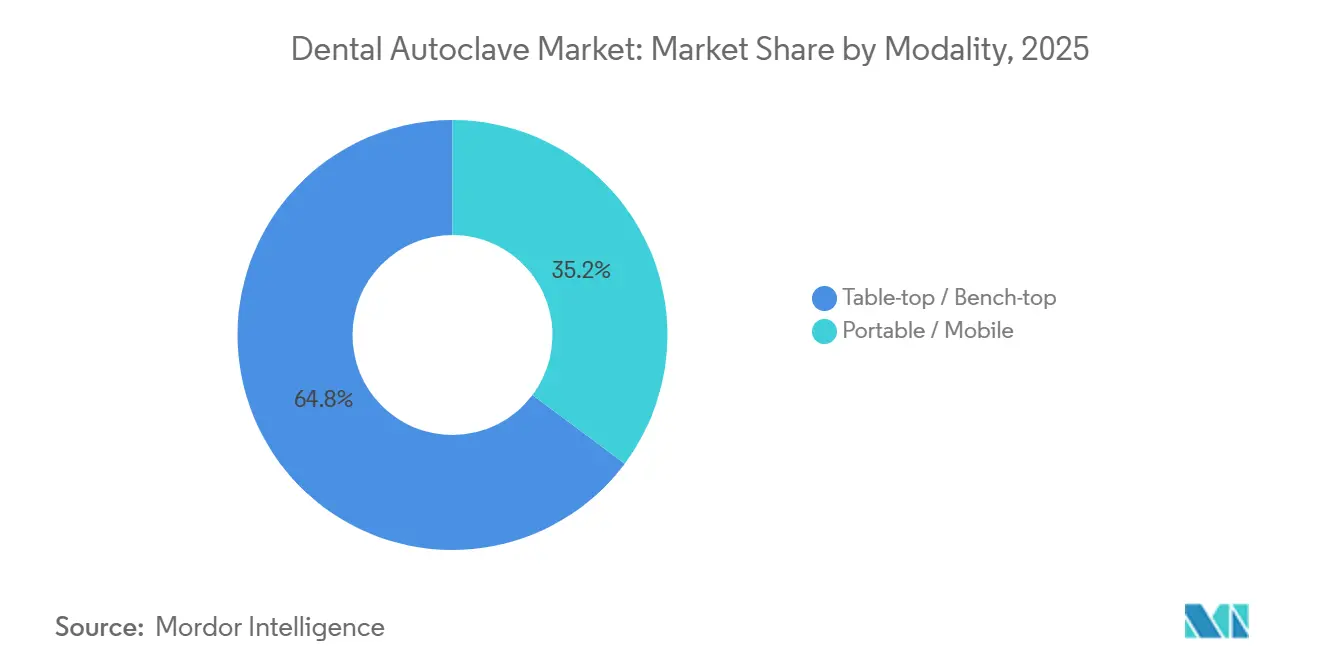
Bench-top designs dominated with 64.78% of 2025 placements, but portable autoclaves are growing at a 7.81% CAGR—the fastest modality in the dental autoclave market. Tourism-oriented clinics in Thailand, Malaysia, and India deploy battery-backed Class B portables that weigh under 35 kilograms, rolling them between satellite operatories or mobile vans.
Real-estate costs also shape modality choice. A bench-top unit needs 0.5-0.8 square meters of counter space; portable models occupy space only during cycles, freeing premium cabinetry in cosmetic dentistry suites for 3D printing or scanning stations. Manufacturers now offer built-in variants like Euronda’s E9 Next, which sits flush in cabinetry to satisfy high-end design aesthetics while maximizing usable space.
By Capacity: Mid-Range Dominates, Large Units Serve DSO Processing
Autoclaves in the 20-50 liter band accounted for 59.82% of 2025 shipments, reflecting their ability to run six trays in a single cycle without excessive energy draw. The dental autoclave market size for units above 50 liters is projected to record a 6.53% CAGR as DSOs and hospitals consolidate instrument processing into central rooms that run 30-50 sets per batch.
Small units under 20 liters remain attractive to solo pediatric or orthodontic offices, yet they quickly become a bottleneck when daily loads exceed ten cassettes. Oversized autoclaves incur higher weekly biologic-indicator costs and longer validation cycles, so right-sizing based on case mix remains best practice.
By End User: Hospitals Gain Share as Dental Joins Ambulatory Surgery
Dental clinics still generated 36.44% of 2025 value, but hospital and multispecialty centers lead growth at a 5.78% CAGR through 2031 as insurers reimburse higher facility fees for complex implant and trauma procedures. Central sterile departments leverage 80-200 liter chambers to achieve economies of scale, lowering per-instrument costs by up to 50%.
Laboratories and academic institutes represent niche demand, valuing rapid unwrapped cycles and extensive data logging to maintain accreditation. Service-network expectations diverge: clinics require same-day repairs, whereas hospitals can operate backup units, permitting emerging-market vendors to sell into CSPDs on price even with longer service windows.
Geography Analysis
North America led the dental autoclave market with 41.26% revenue share in 2025. U.S. practices average 1.2-1.4 autoclaves each and follow CDC guidance that mandates daily biologic tests, driving adoption of devices with on-board incubators and automatic printouts. Canada mirrors those standards through provincial rules, while Mexico shows a two-tier pattern: urban private offices adopt Class B equipment akin to U.S. norms, whereas many rural clinics still rely on refurbished Class N models.
Europe contributed the second-largest slice, shaped by MDR 2017/745 and imminent wastewater fees under the 2022 Urban Wastewater Treatment Directive. Germany and the Netherlands already levy EUR 500-1,000 annual surcharges on high-volume practices, encouraging uptake of water-recycling autoclaves that satisfy EN 13060 while reducing effluent penalties. The United Kingdom’s transition from CE to UKCA labelling briefly delayed purchases in 2024-2025, though most backlogs are set to clear once guidance stabilizes by 2027.
Asia–Pacific is the fastest-growing region with a 5.33% CAGR to 2031. India’s Production-Linked Incentive scheme, which approved 26 manufacturers for 138 devices by late 2024, is poised to trim import dependence from 85% to below 60% by 2030. Chinese suppliers face tighter NMPA oversight but continue to gain share in Southeast Asia through aggressive pricing. Japan maintains the shortest replacement cycle worldwide—approximately eight to ten years—and favors domestic brands that integrate with local practice software.
Middle East & Africa and South America remain smaller but strategically vital. GCC nations fund dental-tourism hubs with Class B specification baked into build-outs, while Brazil, home to the world’s second-largest dentist population, is transitioning from dry-heat to steam sterilization to satisfy international patients.

Regulatory Landscape
Dental autoclaves operate within broader medical-device and infection-control frameworks that increasingly link purchasing decisions to documented validation and traceability. In the United States, the FDA's recognition of ISO 17665:2024 for moist-heat sterilization validation (with transition provisions allowing declarations to older recognized versions until July 4, 2027) supports a clearer baseline for cycle development, validation, and routine control expectations, while the FDA Quality Management System Regulation taking effect in February 2026 raises the bar for design controls, documentation, and post-market processes that support compliant sterilizer fleets.
In Europe, MDR 2017/745 frames conformity assessment and technical documentation for small steam sterilizers used in dental settings, with harmonized standards providing a clearer presumption of conformity path for CE marking. Commission Implementing Decision (EU) 2026/760 (published April 1, 2026) added EN 13060:2025 as a harmonised standard under the MDR, tightening expectations around cycle validation, performance testing, and safety requirements for small steam sterilizers. At the point of use, clinics are expected to follow routine monitoring norms using mechanical, chemical, and biological indicators, and many US state dental-board rules reference CDC-aligned biological monitoring practices, such as weekly spore testing requirements including Colorado 3 CCR 709-1.16. This environment supports demand for built-in logging, error-proofing, and audit-ready reporting features.
Value Chain Analysis
The dental autoclave value chain starts with specialty component inputs and certification-intensive manufacturing. Upstream inputs include stainless-steel pressure vessels, heating elements, vacuum pumps and valves, sensors (pressure, temperature, conductivity), and control electronics used for cycle programming and data capture. ISO 13485 quality systems and sterilization process validation aligned with ISO 17665:2024 are incorporated across design, testing, and documentation, and regulatory certification timelines for new models can extend into a 12-18 month window, making established regulatory affairs capabilities an advantage.
Midstream, OEM assembly and calibration is paired with accessory ecosystems, including water treatment, printers or digital export modules, load cassettes, and consumables such as indicators, which shape total cost of ownership. Downstream, distribution typically relies on dental dealers and manufacturer-led networks into solo practices, DSOs, hospitals, and multispecialty centers, with service infrastructure differentiating suppliers. Field installation and periodic qualification (IQ/OQ/PQ), along with re-validation after major repairs, underpin recurring service revenue and increase switching costs, while supply volatility for vacuum pumps, sourcing of electronics, and limited availability of skilled technicians for validation and repair can constrain throughput in high-density clinic markets.
Competitive Landscape
The dental autoclave market has a moderately concentrated profile. Leaders such as Tuttnauer, MELAG, Dentsply Sirona, W&H, and Midmark dominate mature regions through dense distributor networks and 48-hour service guarantees. Tuttnauer’s 2025 agreement with Aspen Dental covers more than 1,000 offices, underscoring how cloud connectivity and fleet analytics trump unit price in DSO tenders.
Fragmentation is nevertheless advancing. Chinese entrants Runyes, Shinva, and BioBase undercut Western pricing by 30-40%, winning share in India, Southeast Asia, and parts of Latin America. Their ascent accelerated after Steris divested HuFriedyGroup to Peak Rock Capital for USD 787.5 million in 2024, signalling reduced big-conglomerate focus on dental sterilization.
Innovation now centers on ecosystem bundles that pair autoclaves with ultrasonic cleaners, washer-disinfectors, and tracking software. Euronda’s Pro System exemplifies the approach, sharing consumables and spares across E5, E9, and E10 models to cut inventory complexity for chain operators. Mid-term threats include hydrogen-peroxide plasma units, yet cost per cycle remains 4-8 times higher than steam, containing the challenge to heat-sensitive niches.
Dental Autoclave Industry Leaders
Tuttnauer
MELAG Medizintechnik GmbH & Co. KG
W&H Dentalwerk
Midmark Corp.
Getinge AB
- *Disclaimer: Major Players sorted in no particular order

Market Opportunities and Future Outlook
Compliance-driven digitization is creating whitespace for connected autoclaves and software services that convert sterilization records into audit-ready datasets for DSOs and multi-site clinics. This shift is visible in fleet-scale deployments such as Tuttnauer's cycle-data connectivity across more than 1,000 Aspen Dental locations via T-Connect, where standardized documentation and maintenance insights reduce variability across sites. As US and EU standards and guidance tighten on validation and performance testing (ISO 17665:2024, EN 13060:2025 under MDR harmonisation), offers that bundle autoclaves with automated record capture, barcode linkage, and service-led qualification packages align with procurement requirements.
A second opportunity is workflow efficiency and resource optimization at the device level, particularly rapid-cycle Class B platforms designed for wrapped and hollow instruments without throughput penalties. Midmark's design focus on extended durability, including the referenced 25,000-cycle rating from its 2024-generation updates, and W&H's energy-focused drying approaches (ECO Dry) that target electricity reductions support clinics looking to lower downtime and operating costs. Regional manufacturing incentives also expand channel options for mid-tier and value offerings, as illustrated in India, where the Production-Linked Incentive scheme approved 26 manufacturers for 138 devices by late 2024, strengthening domestic supply options for clinics upgrading from legacy gravity units.
Recent Industry Developments
- February 2026: Midmark launched next-generation M9 and M11 steam sterilizers with re-engineered chambers rated for 25,000 cycles and updated software aimed at improving workflow compliance. The release reinforces the market shift toward durability plus traceability features that reduce downtime and standardize documentation in multi-chair practices and DSO environments.
- March 2025: W&H introduced more than 10 new products at IDS 2025, including the Lisa Mini Type B sterilizer designed for compact instrument reprocessing. The launch addresses demand for Class B performance in space-constrained operatories and supports rapid-cycle workflows where wrapped and hollow instruments are routine.
- January 2025: Tuttnauer received a Technology Breakthrough designation from Premier, Inc. for its T-Top autoclave line, enabling pre-negotiated purchasing terms for Premier members. This procurement channel expands access to standardized sterilization platforms for large member networks and supports faster fleet refresh cycles tied to compliance requirements.


Research Methodology Framework and Report Scope
Market Definition and Coverage
This market covers revenues generated from dental autoclaves that sterilize dental instruments using high pressure steam, as sold to dental care settings and related users across major regions.
Scope exclusions: We exclude non-steam sterilization systems, surface disinfectants, and broader infection control consumables and services that do not represent an autoclave sale.
Segmentation Overview
- By Product Type
- Class B (Vacuum)
- Class S (Single-cycle)
- Class N (Non-vacuum)
- By Automation Type
- Fully Automatic
- Semi-Automatic
- Manual
- By Modality
- Table-top / Bench-top
- Portable / Mobile
- By Capacity
- Up to 20 L
- 20 – 50 L
- Above 50 L
- By End User
- Dental Clinics
- Hospitals & Multispecialty Centers
- Dental Laboratories
- Academic & Research Institutes
- By Geography
- North America
- United States
- Canada
- Mexico
- Europe
- Germany
- France
- United Kingdom
- Italy
- Spain
- Rest of Europe
- Asia-Pacific
- China
- Japan
- India
- South Korea
- Australia
- Rest of Asia-Pacific
- Middle East & Africa
- GCC
- South Africa
- Rest of Middle East & Africa
- South America
- Brazil
- Argentina
- Rest of South America
- North America
Data Sources, Market Sizing, and Validation
Desk Research
Desk research was used to map the demand base and the purchasing rules that shape how clinics and hospitals buy dental steam sterilizers, before any modeling. We referred to public sources such as CDC guidance on sterilization and infection control, FDA device classification and safety communications, and ISO standards that describe steam sterilization performance and testing. We also used sources such as WHO oral health data and OECD health statistics to understand procedure growth, clinic density signals, and overall healthcare spending direction.
To keep pricing and volume assumptions realistic, we checked manufacturer catalogs, product brochures, investor presentations, and public tender notices where available. We then cross-linked these inputs with import and export statistics for sterilization equipment in key countries to see whether the stated supply and channel patterns align with observed trade flows. In a few places, paid subscriptions that provide company financials and news coverage, plus a shipment-level trade database, were used to confirm supplier exposure and cross-border movements. The desk research sources named above are illustrative, and we used additional public and subscription sources for data collection, validation, and clarification.
Primary Interviews and Surveys
Primary interviews and surveys helped us test what buyers actually purchase and how replacement cycles work in dental clinics, hospitals, labs, and academic settings. We spoke with a mix of manufacturers, distributors, service technicians, and procurement or infection control decision makers across APAC, EMEA, and the Americas, so regional compliance expectations and pricing differences were captured rather than assumed from secondary data.
Distribution of primary research fieldwork respondents
| Company type | Respondent position | Region |
|---|---|---|
| Top tier: 34% | CXOs: 12% | APAC: 49% |
| Mid tier: 52% | Functional/Unit leaders: 35% | EMEA: 30% |
| Smaller Players: 14% | Managers: 53% | Americas: 21% |
Market-Sizing & Forecasting
Sizing started with a top-down build where procedure volumes, clinic and chair counts, and sterilization compliance needs were used to reconstruct the addressable equipment demand pool by region. Once that demand pool was formed, it was converted into value using typical replacement cycles, average unit prices, and mix shifts across commonly used classes (for example, Class B versus Class N) and automation levels.
The totals were then checked with selective bottom-up approximations so the model stayed grounded in what can be supplied and installed. These checks included supplier roll-ups from public financial disclosures, sampled price lists from distributors, and a volume sanity check using import and export signals for sterilization equipment in markets where trade is a key route to supply. When company level data was missing for smaller suppliers, gaps were handled through peer-based pricing bands and channel share assumptions, followed by a review with interviewees.
For forecasting, scenario analysis was used because adoption is strongly influenced by compliance upgrades and replacement timing, not only by a straight line trend. Inputs that were most helpful included dental procedure recovery and growth, installation base aging, the share of purchases shifting to fully automatic units, changes in price due to feature upgrades, and regional expansion of clinics and multispecialty centers.
Data Validation & Update Cycle
Validation was done through cross-checks between model outputs and independent signals, such as trade movement, public procurement activity, and the implied replacement demand versus the installed base. Outliers were flagged at the country and regional level, and then assumptions were revisited in a second analyst review so errors did not pass through to the final totals.
Reports are refreshed annually, and interim updates are made when material events occur, such as major regulatory shifts, supply disruptions, or step changes in pricing. Before delivery, an analyst performs a final pass to confirm that the latest public updates and interview feedback are reflected in the numbers and narrative.
Mordor Intelligence's Dental Autoclave Market Size Compared With Other Published Estimates
Published market sizes for dental autoclaves can vary even when they sound like they measure the same thing, because the market scope is often drawn differently and price assumptions are not handled the same way. Differences also show up when sources pick different base years, convert currencies using different timing, or rely on a limited set of countries and then scale up.
By tracking replacement cycle timing, ASP movement by autoclave class, and region-level demand checks in the model, Mordor Intelligence keeps the 2025 estimate centered on steam dental autoclaves sold into clinics, hospitals, laboratories, and academic users, without counting adjacent sterilizers or general infection control purchases.
Benchmark comparison
| Source | Market Size | Gaps in Research Methodology |
|---|---|---|
| Mordor Intelligence | USD 317.95 M (2025) | |
| Industry Publisher A | USD 320.17 M (2024) | Uses a different base year and a narrower country set that is then generalized, and it also groups product types beyond standard steam autoclaves under broader sterilizer labels, which changes the mix and pricing. |
| Trade Media B | USD 304.20 M (2023) | Anchors the series on a single historical point and applies a uniform growth rate to 2033, with limited explanation of replacement cycles, class mix shifts, or regional price differences that affect near-term value. |
The spread across sources mainly comes from what gets counted as an autoclave sale, which year is used for the starting point, and whether pricing and replacement behavior are validated with practical checks. Our steps stay traceable to demand signals and simple price logic, which makes the outcome easier to repeat and adjust when conditions change.


Key Questions Answered in the Report
How large is the dental autoclave market in 2026?
The dental autoclave market size reached USD 326.44 million in 2026 and is forecast to hit USD 391.27 million by 2031 at a 3.69% CAGR.
Which product class leads current demand?
Class B vacuum autoclaves hold 41.22% of 2025 revenue and are expanding faster than any other product type.
Why are fully automatic autoclaves gaining popularity?
They reduce per-cycle labor by up to five minutes, a decisive advantage amid dental assistant shortages and DSO fleet standardization.
What drives growth in Asia–Pacific?
Dental tourism, import-substitution incentives like India’s Production-Linked Incentive scheme, and rapid clinic expansion fuel the region’s 5.33% CAGR.
How are regulations influencing buying decisions?
FDA adoption of ISO 17665 and stricter QMSR rules compel clinics to purchase autoclaves with built-in traceability and documented cycle validation.
Page last updated on:


 Your data is secure and never sold or shared.


