Gigabit Ethernet Test Equipment Market Size and Share
Market Overview
| Study Period | 2020 - 2031 |
|---|---|
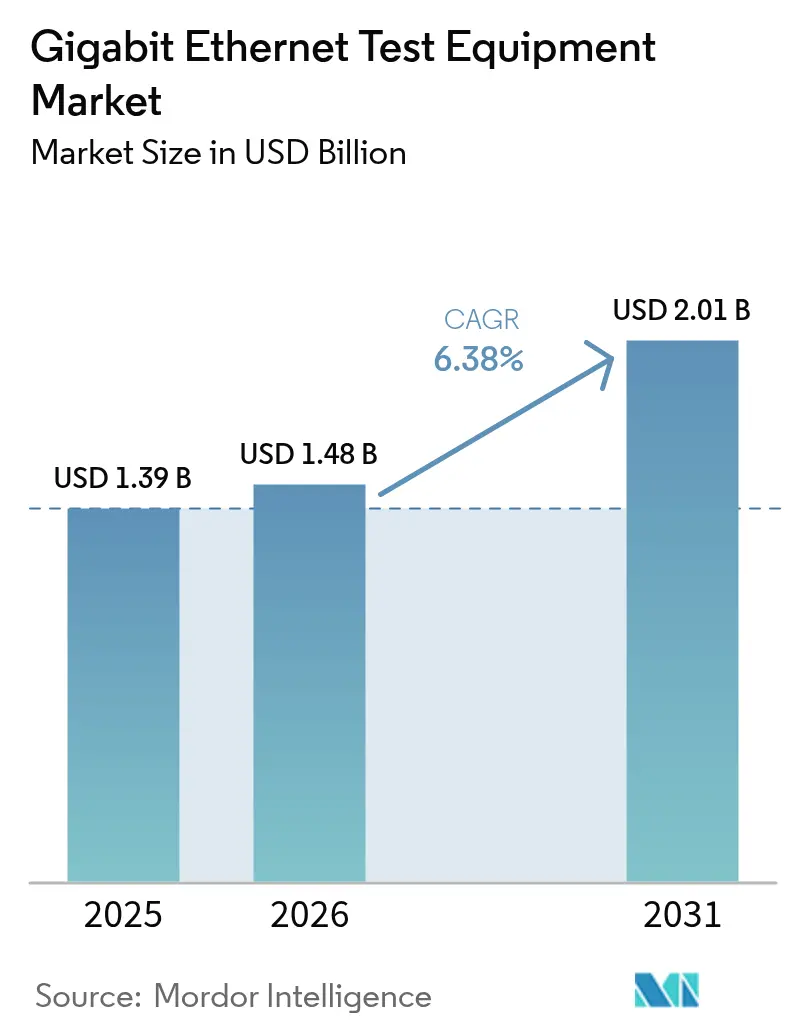
| Market Size (2026) | USD 1.48 Billion |
| Market Size (2031) | USD 2.01 Billion |
| Growth Rate (2026 - 2031) | 6.38% CAGR |
| Fastest Growing Market | Asia Pacific |
| Largest Market | North America |
| Market Concentration | Medium |
Major Players*Disclaimer: Major Players sorted in no particular order Image © Mordor Intelligence. Reuse requires attribution under CC BY 4.0. | |
Gigabit Ethernet Test Equipment Market Analysis by Mordor Intelligence
The Gigabit Ethernet test equipment market size is expected to grow from USD 1.39 billion in 2025 to USD 1.48 billion in 2026 and is forecast to reach USD 2.01 billion by 2031 at 6.38% CAGR over 2026-2031.[1]Spirent Communications, “2024–2026 High-Speed Ethernet Outlook,” spirent.com Rising adoption of artificial intelligence workloads is redefining bandwidth expectations, forcing validation teams to move beyond 400G and embrace emerging 800G and 1.6T standards. Data center operators are reallocating budgets from legacy bit error rate tools to high-precision solutions that evaluate packet spray, forward error correction, and RoCEv2 latency under real-world congestion. Hyperscalers now request fully automated test beds that blend traffic generation, network emulation, and machine-learning-driven analytics to shorten development cycles. Supply bottlenecks for PAM4 optics and a shortage of 224 Gbps channel-design experts keep delivery lead times long and price points high, yet vendors that can guarantee early access to 1.6T capability are commanding premium contracts.
Key Report Takeaways
- By test type, performance and stress testing held 37.40% of the Gigabit Ethernet test equipment market share in 2025, while network emulation is projected to expand at 16.45% CAGR through 2031.[2].
- By end-user industry, telecommunications led with 36.05% revenue share in 2025, whereas data centers and cloud providers are advancing at an 17.25% CAGR to 2031.[3].
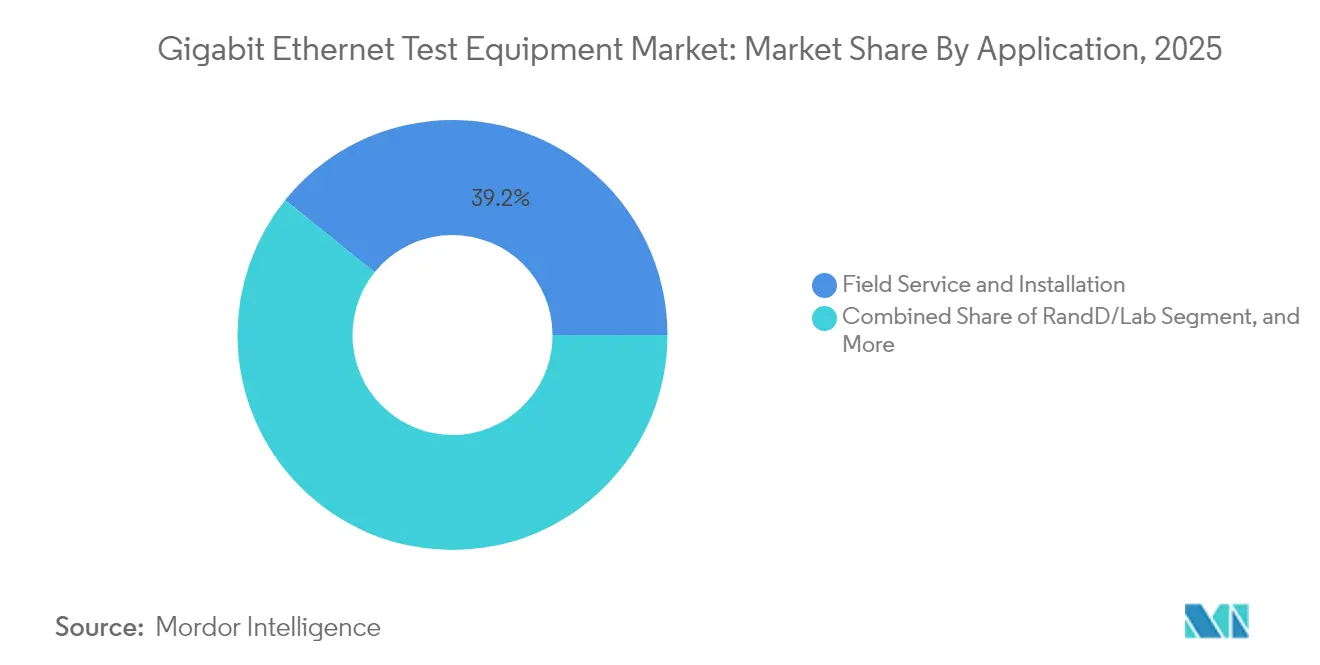
- By application, field service accounted for 39.20% of the Gigabit Ethernet test equipment market size in 2025, and R&D labs are growing at a 15.95% CAGR through 2031.
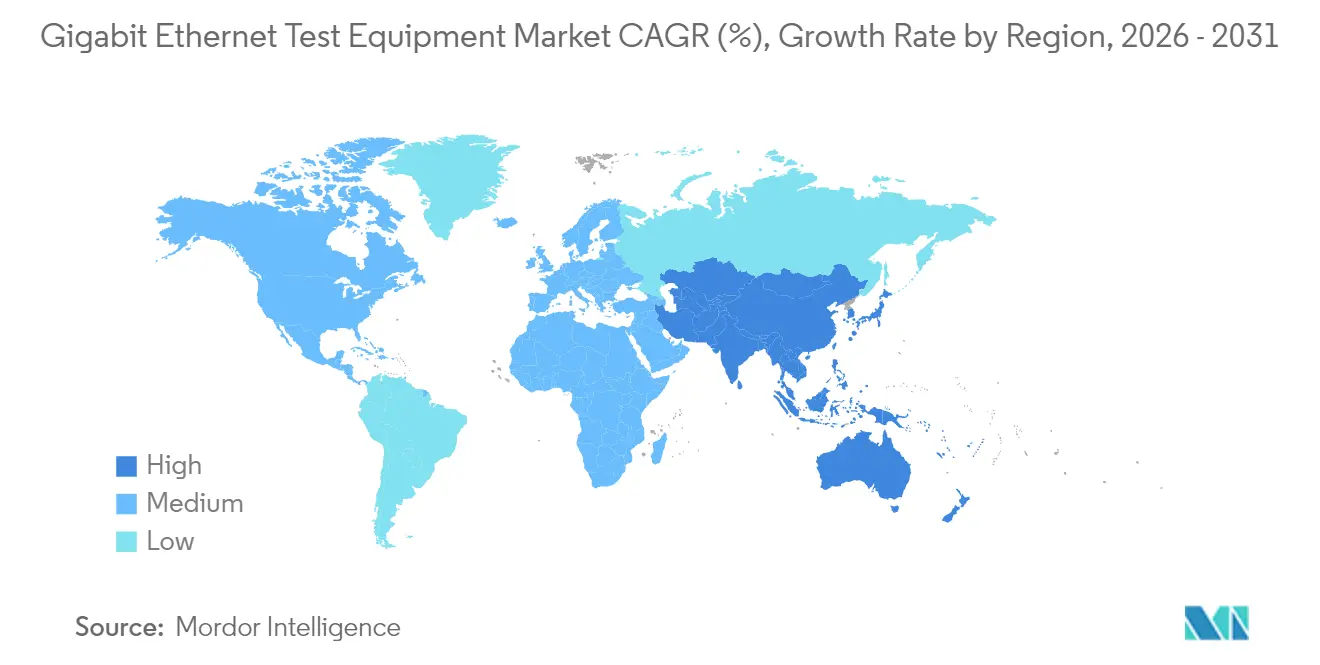
- By geography, North America commanded 32.70% revenue in 2025; Asia Pacific is the fastest growing region at a 10.05% CAGR to 2031.
- Keysight, VIAVI, and Anritsu together controlled about 44.60% of global sales in 2025, reflecting intensifying consolidation across ultra-high-speed validation niches.
Note: Market size and forecast figures in this report are generated using Mordor Intelligence’s proprietary estimation framework, updated with the latest available data and insights as of 2026.
Global Gigabit Ethernet Test Equipment Market Trends and Insights
Drivers Impact Analysis*
| Driver | (~) % Impact on CAGR Forecast | Geographic Relevance | Impact Timeline |
|---|---|---|---|
| AI cluster demand for 800G / 1.6T testing | +2.1% | Global, concentrated in North America and China | Medium term (2-4 years) |
| Adoption of cloud services and big data | +1.8% | Global, led by North America and Europe | Long term (≥ 4 years) |
| Growth in mobile backhaul | +1.2% | APAC core, spill-over to MEA | Medium term (2-4 years) |
| Increased Ethernet use in manufacturing | +0.9% | Europe and North America, expanding to APAC | Long term (≥ 4 years) |
| 2.5 / 5 GbE upgrades on legacy cabling | +0.3% | Global, enterprise-focused | Short term (≤ 2 years) |
| RoCEv2-driven ultra-low-latency validation | +0.2% | North America and Europe data centers | Medium term (2-4 years) |
| Source: Mordor Intelligence | |||
AI Cluster Infrastructure Drives 800G Testing Demand
- Artificial intelligence training pushes bandwidth requirements beyond conventional 400G, compelling operators to adopt 800G and 1.6T links that demand fresh validation strategies. Current clusters need 1 Tbps per xPU, stressing SerDes designs that shift from NRZ to PAM4 modulation, which in turn mandates eye-opening precision for signal-to-noise ratio analysis. Vendors now bundle high-speed oscilloscopes with automated de-embedding software so engineers can characterize sub-10-ps unit intervals in minutes rather than days. The Ultra Ethernet Consortium is finalizing v1.0 specifications that extend beyond IEEE 802.3, adding congestion management tests never seen in legacy Ethernet. Early movers that deliver 1.6T capability are winning multi-year framework deals with hyperscalers eager to future-proof AI fabrics. These projects accelerate revenue for companies able to link optics, traffic generation, and analytics into a single orchestration layer.
Cloud Services Expansion Accelerates Multi-Speed Testing
Cloud providers deploy mixed 100G, 400G, and 800G topologies to balance performance and cost across variable workloads, creating a need for test rigs that validate several speeds concurrently. Forward error correction, particularly RS-FEC, is essential at those rates, so solutions must monitor real-time parity blocks without masking latent defects. Emulation engines now replay days of traffic logs to reproduce microburst congestion while maintaining sub-microsecond latency metrics. Operators request programmable APIs that integrate with CI/CD toolchains, enabling daily regression of network upgrades. The result is rising demand for virtualized test labs that cut hardware capex yet still provide deterministic performance baselines.
Manufacturing Ethernet Adoption Creates Industrial Testing Opportunities
Process industries are migrating to Ethernet-APL at 10 Mbps on two-wire infrastructure, stimulating fresh demand for intrinsically safe compliance testing that merges power and data validation. Time-sensitive networking features such as IEEE 802.1AS and 802.1Qbv require deterministic latency verification, elevating the role of precision timestamp generators. Automotive OEMs continue to extend 100BASE-T1 and 1000BASE-T1 designs toward 10GBASE-T1, and specialized oscilloscopes with automated fixture compensation now dominate lab benches. The industrial wave diversifies revenue away from hyperscale data centers, rewarding vendors with modular platforms able to swap between harsh-environment Ethernet, Industrial Ethernet, and automotive compliance suites. Service labs responding to this shift report double-digit order growth for ruggedized adaptors and field-portable analyzers.
Legacy Infrastructure Upgrades Drive Multi-Gigabit Testing
Enterprises upgrading from 1 GbE to 2.5 G and 5 G on existing Cat 5e / 6 cabling avoid forklift rewires yet still require assurance that NBASE-T links negotiate flawlessly. Multi-rate hand-shakes create new corner cases for auto-negotiation, flow control, and PoE load balancing. The Ethernet Alliance certification program is expanding to validate both data throughput and power delivery at higher wattage budgets, pushing meter probes and thermal sensors into common site acceptance test kits. Portable testers now include integrated cable certification and traffic generation, allowing technicians to replicate R&D grade diagnostics in the field. This upgrade cycle boosts near-term revenue for handheld equipment specialists and drives recurring software license sales for ongoing health monitoring.
Restraints Impact Analysis*
| Restraint | (~) % Impact on CAGR Forecast | Geographic Relevance | Impact Timeline |
|---|---|---|---|
| Lack of technical expertise | -1.4% | Global, acute in emerging markets | Long term (≥ 4 years) |
| Complex measurement accuracy limits | -0.8% | Global, concentrated in high-speed applications | Medium term (2-4 years) |
| Energy and thermal constraints in 800G rigs | -0.6% | North America and Europe data centers | Short term (≤ 2 years) |
| Supply-chain bottlenecks for PAM-4 optics | -0.5% | Global, semiconductor-dependent regions | Medium term (2-4 years) |
| Source: Mordor Intelligence | |||
Technical Expertise Shortage Constrains Market Expansion
Moving from NRZ to PAM4 demands engineers competent in de-skewing, symbol error plotting, and 224 Gbps channel modeling, skills still rare across global labor pools.[4]Keysight Technologies, “224 Gbps Channel Characterization Guide,” keysight.com Many service providers rely on automated algorithms to interpret eye height and jitter budgets, yet complex failures still need human insight. Fiber inspection campaigns such as “Inspect Before You Connect” show how deficit skills inflate installation error rates. Training pipelines lag behind technology roadmaps, compelling vendors to embed AI-driven wizards that configure instruments based on minimal user input. Nevertheless, advanced troubleshooting of PAM4 crosstalk, skew, and FEC margin remains a manual discipline, keeping project timelines vulnerable to talent shortages.
Measurement Accuracy Limitations Impede High-Speed Validation
PAM4’s four-level signaling shrinks voltage margins, increasing sensitivity to noise and crosstalk at 800G and beyond. Test platforms must deliver sub-90 fs intrinsic jitter and sustain less than 15 µW optical noise to meet 1.6T requirements, stretching current hardware to physical limits. Optical bandwidth rules shift too, with the IEEE defining a -3 dB e point at half the baud rate for PAM4 rather than three-quarters of the bit rate for NRZ. Achieving consistent results demands temperature-controlled fixtures and advanced DSP filtering that smaller labs often cannot afford. These precision barriers slow equipment adoption in price-sensitive segments and leave some early deployments under-instrumented.
*Our forecasts treat driver/restraint impacts as directional, not additive. The impact forecasts reflect baseline growth, mix effects, and variable interactions.
Segment Analysis
By Type: 800G Platforms Challenge 10 GbE Dominance
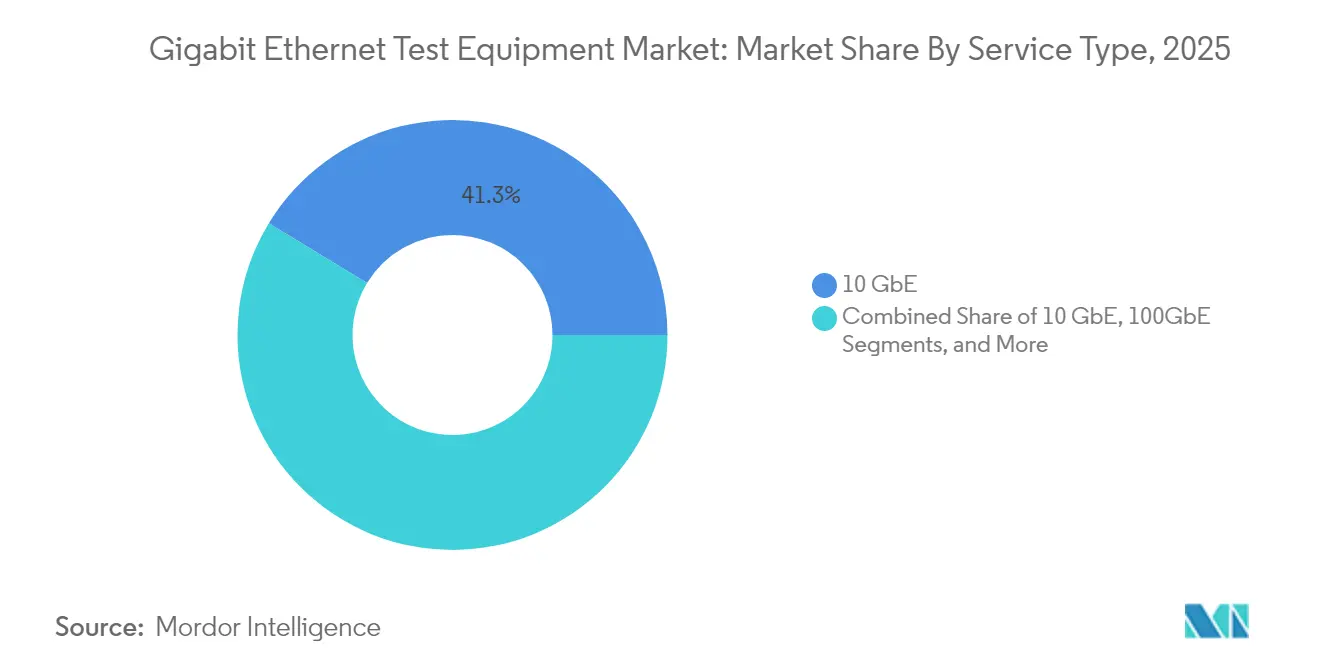
The 10 GbE category retained 41.30% of the Gigabit Ethernet test equipment market share in 2025, underscoring its entrenched presence in enterprise switching backbones. Yet 800 GbE and 1.6 TbE rigs are set to grow at 20.10% CAGR to 2031, the fastest pace of any speed grade, fueled by AI cluster architectures that need line-rate validation at 224 Gbps per lane. Keysight’s AresONE platform streams 6.4 Tbps of test traffic, marking a leap that positions the Gigabit Ethernet test equipment market size for ultra-high-speed gear at USD 548.3 million by 2031, according to Keysight. Meanwhile 25/40/50 GbE and 100 GbE serve as cost-efficient stepping-stones, especially where legacy optics ecosystems lower migration risk. Semiconductor vendors such as Marvell accelerate the shift by sampling 3 nm PAM4 DSPs that drop module power by 20%, extending cooling envelopes inside dense chassis.
Buyers weigh upgrade timing against standards maturity. 400 GbE enjoys mature RS-FEC profiles, so projects chasing rapid returns still favor it. Conversely, engineering labs evaluating 1.6 T are ordering mixed-speed chassis that combine 800 G blades for immediate needs and empty cages ready for future 1.6 T pluggables. This flexibility stabilizes capital planning while protecting early adopters from obsolescence. As hyperscalers roll out fabric upgrades in six-month sprints, vendors that ship field-upgradeable hardware and perpetual software licenses gain recurring revenue streams. The transition compresses product lifecycles, shifting competitive focus from hardware bill-of-materials to programmable feature velocity.


By End-user Industry: Data Centers Accelerate Past Telecommunications
Telecommunications captured 36.05% of 2025 revenue due to 5G backhaul rollouts, yet data centers and cloud providers are expanding at an 17.25% CAGR to 2031, overtaking telcos in absolute spending by 2027. AI workload density drives data centers to validate lossless packet spraying, sub-microsecond jitter, and RoCEv2 congestion control concurrently, all of which exceed traditional telco metrics. Automotive and transport OEMs ramp Ethernet compliance to support driver assistance and autonomous stacks, creating demand for rugged oscilloscopes and EMI chambers capable of 10GBASE-T1 characterization.
Meanwhile, manufacturing outfits accelerate Ethernet-APL pilots within hazardous zones, requiring intrinsically safe testers that double as power loop analyzers. A&D integrators need equipment that withstands vibration, temperature extremes, and electromagnetic pulse, compelling suppliers to adapt military-grade enclosures. Utilities and healthcare specify deterministic fail-safe protocols, pushing test plans to verify zero-loss protection switching and cyber-hardened firmware. These cross-sector nuances pressure vendors to offer modular platforms that slot vertical-specific compliance packages on demand, a strategy that tempers R&D overhead while addressing divergent regulatory frameworks.
By Application: R&D Labs Drive Innovation Testing
Field service dominated with 39.20% revenue in 2025 as crews troubleshoot multi-vendor networks, yet R&D and lab deployments are rising at 15.95% CAGR, reaching a projected 36.50% revenue share by 2031. Labs now stage full-fabric replicas to validate AI topologies before field rollout, blending traffic generators, optical T&M, and power analytics under a single orchestration dashboard. Handheld testers are mirroring this complexity, integrating packet replay, cable certification, and PoE load-testing to shorten mean-time-to-repair during service calls.
Manufacturing and production sites rely on all-in-one BERTs to certify optical transceiver quality at scale, and the Gigabit Ethernet test equipment market size for production-grade units is forecast at USD 356.4 million by 2031, translating to a 5.08% CAGR. Certification labs expand concurrently, driven by new IEEE sub-clauses for automotive, industrial, and 1.6 T interfaces. Vendors that embed automated standards libraries help users keep pace without manual script updates, reducing compliance cycles from weeks to days.
By Test Type: Network Emulation Emerges as Growth Leader
Performance and stress testing instruments still deliver 37.40% of total sales thanks to their central role in capacity planning, but network emulation is growing at 16.45% CAGR due to its ability to recreate latency, jitter, and packet loss under deterministic control. Organizations running RoCEv2 on AI fabrics need to model congestion tree collapse at microburst scales, scenarios that static BERTs cannot reproduce. Functional and traffic generation suites remain essential for baseline interoperability, while compliance testing rides rising standardization in automotive and industrial IoT.
The Gigabit Ethernet test equipment market benefits from open API frameworks that let DevOps teams spin up virtual ports inside CI/CD pipelines, shrinking test windows from hours to minutes. Meanwhile, university labs such as UNH-IOL define new interoperability plans, offering reference scripts that ship pre-loaded on commercial equipment. These contributions standardize edge-case coverage and mitigate vendor lock-in, although proprietary extensions for congestion telemetry and FEC visibility keep premium licensing models intact.
Geography Analysis
North America holds 32.70% revenue thanks to concentrated semiconductor R&D and aggressive AI cluster deployments that mandate 800G qualification in record time. United States cloud providers anchor most orders, but Canada gains traction through broadband revitalization and industrial Ethernet upgrades. Mexico leverages nearshoring trends to expand automotive harness manufacturing, raising demand for T1 compliance kits. Low energy costs in some states attract additional data center builds, yet the high power draw of 800G rigs prompts sustainability audits that may influence procurement cycles.
Asia Pacific leads growth at 10.05% CAGR on the back of China’s hyperscale expansion and localized 1.6 T optics supply chains. Japan’s auto sector champions deterministic Ethernet stacks that require stringent EMC validation, while Korea pushes semiconductor fabs into 3 nm class, needing ultra-fast jitter and crosstalk probes. ASEAN states deploy 5G backhaul and smart factory pilots, generating orders for multi-rate handheld analyzers. India’s policy incentives spur telco equipment manufacturing and software defined network labs, though patchy infrastructure and a talent shortfall temper near-term adoption.
Europe charts steady gains with German OEMs formalizing in-vehicle Ethernet test plans and industrial operators embracing Ethernet-APL inside process plants. The United Kingdom modernizes fiber backbone networks, fueling demand for portable OTDRs and BERTs. France and Spain invest in renewable energy grid upgrades that require deterministic sub-station Ethernet testing. The Middle East channels oil revenues into greenfield data centers in the Gulf, while African miners commission ruggedized PoE testers for harsh environments. South America remains modest but stable, driven by Brazilian telco upgrades and Argentine automotive wire harness exports.

Competitive Landscape
Consolidation is reshaping the Gigabit Ethernet test equipment market. Keysight acquired Spirent for USD 1.46 billion, then divested the high-speed Ethernet portfolio to VIAVI for USD 410 million to address antitrust concerns and focus on 1.6 T research. VIAVI now integrates that business with its ONE LabPro platform, enabling 64 × 1.6 T ports per chassis that target AI cluster deployments. Anritsu emphasizes optical transceiver verification and recently added fixed broadband assurance analytics that pivot toward proactive quality-of-experience monitoring.
Technology differentiation hinges on PAM4 fidelity and software-defined test orchestration. Keysight’s new DCA-M sampling scopes deliver sub-90 fs jitter, capturing lane integrity at 120 GBaud without external clock recovery. Lumentum introduces 400 Gbps-per-lane InP chips and efficient 200 Gbps PAM4 lasers aimed at lowering optical power budgets inside AI fabrics. Marvell’s Ara platform moves the silicon node to 3 nm, slicing optical module power by one-fifth and enabling denser switch cards. Emerging players such as Candela Technologies and EXFO compete on flexible software stacks that spin virtual ports in public clouds, a model appealing to mid-tier operators that want subscription billing rather than capex.
Standardization forums have become a strategic arena. The Ultra Ethernet Consortium now counts more than 100 companies, including optics suppliers, silicon houses, and test vendors, all vying to shape congestion management rules that dictate future instrument features. Early participation helps vendors pre-align hardware roadmaps, cutting time to revenue when final specs release. However, the specialized skills and capital required for sub-pico-second measurement still create high barriers to entry, anchoring incumbent leadership even as smaller firms aim to carve software niches.
Gigabit Ethernet Test Equipment Industry Leaders
Anritsu Corp.
Spirent Communications PLC
Keysight Technologies Inc. (Ixia)
Viavi Solutions Inc.
Exfo Inc.
- *Disclaimer: Major Players sorted in no particular order


Recent Industry Developments
- March 2025: Keysight Technologies launched DCA-M sampling oscilloscopes for 1.6 T optical transceiver testing with less than 15 µW noise and less than 90 fs jitter.
- March 2025: VIAVI Solutions agreed to acquire Spirent’s high-speed Ethernet and security testing business from Keysight for USD 410 million with USD 15 million earn-out.
- January 2025: Lumentum showcased InP chips enabling scalable AI data centers with 400 Gbps and 200 Gbps per lane optics.
- December 2025: Marvell introduced the Ara 3 nm 1.6 Tbps PAM4 platform cutting optical module power by 20%


Research Methodology Framework and Report Scope
Market Definitions and Key Coverage
Our study defines the gigabit Ethernet test equipment market as all purpose-built hardware instruments that generate, impair, capture, or analyze packet traffic from 1 GbE up to 1.6 TbE speeds across optical or copper media; coverage spans portable field sets, modular chassis, and high-density rack solutions used in R&D, manufacturing, data center turn-up, and live-network assurance. According to Mordor Intelligence, the market was valued at USD 1.39 billion in 2025 and is forecast to reach USD 1.90 billion by 2030, advancing at 6.45% CAGR.
Scope exclusion: purely software analyzers that rely on host NICs without dedicated physical-layer test interfaces are outside this definition.
Segmentation Overview
- By Type
- 1 GbE
- 10 GbE
- 25/40/50 GbE
- 100 GbE
- 400 GbE
- 800 GbE and 1.6 TbE
- By End-user Industry
- Telecommunications
- Data Centers and Cloud
- Manufacturing
- Automotive and Transport
- Aerospace and Defense
- Others (Utilities, Healthcare)
- By Application
- RandD/Lab
- Manufacturing/Production
- Field Service and Installation
- Certification and Compliance
- By Test Type
- Functional / Traffic Generation
- Performance / Stress
- Compliance / Conformance
- Network Emulation
- By Geography
- North America
- United States
- Canada
- Mexico
- South America
- Brazil
- Argentina
- Rest of South America
- Europe
- Germany
- United Kingdom
- France
- Italy
- Spain
- Russia
- Rest of Europe
- Asia Pacific
- China
- India
- Japan
- South Korea
- ASEAN
- Rest of Asia Pacific
- Middle East and Africa
- Middle East
- Saudi Arabia
- UAE
- Turkey
- Rest of Middle East
- Africa
- South Africa
- Nigeria
- Rest of Africa
- Middle East
- North America
Detailed Research Methodology and Data Validation
Primary Research
We spoke with validation engineers at telecom carriers, hyperscale data-center architects, calibration-lab managers, and component suppliers across North America, Europe, and Asia. These conversations clarified port mix shifts, typical selling prices of 400 G/800 G BERT modules, and expected refresh cycles, letting us adjust desk-research assumptions and triangulate final totals.
Desk Research
Our analysts first compiled supply-side baselines from open datasets such as ITU broadband indicators, IEEE 802.3 plenary minutes, FCC Network Measurement logs, and CAICT optical transceiver export files, which reveal port shipments and adoption curves. Trade associations like the Ethernet Alliance, SEMI, and OIF supply road-map timing, while public filings, investor decks, and press releases illuminate vendor revenue splits. Paid libraries, D&B Hoovers for company financials and Dow Jones Factiva for global roll-outs, help refine regional splits. Many additional secondary materials were reviewed; the list above is illustrative, not exhaustive.
Market-Sizing & Forecasting
The baseline is built through a top-down reconstruction of test-asset demand from global high-speed port installations, spectrum-adjusted for 5G backhaul circuits, AI cluster buildouts, and automotive Ethernet penetration. Select bottom-up supplier roll-ups and channel checks validate totals before iterative alignment. Key variables include: 1) annual shipments of >100 GbE optical ports, 2) average calibration interval driving replacement, 3) share of ports requiring multi-protocol stress testing, 4) blended ASP trends for 112 G PAM-4 BERT blades, and 5) regional datacenter add-square-footage. A multivariate regression incorporating those drivers plus GDP-weighted IT capex projects forward values through 2030 and flags scenario bands where port shipments or ASP lines deviate materially. Gap pockets in bottom-up counts are filled using three-year rolling averages from shipment databases.
Data Validation & Update Cycle
Outputs pass anomaly scans, variance checks against historical ratios, and peer review by a senior analyst panel. We refresh the model every twelve months and trigger interim updates when major product releases, large M&A moves, or standard-setting milestones materially shift the outlook. A final sanity pass occurs immediately before publication to ensure clients receive the most current view.
Why Mordor's Gigabit Ethernet Test Equipment Baseline Stands Out
Published estimates often differ because firms choose dissimilar speed brackets, end-use mixes, and refresh cadences.
Our disciplined scoping, port-level demand modeling, and annual refresh keep figures transparent and reusable for planning.
Benchmark comparison
| Market Size | Anonymized source | Primary gap driver |
|---|---|---|
| USD 1.39 B (2025) | Mordor Intelligence | |
| USD 1.33 B (2024) | Regional Consultancy A | Excludes 800 G/1.6 T instruments and focuses mainly on telecom operators |
| USD 1.62 B (2024) | Global Consultancy B | Bundles lower-speed Ethernet and industrial fieldbus testers; relies on vendor revenue extrapolation only |
These comparisons show that when speed tiers, application breadth, and validation steps diverge, totals shift noticeably. Mordor's blended approach offers a balanced, clearly traceable baseline that decision-makers can depend on.


Key Questions Answered in the Report
What is the current value of the Gigabit Ethernet test equipment market?
The market is valued at USD 1.48 billion in 2026 and is projected to reach USD 2.01 billion by 2031, reflecting a 6.38% CAGR over 2026-2031.
Which test type is growing the fastest?
Network emulation leads with a 16.45% CAGR because it replicates real-world congestion and latency scenarios required for AI clusters.
Which region is expanding most quickly?
Asia Pacific shows the highest growth at a 10.05% CAGR, fueled by large-scale data center builds in China and advanced automotive Ethernet testing in Japan.
Why are 800G and 1.6T standards important?
AI workloads demand up to 1 Tbps per accelerator, so data centers are migrating from 400G to 800G and 1.6T links that need new validation methodologies.
How is consolidation shaping the competitive landscape?
Keysight’s acquisition of Spirent and subsequent divestiture to VIAVI signal intensified M&A activity as vendors seek specialization in ultra-high-speed testing niches.
What are the main challenges facing the market?
Talent shortages in PAM4 signal integrity, supply constraints for PAM4 optics, and measurement accuracy limits at 224 Gbps channels are key restraints hindering rapid deployment.
Page last updated on:


