Corporate Events Market Size and Share
Market Overview
| Study Period | 2020 - 2031 |
|---|---|
| Market Size (2026) | USD 369.65 Billion |
| Market Size (2031) | USD 686.49 Billion |
| Growth Rate (2026 - 2031) | 13.18% CAGR |
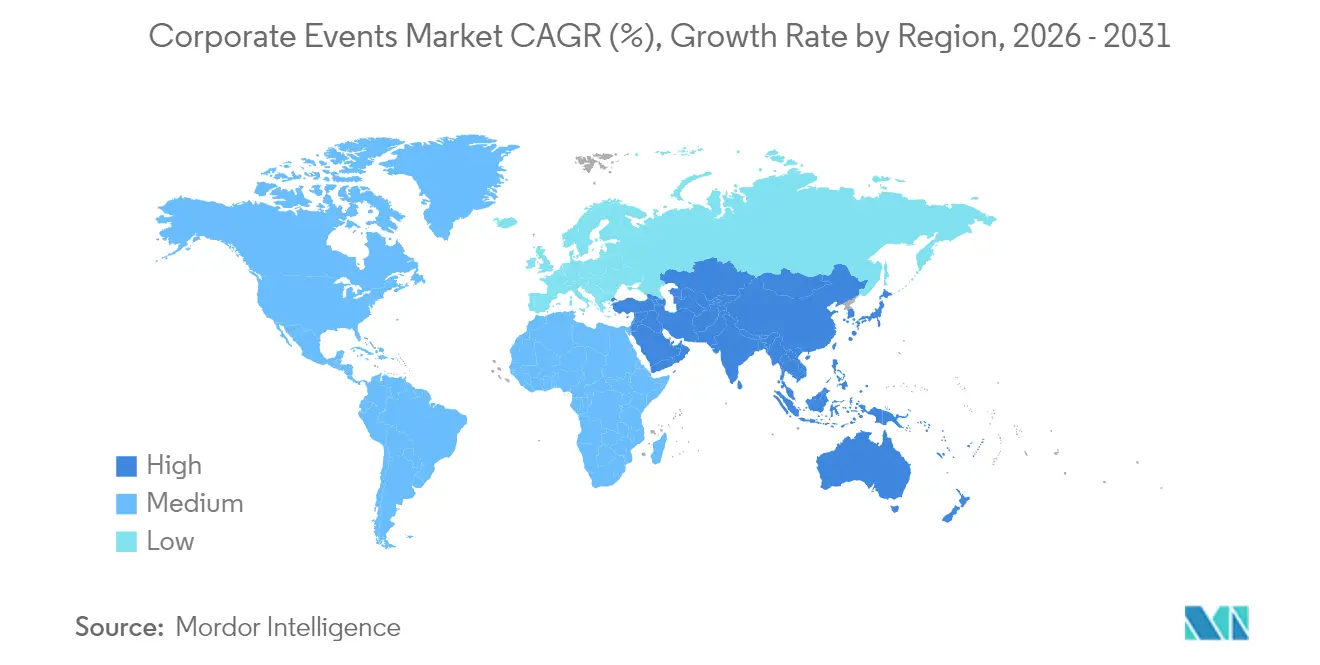
| Fastest Growing Market | Asia Pacific |
| Largest Market | North America |
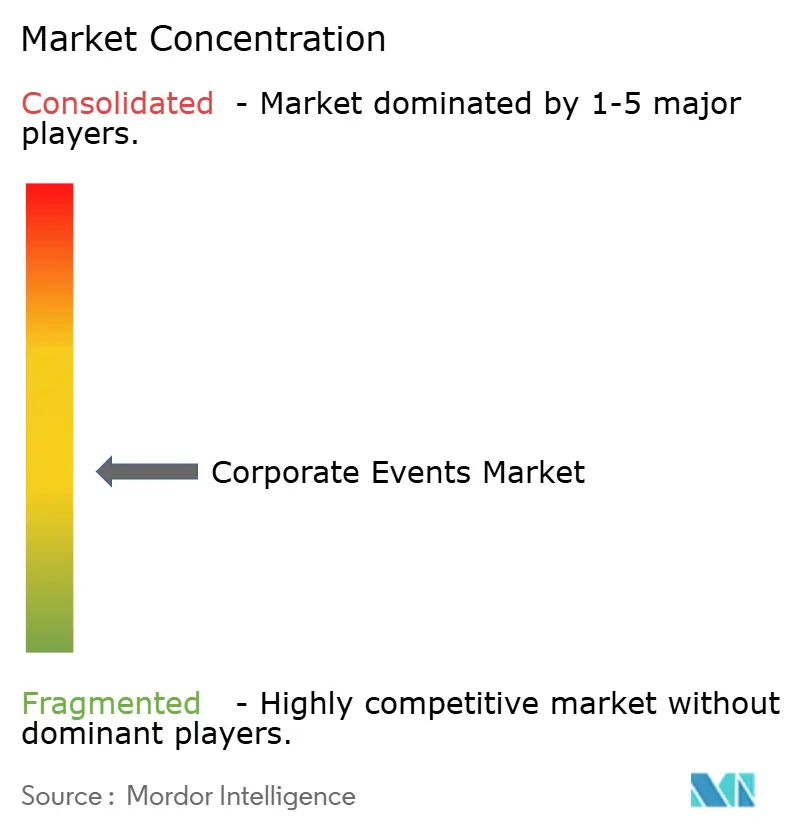
| Market Concentration | Medium |
Major Players *Disclaimer: Major Players sorted in no particular order Image © Mordor Intelligence. Reuse requires attribution under CC BY 4.0. | |
Corporate Events Market Analysis by Mordor Intelligence
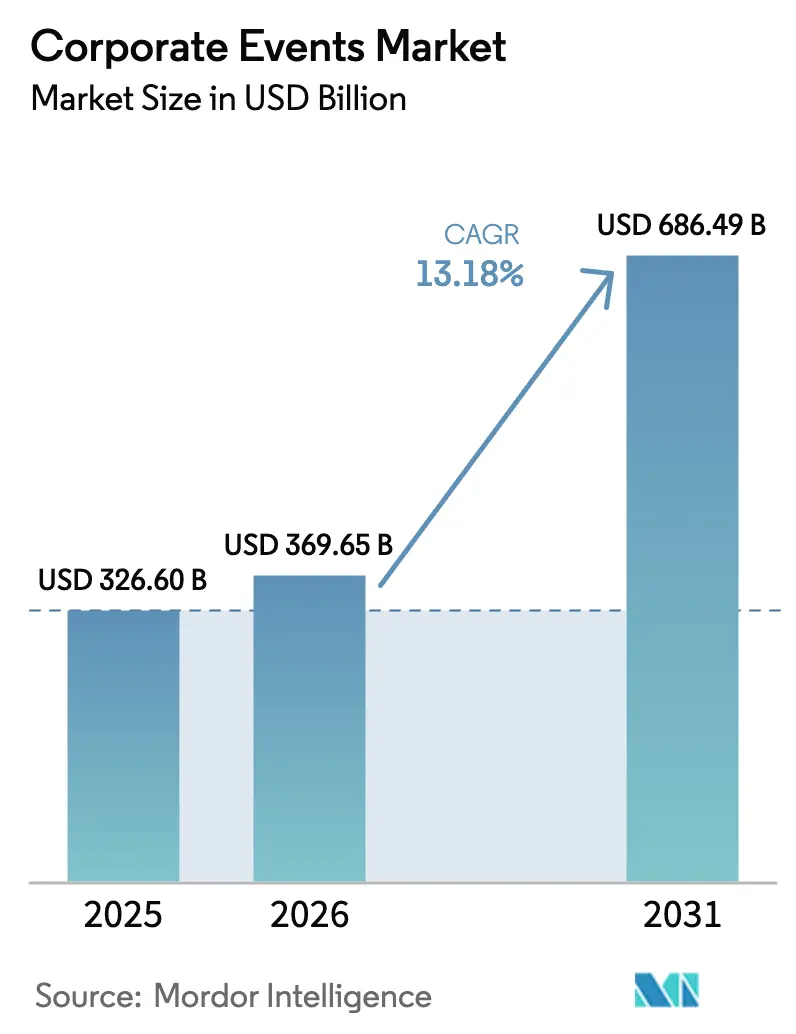
The corporate events market size was valued at USD 326.60 billion in 2025 and estimated to grow from USD 369.65 billion in 2026 to reach USD 686.49 billion by 2031, at a CAGR of 13.18% during the forecast period (2026-2031). Momentum stems from a brisk pivot toward hybrid delivery models, a deepening preference for data-rich performance metrics, and a noticeable rise in employer-branding budgets among technology and life-science companies. Fresh venue investments across the Gulf Cooperation Council (GCC) nations, stronger sustainability standards in Europe, and sophisticated incentive travel programs across Asia-Pacific are widening both revenue streams and service portfolios. At the same time, inflation-linked venue rates in Tier-1 cities and growing cyber-security compliance burdens for virtual platforms temper near-term margins. Providers that meld in-person creativity with robust analytics, while diversifying geographic exposure, are positioned to capture the next leg of growth in the corporate events market.
Key Report Takeaways
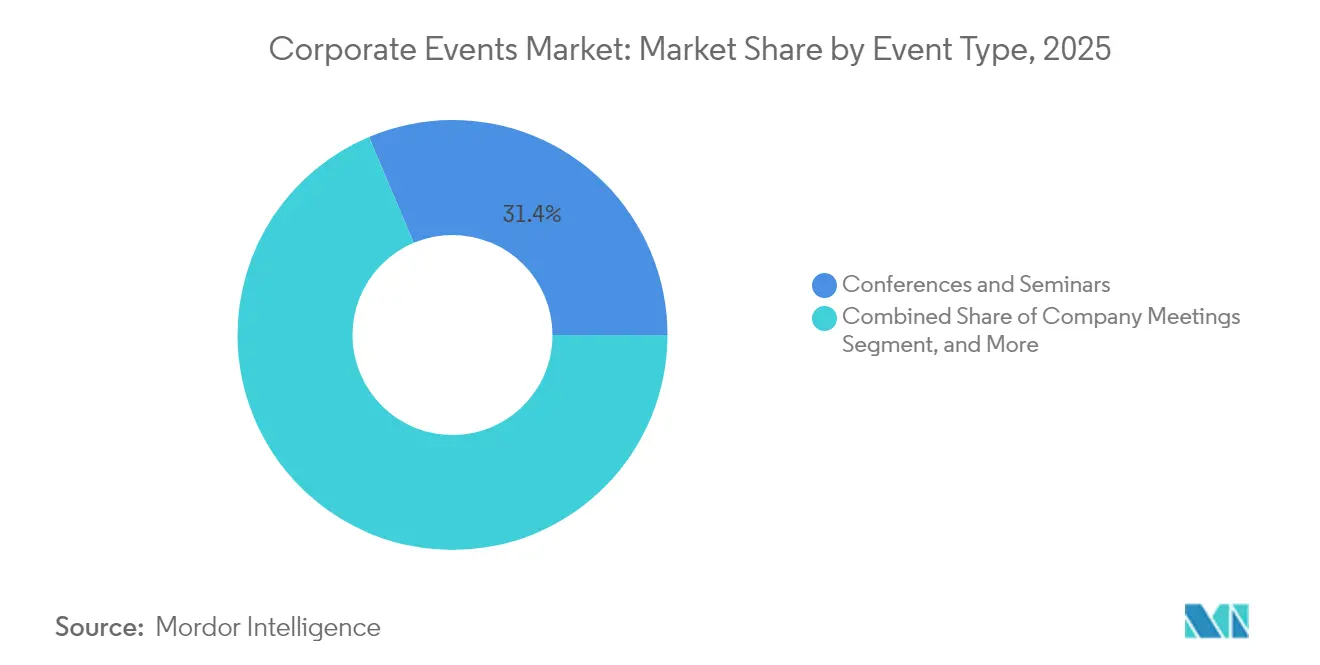
- By event type, conferences and seminars led with 31.35% of corporate events market share in 2025, while product launches are projected to grow at a 15.12% CAGR through 2031.
- By platform, offline formats accounted for 67.15% of the corporate events market size in 2025; hybrid models are projected to expand at an 17.65% CAGR over 2026-2031.
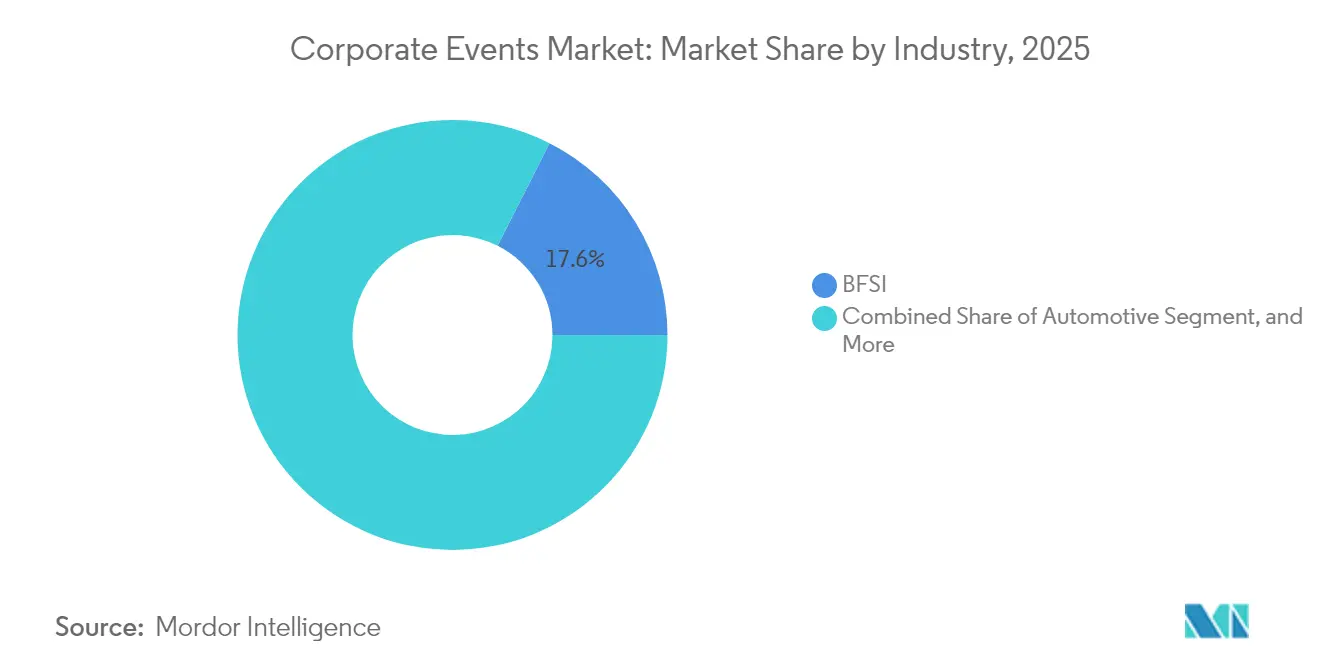
- By industry, the BFSI segment held 17.55% share of the corporate events market size in 2025, whereas the information technology segment is projected to register the fastest 17.28% CAGR to 2031.
- By service type, planning and management services captured 39.25% of corporate events market size in 2025; virtual event technology services are advancing at a 20.45% CAGR during 2026-2031.
- By geography, North America held 34.60% of corporate events market share in 2025; Asia-Pacific is poised to post the quickest 16.22% CAGR through 2031.
Note: Market size and forecast figures in this report are generated using Mordor Intelligence’s proprietary estimation framework, updated with the latest available data and insights as of 2026.
Global Corporate Events Market Trends and Insights
Drivers Impact Analysis*
| Driver | (~) % Impact on CAGR Forecast | Geographic Relevance | Impact Timeline |
|---|---|---|---|
| Escalating employer branding spend among technology and pharmaceutical firms | +2.10 | North America with spillover to Europe | Medium term (2-4 years) |
| Growing adoption of hybrid event platforms within European MICE sector | +3.20 | Europe with broader global uptake | Short term (≤ 2 years) |
| Surge in incentive travel programs tied to Asia-Pacific sales-force retention | +2.80 | Asia-Pacific with expansion to Middle East and Africa | Medium term (2-4 years) |
| Demand for data-rich event ROI analytics from BFSI organizers | +1.90 | Global, concentrated in financial hubs | Short term (≤ 2 years) |
| Rising government-backed exhibition grants across GCC nations | +1.50 | Middle East, notably UAE and Saudi Arabia | Medium term (2-4 years) |
| Expansion of sustainable venue certifications | +1.80 | Global with early adoption in Europe and North America | Long term (≥ 4 years) |
| Source: Mordor Intelligence | |||
Escalating Employer-Branding Spend Among Tech and Pharma Corporations
Employer-branding budgets are climbing as tech and life-science firms compete for scarce talent. North Carolina alone secured USD 10.8 billion in life-science investments from 25 firms in 2024, creating more than 4,500 jobs. [1]North Carolina Biotechnology Center, “North Carolina Booked Over USD 10 Billion in Life-Sciences Investments 2024,” ncbiotech.org Corporations convert a rising share of these budgets into bespoke hiring events that showcase culture, career paths, and social-impact credentials. Because these engagements shorten time-to-hire and reduce turnover, finance teams regard them as measurable cost-avoidance tools, ensuring continued budget protection even during spending slowdowns. The trend lifts premium demand for distinctive venues, advanced registration software, and post-event analytics that link attendance to offer acceptance rates.
Growing Adoption of Hybrid Event Platforms Across the European MICE Sector
Hybrid design has shifted from emergency measure to mainstream model. Sixty-two percent of European planners keep a virtual layer in place. Cost per attendee for hybrid formats is 45-60% lower than fully in-person alternatives, while carbon emissions decline 30-45%. Mature hubs such as London and Paris use hybrid options to offset venue constraints and meet net-zero objectives, whereas second-tier cities leverage the model to broaden global reach at competitive price points. The practice is also prompting traditional audiovisual suppliers to add streaming studios, data-capture APIs, and mixed-reality stages.
Surge in Incentive Travel Programs Linked to Asia-Pacific Sales-Force Retention Campaigns
Asia-Pacific companies are revamping incentive travel to combat high sales-staff turnover, blending professional growth, wellness, and authentic cultural immersion. The Asia-Pacific Incentives and Meetings Event (AIME) 2025 generated USD 400 million in projected business, marking a 21% jump over the prior year. [2] AIME, “AIME 2025 Generates USD 400 Million for Asia-Pacific,” aime.com.au This expansion reflects corporates’ fresh willingness to align trips with diversity, equity, and inclusion goals while embedding carbon-offset initiatives. Destinations such as Singapore and Bali market turnkey sustainability packages, and regional airlines now provide automated emissions reporting, easing corporate compliance with emerging disclosure rules.
Rising Government-Backed Exhibition Grants in GCC Nations
Saudi Arabia projects its events sector to grow from USD 2.38 billion in 2024 to USD 3.45 billion in 2029. Abu Dhabi’s Adnec Group contributed USD 2.3 billion to the UAE economy in 2024 through more than 1,000 events. Subsidies cover venue fees, visa facilitation, and targeted marketing, drawing global organizers that re-export knowledge and standards to their home regions. The influx lifts hotel occupancy and airline yields while spurring ancillary service demand from translators to boutique destination-management firms.
Restraints Impact Analysis*
| Restraint | (~) % Impact on CAGR Forecast | Geographic Relevance | Impact Timeline |
|---|---|---|---|
| Inflation-driven venue and logistics cost spikes in Tier-1 cities | -1.80 | Global, acute in major financial centers | Short term (≤ 2 years) |
| Increasing cyber-security compliance burden for virtual platforms | -1.20 | Global with stricter rules in EU and North America | Medium term (2-4 years) |
| Volatile currency fluctuations squeezing incentive travel budgets | -0.90 | Emerging markets in LATAM and parts of Asia-Pacific | Short term (≤ 2 years) |
| Saturation of traditional trade-fair calendars in mature European economies | -1.10 | Europe, notably Germany, France, Italy | Long term (≥ 4 years) |
| Source: Mordor Intelligence | |||
Inflation-Driven Venue and Logistics Cost Spikes in Tier-1 Cities
Average conference costs now range from USD 500 to USD 2,500 per person, and hotel RevPAR in the United States is projected to reach USD 101.82 in 2024. Price escalation squeezes margins, especially for events that guarantee rates a year in advance. Organizers respond by adopting tier-two locations, splitting programs into multiple hubs, or shortening event duration. Suppliers that can flex inventory across cities and months gain negotiation leverage and help clients preserve experience quality without overshooting budgets.
Volatile Currency Fluctuations Impacting Incentive Travel Budgets
The U.S. dollar’s 4% nominal trade-weighted gain in 2024 elevated costs for companies funding trips in local currencies [3]U.S. Department of the Treasury, “November 2024 FX Report,” home.treasury.gov. Hedging tools and mixed-currency deposits are becoming standard in event budgets, but they add complexity and administrative overhead. Some firms shift to shorter booking windows, sacrificing early-bird savings for exchange-rate clarity. Others swap long-haul destinations for regional experiences to contain exposure.
*Our forecasts treat driver/restraint impacts as directional, not additive. The impact forecasts reflect baseline growth, mix effects, and variable interactions.
Segment Analysis
By Event Type: Product Launch Momentum Redefines Format Mix
Product launches hold the quickest expansion path with a 15.12% CAGR for 2026-2031, even as conferences and seminars retain the largest slice of corporate events market size at 31.35% in 2025. Companies stage immersive unveilings that mix pop-up activations and influencer collaborations, aiming to trigger instantaneous social reach and purchase intent. UCB credited five growth drivers, including BIMZELX and RYSTIGGO, for EUR 5.6 billion (USD 6.50 billion) in 2024 net sales, reinforcing the commercial payoff from well-orchestrated launch programs.
The corporate events market benefits because launch events command premium creative production, livestream services, and robust analytics. While trade fairs remain vital B2B meeting points, their slower growth signals a pivot toward niche-focused gatherings. Incentive and reward programs are growing fastest in Asia-Pacific, where they dovetail with workforce-retention strategies. This diversification cushions suppliers against cycles in any single event type.


By Platform: Hybrid Delivery Reshapes Economics
Offline formats still dominate revenue, but hybrid events are advancing at an 17.65% CAGR, altering spending patterns across the corporate events market. Hybrid models fuse in-venue networking with digital scale, enabling organizers to sell incremental virtual tickets, offer replays, and collect granular engagement data. The global virtual-events segment earned USD 98.07 billion in 2024 and is marching ahead at a 20% CAGR.
The surge supports demand for cloud-native video infrastructure, interactive apps, and studio-grade lighting at hotels and convention centers. Venues in second-tier cities market high-bandwidth connectivity and lower room rates to entice budget-savvy planners who still seek live interaction. Providers that integrate both physical logistics and digital production deliver seamless experiences and longer post-event shelf life, reinforcing loyalty across the corporate events market.
By Industry: Technology Overtakes Traditional Leaders
The information technology vertical is set to grow 17.28% annually to 2031, outpacing BFSI’s robust yet steadier trajectory. Tech firms rely on rapid product-cycle showcases such as CES and Mobile World Congress to court developers and channel partners. Advanced Micro Devices highlights AI-driven computing roadmaps at these gatherings, illustrating the sector’s reliance on experiential demos. BFSI events preserve a strong revenue base, accounting for 17.55% of 2025 corporate events market size, thanks to high-value networking and thought-leadership forums.
Healthcare and life-science organizers stage clinical-education conferences that disseminate research findings and train practitioners. Automotive firms lean into experiential ride-and-drive expos that spotlight electric-vehicle innovation. Real-estate and infrastructure events are broadening scope to cover smart-city planning and sustainability, drawing cross-sector sponsors. Industry diversification enables agencies to buffer downturns in any one sector while honing specialized compliance and content skills.
By Service Type: Virtual Event Technology Accelerates
Planning and management services represented 39.25% of corporate events market size in 2025, yet virtual event technology holds the strongest 20.45% CAGR. Providers such as Freeman introduced AI-driven real-time summaries that convert speeches into shareable outlines, heightening attendee retention. Skidattl’s outdoor augmented-reality overlays further illustrate tech’s creative frontiers.
Venue-sourcing and logistics specialists adapt by bundling sustainability audits, flexible booking clauses, and high-capacity connectivity. On-site execution crews now manage simultaneous live streams, holographic displays, and analytics kiosks. Ancillary engagement—podcast studios, mobile gaming, or wellness corners—extends audience touchpoints beyond the core agenda. Integrated service suites safeguard margin because clients favor single-invoice simplicity across the corporate events market.
Geography Analysis
North America commands 34.60% of 2025 revenue, underpinned by the densest cluster of Fortune 500 headquarters and early uptake of hybrid tech. The U.S. Bureau of Labor Statistics pegs median annual pay for planners at USD 59,440 and projects 7% job growth from 2023-2033. Canada capitalizes on favorable exchange rates to lure international sales kickoffs, while Mexico’s resort cities pick up overflow incentive demand.
Asia-Pacific is the swiftest climber at 16.22% CAGR. AIME 2025 generated USD 400 million in new business, reflecting the region’s appetite for large-scale gatherings. Singapore aims to triple MICE receipts by 2040, offering green-certified venues and streamlined visa processes. China incubates technology showcases that align with national industrial policies, whereas India’s pharmaceutical hubs attract global clinical-research summits. Australia and New Zealand promote safe, nature-infused incentive itineraries that resonate with wellness-minded employees.
Europe maintains sizable yet mature demand. Chronic calendar congestion in Germany, France, and Italy nudges organizers toward thematic depth and hybrid extensions. The United Kingdom leads sustainability adoption, influenced by stringent corporate-reporting rules. Central and Eastern Europe present cost-efficient alternatives, with Poland’s Ptak Warsaw Expo staging more than 70 shows annually.
In the Middle East, Saudi Arabia and the UAE anchor infrastructure upgrades that court global summits. Government incentives cover marketing and utility costs, compressing ramp-up time for international brands. Latin America emerges as a value-oriented destination for reward trips, particularly in Mexico and Brazil. Africa is touted as the next frontier, fueled by rapid urbanization; Lagos, Nairobi, and Johannesburg invest in convention complexes, aiming to capture high-growth intra-African trade events.

Competitive Landscape
Competition remains fragmented, characterized by global full-service agencies, regional specialists, and tech-focused disruptors. ASM Global expanded its U.S. footprint by managing the all-electric Waco Convention Center and securing a contract for Cincinnati’s reimagined Duke Energy Convention Center. Such moves illustrate vertical integration, where venue operators blend in-house production, ticketing, and food services to secure end-to-end revenue streams.
Niche innovators employ artificial intelligence, extended reality, and blockchain ticketing to differentiate. For example, Shift + Alt Events launched an automation platform that streamlines guest communications, reducing manual workload for planners. Compliance expertise also shapes competition. Virtual-platform providers able to meet ISO 20121 and stringent EU data-protection mandates gain a pricing premium when serving regulated clients.
Sustainability credentials turn into bid differentiators. Venues investing in renewable-energy systems and zero-waste catering shorten client procurement cycles by pre-meeting ESG thresholds. Meanwhile, data ownership is a new battleground, with agencies offering bespoke analytics dashboards that integrate with CRM suites. Strategic partnerships between analytics firms and venue chains aim to create closed data loops, enhancing repeat-booking predictions and content personalization across the corporate events market.
Corporate Events Industry Leaders
BI WORLDWIDE
360 Destination Group
BCD Meetings & Events
CWT Meetings & Events
Flight Centre Travel Group (FCM)
- *Disclaimer: Major Players sorted in no particular order

Recent Industry Developments
- April 2025: The Meetings Show Asia Pacific posted a 35% attendee jump, drawing 1,773 visitors from 72 countries.
- April 2025: Nasdaq announced 11% year-on-year net-revenue growth in Q1 2025, with recurring solutions revenue up 8%.
- March 2025: AIME 2025 delivered USD 400 million in deals for the regional business-events sector.
- March 2025: Adnec Group added USD 2.3 billion to the UAE economy during 2024 through 1,000 events.


Global Corporate Events Market Report Scope
The corporate events market plans and manages business-oriented events, including conferences, trade shows, product launches, seminars, and team-building activities. These events facilitate networking and knowledge exchange, enhance brand value, and boost employee engagement. The market includes event planning, technology integration, venue management, and post-event analysis.
The corporate events markets is segmented by event type (conferences and seminars, company meetings, trade fairs and exhibitions, product launches, incentive/reward programs, other events), by platform (offline event, hybrid event, online event), by industry (BFSI, automotive, real estate & infrastructure, information technology, others), by geography (North America [United States, Canada, Mexico, and Rest of North America], Europe [Germany, United Kingdom, France, Spain, and Rest of Europe], Asia-Pacific [India, China, Japan, New Zealand, Australia and Rest of Asia-Pacific], Latin America [Brazil, Argentina, and Rest of Latin America], Middle East and Africa [United Arab Emirates, Saudi Arabia, and Rest of Middle East and Africa]).
The report offers market forecasts and size in value (USD) for all the above segments.
| Conferences and Seminars |
| Company Meetings |
| Trade Fairs and Exhibitions |
| Product Launches |
| Incentive / Reward Programs |
| Other Events |
| Offline Event |
| Hybrid Event |
| Online Event |
| BFSI |
| Automotive |
| Real Estate and Infrastructure |
| Information Technology |
| Healthcare and Life Sciences |
| Others |
| Planning and Management |
| Venue Sourcing and Logistics |
| On-site Execution |
| Virtual Event Technology |
| Ancillary Engagement Services |
| North America | United States |
| Canada | |
| Mexico | |
| South America | Brazil |
| Argentina | |
| Rest of South America | |
| Europe | Germany |
| United Kingdom | |
| France | |
| Italy | |
| Spain | |
| Rest of Europe | |
| Asia-Pacific | China |
| Japan | |
| South Korea | |
| India | |
| Australia | |
| New Zealand | |
| Rest of Asia-Pacific | |
| Middle East and Africa | United Arab Emirates |
| Saudi Arabia | |
| South Africa | |
| Rest of Middle East and Africa |
| By Event Type | Conferences and Seminars | |
| Company Meetings | ||
| Trade Fairs and Exhibitions | ||
| Product Launches | ||
| Incentive / Reward Programs | ||
| Other Events | ||
| By Platform | Offline Event | |
| Hybrid Event | ||
| Online Event | ||
| By Industry | BFSI | |
| Automotive | ||
| Real Estate and Infrastructure | ||
| Information Technology | ||
| Healthcare and Life Sciences | ||
| Others | ||
| By Service Type | Planning and Management | |
| Venue Sourcing and Logistics | ||
| On-site Execution | ||
| Virtual Event Technology | ||
| Ancillary Engagement Services | ||
| By Geography | North America | United States |
| Canada | ||
| Mexico | ||
| South America | Brazil | |
| Argentina | ||
| Rest of South America | ||
| Europe | Germany | |
| United Kingdom | ||
| France | ||
| Italy | ||
| Spain | ||
| Rest of Europe | ||
| Asia-Pacific | China | |
| Japan | ||
| South Korea | ||
| India | ||
| Australia | ||
| New Zealand | ||
| Rest of Asia-Pacific | ||
| Middle East and Africa | United Arab Emirates | |
| Saudi Arabia | ||
| South Africa | ||
| Rest of Middle East and Africa | ||


Key Questions Answered in the Report
What is the current size of the corporate events market and how fast is it growing?
The corporate events market size stands at USD 369.65 billion in 2026 and is projected to reach USD 686.49 billion in 2031, reflecting a 13.18% CAGR over the 2026-2031 forecast period.
Which region is expanding the fastest for corporate events?
Asia-Pacific leads growth with a 16.22% CAGR for 2026-2031, supported by strong incentive-travel demand and government-backed venue investment.
How important are hybrid events to future market growth?
Hybrid formats are expanding at an 17.65% CAGR, offering cost savings of up to 60% per attendee and carbon-emission reductions of up to 45%, making them a central growth driver.
Which industry vertical will generate the highest incremental demand?
Information technology events are expected to grow at 17.28% annually as firms rely on frequent product-launch cycles and developer-centric gatherings.
What primary challenge could restrain market expansion in the short term?
Inflation-driven venue and logistics cost spikes in Tier-1 cities could shave 1.8 percentage points off the base CAGR, encouraging companies to consider tier-two locations and hybrid formats.
How does sustainability influence corporate event planning?
ISO 20121:2024 and other standards push organizers toward certified eco-friendly venues; early adopters enjoy competitive advantage as clients increasingly embed ESG criteria into procurement.
Page last updated on:


