Pharmaceutical Continuous Manufacturing Market Size and Share
Market Overview
| Study Period | 2019 - 2030 |
|---|---|
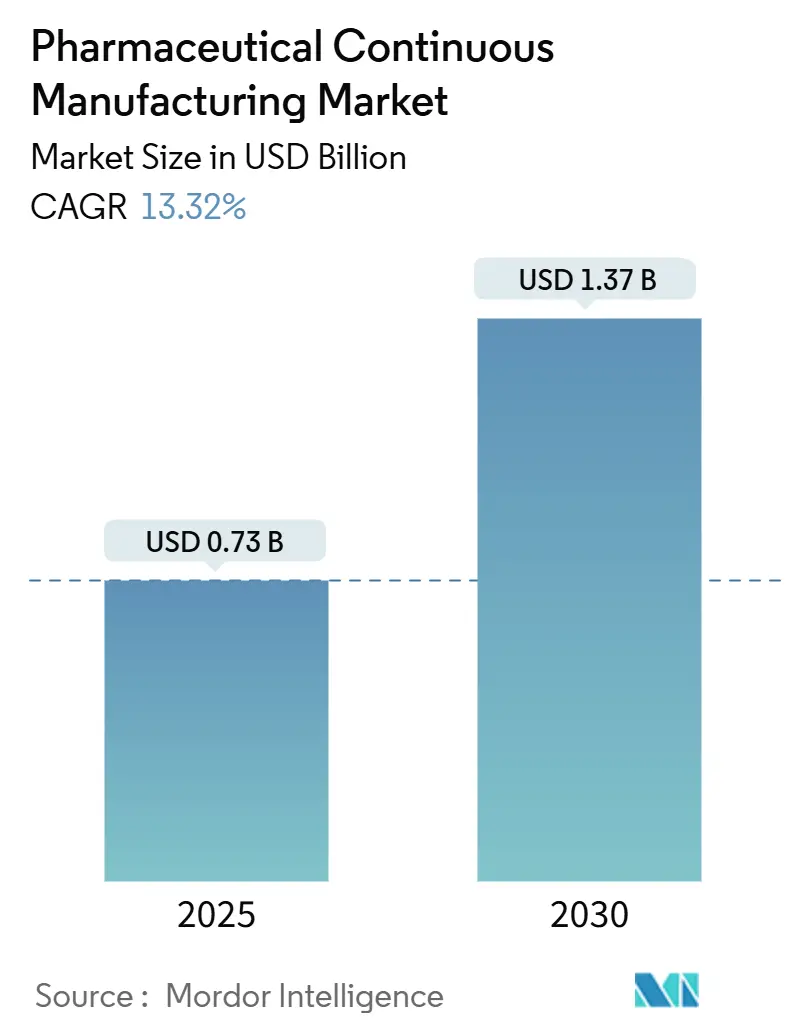
| Market Size (2025) | USD 0.73 Billion |
| Market Size (2030) | USD 1.37 Billion |
| Growth Rate (2025 - 2030) | 13.32% CAGR |
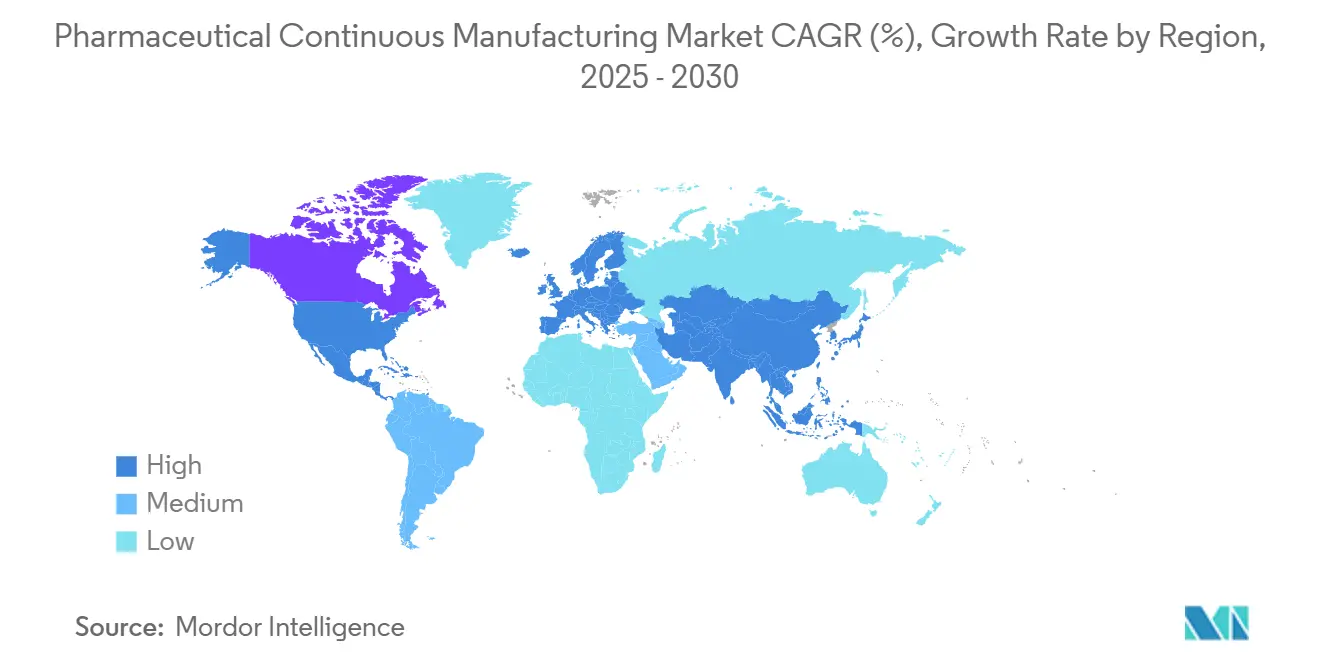
| Fastest Growing Market | Asia Pacific |
| Largest Market | North America |
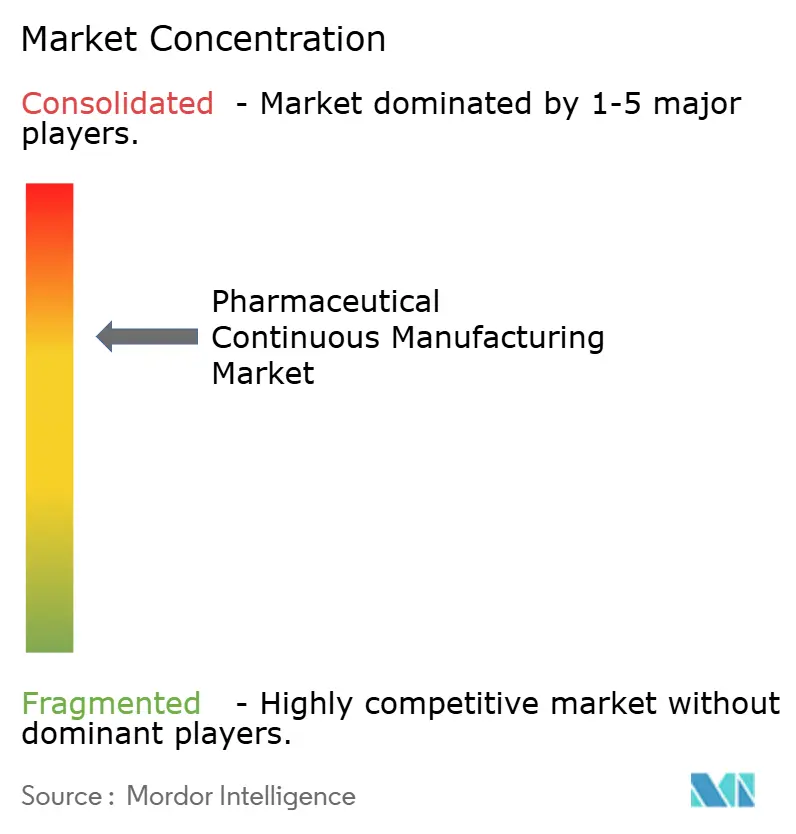
| Market Concentration | Medium |
Major Players *Disclaimer: Major Players sorted in no particular order Image © Mordor Intelligence. Reuse requires attribution under CC BY 4.0. | |
Pharmaceutical Continuous Manufacturing Market Analysis by Mordor Intelligence
The Pharmaceutical Continuous Manufacturing Market size is estimated at USD 0.73 billion in 2025, and is expected to reach USD 1.37 billion by 2030, at a CAGR of 13.32% during the forecast period (2025-2030).
The pharmaceutical continuous manufacturing market is valued at USD 0.73 billion in 2025 and is on track to reach USD 1.37 billion by 2030, reflecting a 13.32% CAGR that outpaces most other contract-services segments. Demand is fueled by rising biologics outsourcing, mounting cost-containment pressure, and a regulatory environment that increasingly favors experienced CDMOs. Large-scale investments in Industry 4.0—such as digital twins, continuous processing, and real-time release—are improving efficiency, shortening cycle times, and reducing failure rates, enabling suppliers to secure premium, multi-year contracts. Capacity constraints in high-potency APIs (HPAPIs) and advanced biologics create natural barriers to entry, while “China + 1” reshoring strategies prompt sponsors to diversify their footprints toward North America, Europe, and cost-competitive hubs across the Asia-Pacific.
Key Report Takeaways
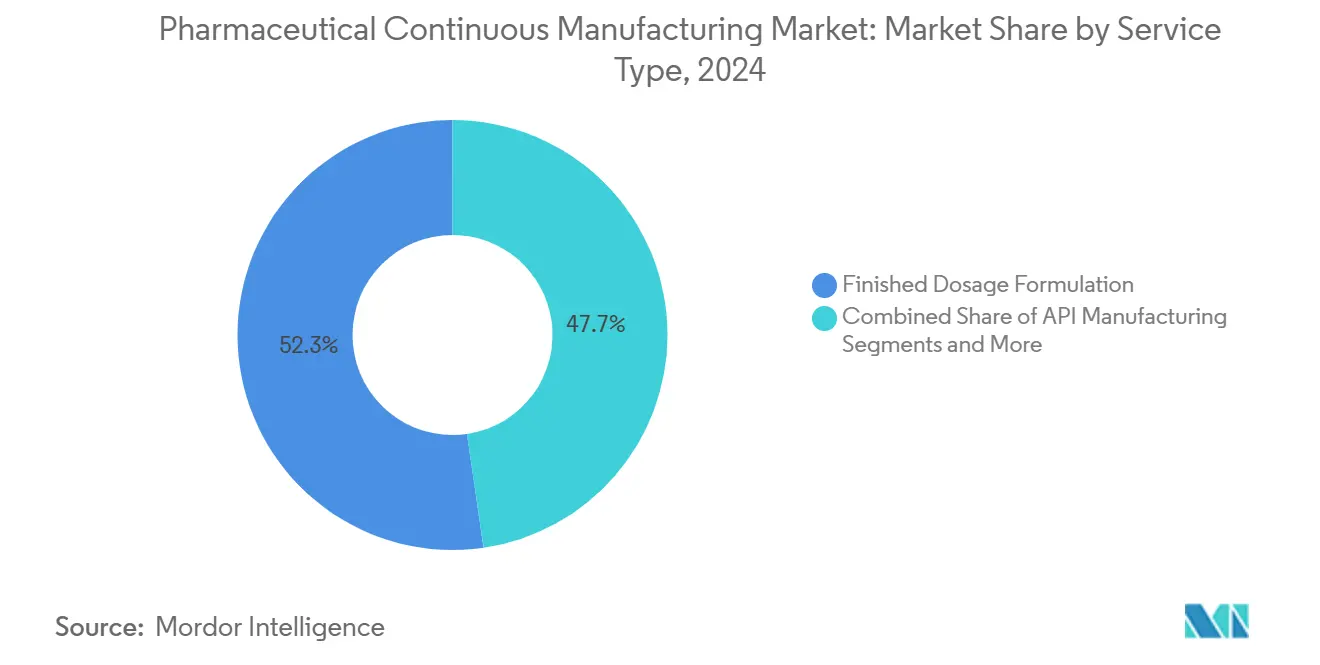
- By service type, finished dosage formulation led with 52.35% revenue share in 2024; API manufacturing is projected to grow at a 14.85% CAGR through 2030.
- By molecule type, small molecules held 66.73% of the pharmaceutical continuous manufacturing market share in 2024, while biologics are forecast to expand at a 13.92% CAGR through 2030.
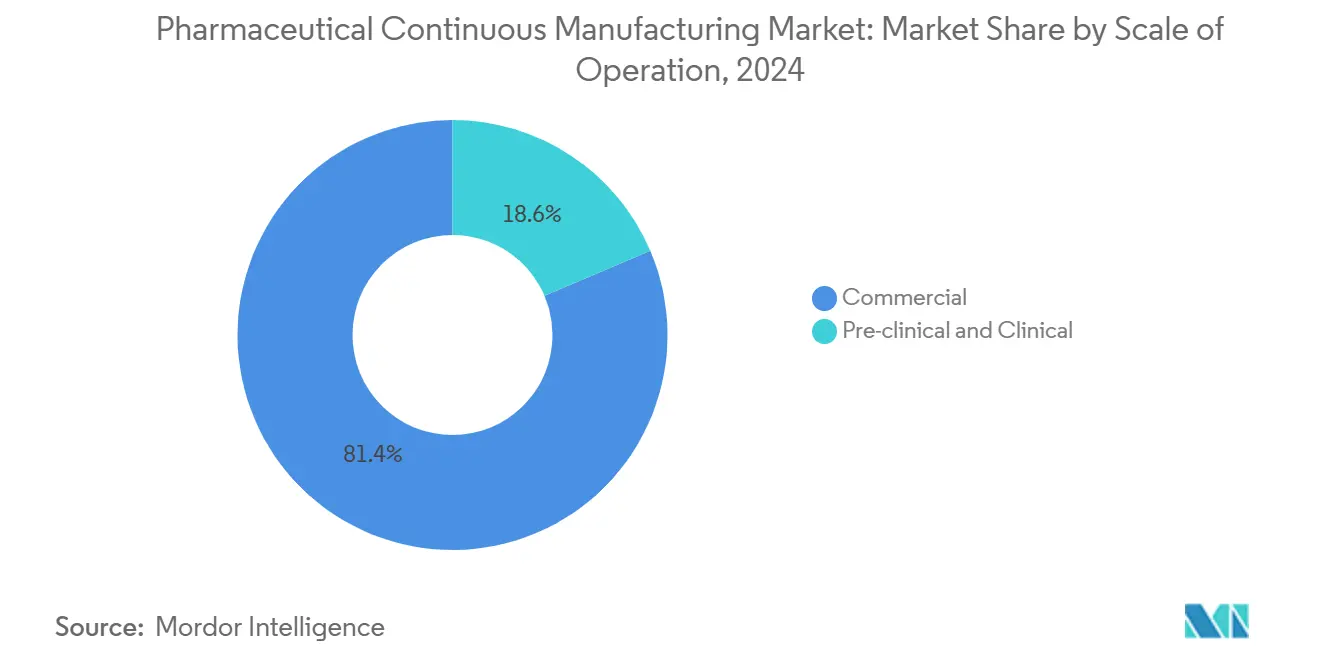
- By scale of operation, commercial manufacturing accounted for 81.45% share of the pharmaceutical continuous manufacturing market size in 2024, whereas pre-clinical & clinical services are advancing at 14.18% CAGR to 2030.
- By client type, big pharma commanded a 47.49% share in 2024; biotech companies are expected to represent the fastest growth at a 15.04% CAGR through 2030.
- By geography, North America captured a 43.15% share in 2024, and the Asia-Pacific region is expected to expand at a 15.27% CAGR through 2030.
Global Pharmaceutical Continuous Manufacturing Market Trends and Insights
Drivers Impact Analysis*
| Driver | (~) % Impact on CAGR Forecast | Geographic Relevance | Impact Timeline |
|---|---|---|---|
| Rising Demand For Biologics Outsourcing | +2.8% | Global, with concentration in North America & Europe | Medium term (2-4 years) |
| Cost-Containment Pressure On Pharma Innovators | +2.5% | Global, particularly acute in North America | Short term (≤ 2 years) |
| Capacity Constraints For High-Potency APIs | +2.1% | North America & Europe, emerging in Asia-Pacific | Medium term (2-4 years) |
| Regulatory Complexity Favouring Experienced CDMOs | +1.9% | Global, with highest impact in regulated markets | Long term (≥ 4 years) |
| Multi-Regional "China + 1" Reshoring Strategies | +1.2% | Asia-Pacific core, spill-over to North America & Europe | Medium term (2-4 years) |
| Industry 4.0 Technologies—Digital Twins, Real-Time Release, And Continuous Manufacturing | +0.8% | North America & Europe leading, Asia-Pacific following | Long term (≥ 4 years) |
| Source: Mordor Intelligence | |||
Rising Demand for Biologics Outsourcing
Biologics manufacturing is surging as sponsors steer clear of capital-heavy facilities by engaging CDMOs with proven large-scale cell-culture, viral-vector, and fill-finish expertise. The capacity for gene therapy, which is expanding at a rate of nearly 30% annually, remains concentrated in a handful of service providers. FUJIFILM Diosynth Biotechnologies’ 10-year, USD 3 billion supply pact with Regeneron underscores the shift to strategic partnerships anchored in volume guarantees and shared risk. The transition from autologous to allogeneic platforms expands access by enabling actual commercial-scale operations. At the same time, Lonza’s support of more than 70 viral-vector projects underscores the role of CDMOs as essential infrastructure for advanced therapies.[1]Lonza Group AG, “Lonza Supports Over 70 Viral Vector Projects,” lonza.com
Cost-Containment Pressure on Pharma Innovators
Heightened pricing scrutiny and generic erosion push innovators to externalize non-core production. CDMOs absorb capital expenditures (capex) and qualification risks, offering specialized containment or aseptic suites on a pay-as-you-go basis. For early-stage biotech companies, external manufacturing is the only viable route to the clinic, as illustrated by Viking Therapeutics’ USD 150 million obesity-drug deal with CordenPharma, which bundles API, formulation, and finished dose capacity. Emerging milestone-based contracts further align incentives by tying payments to regulatory success.
Capacity Constraints for High-Potency APIs
Oncology pipelines drive unprecedented volumes of antibody-drug conjugates and other HPAPIs that require stringent OEL bands. Building negative-pressure, multi-grade suites costs tens of millions, granting incumbents with validated containment lines notable pricing power. Catalent and PCI Pharma Services have invested aggressively, and CordenPharma’s EUR 900 million peptide expansion signals how capital intensity shields margins.
Regulatory Complexity Favoring Experienced CDMOs
Stringent quality-management-maturity (QMM) assessments and DSCSA serialization mandates elevate vendors with flawless inspection histories. Charles River Laboratories’ USD 292.5 million purchase of Vigene Biosciences shows premium valuations for assets boasting strong regulatory track records. Real-time analytics and digital batch records are quickly transitioning from differentiators to entry requirements.
Restraints Impact Analysis*
| Restraint | (~) % Impact on CAGR Forecast | Geographic Relevance | Impact Timeline |
|---|---|---|---|
| Supply-Chain And Quality-Failure Risk | -1.5% | Global, with acute impact in regulated markets | Short term (≤ 2 years) |
| Intensifying Regulatory Audits & Warning Letters | -0.9% | North America & Europe primarily | Medium term (2-4 years) |
| Big-Pharma Insourcing For Strategic mRNA Platforms | -0.7% | North America & Europe, limited Asia-Pacific impact | Medium term (2-4 years) |
| Skilled-Talent Shortage At Advanced-Modality CDMOs | -0.6% | Global, most acute in North America & Europe | Long term (≥ 4 years) |
| Source: Mordor Intelligence | |||
Supply-Chain and Quality-Failure Risk
COVID-19 disruptions exposed dependencies on single-site producers, prompting dual-sourcing mandates that can splinter volumes across multiple CDMOs. Sponsors now vet suppliers for redundancy plans and real-time quality monitoring to pre-empt recalls that erode brand equity. PCI Pharma Services’ pivot to dual-site fill-finish lines exemplifies the trade-off between cost efficiency and resilience[2]PCI Pharma Services, “PCI Expands Dual-Site Fill-Finish Strategy to Enhance Supply-Chain Resilience,” pci.com . Failures carry regulatory penalties, reputational fallout, and patient safety implications that quickly outweigh the cost savings.
Intensifying Regulatory Audits & Warning Letters
The FDA’s Quality Management Maturity program boosts inspection frequency and raises expectations for data integrity, cybersecurity, and proactive deviation management. Smaller CDMOs struggle with the resource burden of system upgrades and workforce training. Harmonization of EU, US, and emerging-market standards necessitates cross-regional compliance frameworks, which add complexity and lengthen validation timelines.
*Our forecasts treat driver/restraint impacts as directional, not additive. The impact forecasts reflect baseline growth, mix effects, and variable interactions.
Segment Analysis
By Service Type: Formulation Drives Market Value
Finished dosage formulation generated 52.35% of 2024 revenues, underlining the premium commanded for converting APIs into patient-ready forms that comply with worldwide filing standards. Oral solids still dominate volume, yet sterile injectables, inhalables, and ophthalmics secure higher margins due to aseptic controls. The pharmaceutical continuous manufacturing market benefits as sponsors push rapid, small-batch changeovers made possible by continuous granulation and inline PAT. API manufacturing, while smaller in current share, is expected to post a 14.85% CAGR, reflecting unmet demand for HPAPI, peptide, and oligonucleotide lines capable of sub-microgram containment. Packaging and serialization are bolstered by DSCSA and EU FMD mandates that compel end-to-end traceability investments; CDMOs bundling these services capture greater wallet share and reduce supply-chain complexity for sponsors.
Growth in formulation is propelled by biopharma’s focus on patient-centric dosage forms—high-concentration biologics in pre-filled syringes, nano-enabled oral suspensions, and 505(b)(2) reformulations that extend life cycles. CDMOs like Serán BioScience are commissioning spray-drying and hot-melt-extrusion lines to improve bioavailability of poorly soluble drugs. Integrated analytical and regulatory consulting now accompany most manufacturing SOWs, helping clients shorten IND-to-NDA timelines. The pharmaceutical continuous manufacturing market is leveraging continuous tablet presses and modular isolators to cut footprint, minimize operator exposure, and accelerate changeovers, positioning service providers as critical enablers of cost-efficient launches.


By Molecule Type: Biologics Command Premium Positioning
Small molecules retain a 66.73% share, advancing steadily on the back of oncology, CNS, and anti-infective pipelines. Mature process technologies, robust supply chains, and widening adoption of continuous flow reactors sustain competitiveness. Nevertheless, biologics represent the fastest-growing value pool, as monoclonal antibodies, recombinants, and vaccines rely on bioreactors, single-use systems, and high-throughput purification, which few sponsors wish to maintain in-house. The pharmaceutical continuous manufacturing market size for biologics is projected to reach USD 0.64 billion by 2030, expanding at a nearly 14% CAGR as commercial cell- and gene-based approvals multiply.
Capital inflow is evident in Charles River Laboratories’ expansion of its Memphis cell-therapy campus, which includes nine new suites, as well as AstraZeneca’s USD 300 million cell-therapy site in Rockville. CDMOs with integrative analytical, viral-vector, and GMP plasmid services enjoy premium pricing and multi-product lock-ins. Continuous downstream bioprocessing, perfusion culture, and inline viral inactivation are enhancing yields while reducing batch footprints, thereby reinforcing biologics as the primary value driver within the pharmaceutical continuous manufacturing market.
By Scale of Operation: Commercial Manufacturing Dominates Revenue
Commercial manufacturing delivered 81.45% of 2024 turnover, reflecting entrenched, high-volume contracts for mature therapies. Long-term, volume-committed agreements provide CDMOs with predictable revenue streams, enabling capacity expansions, such as Lotte Biologics’ USD 1 billion, 120,000-liter Songdo Bio Campus. In contrast, pre-clinical and clinical services grow at a 14.18% CAGR as the pipeline expands with first-in-human studies, accelerated approval pathways, and orphan drug designations. Continuous equipment is desirable in early-stage projects because it minimizes material use, shortens technology transfer cycles, and enables rapid scale-up.
Commercial suites are evolving toward fully continuous lines integrating granulation, tableting, coating, and PAT-driven release. Sponsors value CDMOs that offer seamless transition from GMP clinical batches to commercial volumes without revalidation. The pharmaceutical continuous manufacturing market benefits from portfolio rationalization, where legacy assets migrate to CDMOs so sponsors can reallocate capital to novel modalities.
By Client Type: Biotech Partnerships Drive Innovation
Big pharma absorbed 47.49% of 2024 demand, leveraging its purchasing power to secure high-capacity lines for blockbuster and lifecycle-extension programs. Yet biotech companies, advancing at 15.04% CAGR, are reshaping service models. They seek integrated, milestone-based packages covering process development, CMC filings, and launch supply. The pharmaceutical continuous manufacturing market is accommodated by offering modular suites that can be rapidly reconfigured for low-volume, high-value biologics or personalized therapies.
Risk-sharing is gaining traction: CDMOs defer portions of revenue until regulatory milestones are met, aligning interests and reducing biotech burn rates. Generic makers remain price-sensitive, driving lean Six-Sigma initiatives but contributing less to absolute growth. CDMOs that differentiate themselves on responsiveness, regulatory guidance, and digital transparency often win the loyalty of biotech companies, which can blossom into multi-product pipelines.
Geography Analysis
North America held a 43.15% share in 2024 and sustains leadership through a dense network of innovators, seasoned regulators, and capital-rich investors. Ongoing expansions—Pfizer’s Kalamazoo network and Eli Lilly’s four new plants—reinforce the region’s prominence. Serialisation requirements under the DSCSA prompt entrenched suppliers to deploy end-to-end track-and-trace systems, further raising entry barriers. Long-term pacts such as FUJIFILM Diosynth Biotechnologies’ USD 3 billion alliance with Regeneron signal confidence in North American expertise. The pharmaceutical continuous manufacturing market finds fertile ground here due to a reliable workforce and strong IP protection.
The Asia-Pacific is the fastest-growing territory, advancing at a 15.27% CAGR due to cost-competitive labor, maturing regulatory frameworks, and large domestic patient pools. WuXi AppTec, Samsung Biologics, and emerging Indian CDMOs have achieved global scale, luring Western sponsors with hybrid price-quality propositions. “China + 1” strategies inspired by geopolitical risk and the US Biosecure Act propel investments into India, South Korea, and Southeast Asia, broadening the pharmaceutical continuous manufacturing market footprint across the region. Lotte Biologics’ Songdo campus typifies the multi-billion-dollar commitments aimed at capturing surging biologics demand.[3]Lotte Biologics, “Lotte Breaks Ground on Songdo Bio Campus,” lottebiologics.com
Europe maintains a robust share, anchored by harmonized EMA guidelines, skilled talent, and strong biologics clusters in Germany, Ireland, and the Nordic countries. Investments like CordenPharma’s EUR 900 million peptide project and Rentschler’s UK cell-and-gene facility extend the continent’s capabilities. CDMOs exploit modular continuous-manufacturing lines to serve fragmented demand across 27 member states while upholding high GMP standards. Middle East & Africa and South America account for smaller portions today but see increasing local-content rules and pandemic-driven supply-security mandates that open doors for regional hubs. Collectively, regional diversification enlarges the pharmaceutical continuous manufacturing market and mitigates over-reliance on any single geography.

Competitive Landscape
The market remains moderately fragmented yet shows clear consolidation signals. Novo Holdings' USD 16.5 billion acquisition of Catalent elevates private capital's influence, while Charles River Laboratories' Vigene buy underscores appetite for advanced-modality capacity. Leaders differentiate on end-to-end offerings, digital maturity, and regulatory prowess. Adoption of continuous-flow reactors, autonomous material-handling robots, and AI-driven deviation prediction reduces cost of goods and shortens lead times, enabling vendors to secure premium contracts.
Strategic alliances proliferate: long-term supply frameworks, profit-sharing, and co-investment in dedicated suites cement client stickiness. Smaller specialists carve niches in HPAPI, lipid nanoparticle, or spray-drying segments, commanding outsized EBITDA margins despite limited scale.
Asia-Pacific giants aim to replicate Western one-stop models, intensifying competitive pressure yet also expanding the addressable client base. The pharmaceutical continuous manufacturing market rewards players balancing global reach with local responsiveness, underscored by Provident Healthcare Partners' observation that integrated CDMOs outpace peers on both utilization and new-project bookings.
Pharmaceutical Continuous Manufacturing Industry Leaders
Lonza Group
Catalent Inc.
Thermo Fisher Scientific (Patheon)
Samsung Biologics
WuXi AppTec
- *Disclaimer: Major Players sorted in no particular order

Recent Industry Developments
- June 2024: Aurobindo Pharma USA partnered with MSD to enhance biologics production via continuous platforms.
- May 2024: L.B. Bohle unveiled the modular QbCon line, enabling direct compression and both wet and dry granulation at 5–25 kg/h.
- May 2024: The FDA launched the START pilot program to speed rare-disease therapy development, benefiting continuous manufacturing workflows.


Global Pharmaceutical Continuous Manufacturing Market Report Scope
As per the scope of the report, continuous manufacturing refers to the manufacturing process of products without any interruption. It is the opposite of batch manufacturing. Continuous manufacturing is a method for manufacturing pharmaceutical products from end to end on a single, uninterrupted production line. The continuous manufacturing market is segmented by Product (Integrated Continuous Manufacturing and Semi Continuous Manufacturing), Application(API manufacturing, and End Product Manufacturing), End User (Contract Manufacturers, Pharmaceutical Companies and Other End Users), and Geography (North America, Europe, Asia-pacific, Middle East and Africa, and South America). The market report also covers the estimated market sizes and trends of 17 countries across major regions globally. The report offers values (in USD million) for the above segments.
| API Manufacturing | |
| Finished Dosage Formulation | Oral Solids |
| Parenterals | |
| Topicals & Others | |
| Packaging & Serialization | |
| Other Support Services |
| Small Molecules | |
| Large Molecules (Biologics) | mAbs |
| Cell & Gene Therapy | |
| Vaccines & Others |
| Pre-clinical & Clinical |
| Commercial |
| Big Pharma |
| Small & Mid-Sized Pharma |
| Biotech Companies |
| Generics Manufacturers |
| North America | United States |
| Canada | |
| Mexico | |
| Europe | Germany |
| United Kingdom | |
| France | |
| Italy | |
| Spain | |
| Rest of Europe | |
| Asia-Pacific | China |
| Japan | |
| India | |
| Australia | |
| South Korea | |
| Rest of Asia-Pacific | |
| Middle East & Africa | GCC |
| South Africa | |
| Rest of Middle East & Africa | |
| South America | Brazil |
| Argentina | |
| Rest of South America |
| By Service Type | API Manufacturing | |
| Finished Dosage Formulation | Oral Solids | |
| Parenterals | ||
| Topicals & Others | ||
| Packaging & Serialization | ||
| Other Support Services | ||
| By Molecule Type | Small Molecules | |
| Large Molecules (Biologics) | mAbs | |
| Cell & Gene Therapy | ||
| Vaccines & Others | ||
| By Scale of Operation | Pre-clinical & Clinical | |
| Commercial | ||
| By Client Type | Big Pharma | |
| Small & Mid-Sized Pharma | ||
| Biotech Companies | ||
| Generics Manufacturers | ||
| By Geography | North America | United States |
| Canada | ||
| Mexico | ||
| Europe | Germany | |
| United Kingdom | ||
| France | ||
| Italy | ||
| Spain | ||
| Rest of Europe | ||
| Asia-Pacific | China | |
| Japan | ||
| India | ||
| Australia | ||
| South Korea | ||
| Rest of Asia-Pacific | ||
| Middle East & Africa | GCC | |
| South Africa | ||
| Rest of Middle East & Africa | ||
| South America | Brazil | |
| Argentina | ||
| Rest of South America | ||


Key Questions Answered in the Report
What is the current Global Continuous Manufacturing Market size?
The market is valued at USD 0.73 billion in 2025 and is projected to reach USD 1.37 billion by 2030, growing at a 13.32% CAGR.
Who are the key players in Global Continuous Manufacturing Market?
Siemens, GEA Group AG, Glatt GmbH, Thermo Fisher Scientific and Scott Equipment are the major companies operating in the Global Continuous Manufacturing Market.
Which is the fastest growing region in Global Continuous Manufacturing Market?
Asia-Pacific leads with a 15.27% CAGR through 2030, driven by expanding biologics capacity and “China + 1” diversification.
Which service segment shows the highest growth potential?
API manufacturing is expected to expand at a 14.85% CAGR, reflecting unmet demand for high-potency and complex synthetics.
Page last updated on:


