
Biopharmaceuticals Contract Manufacturing Market Size and Share
Market Overview
| Study Period | 2022 - 2031 |
|---|---|
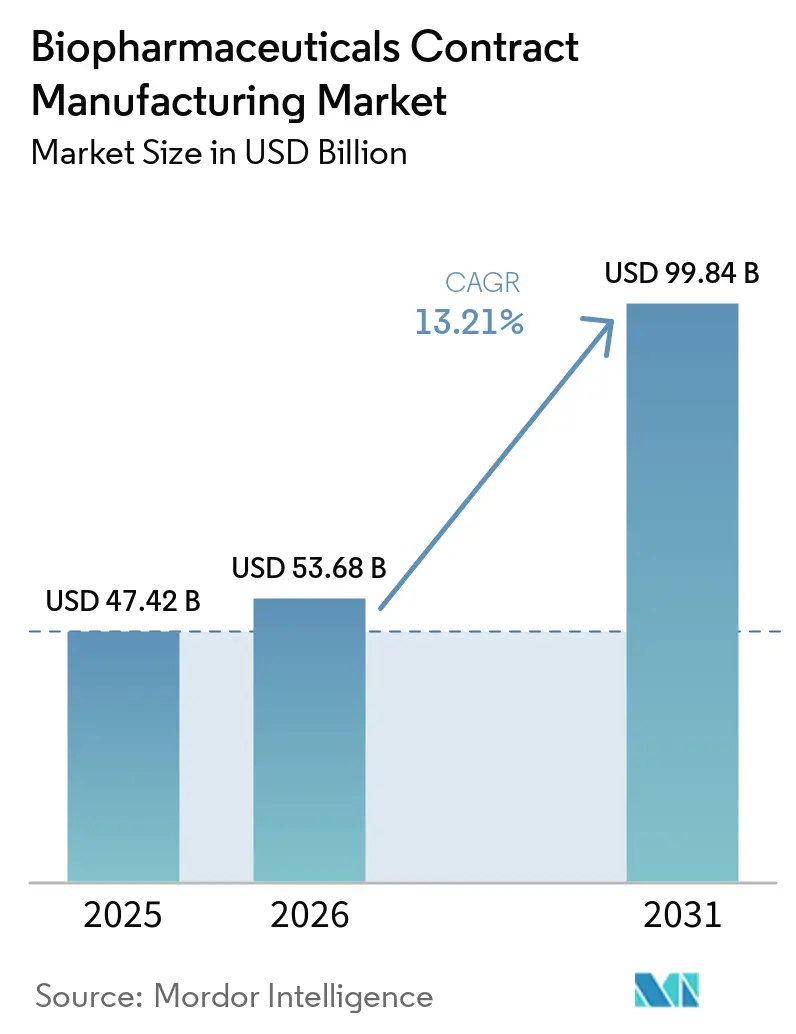
| Market Size (2026) | USD 53.68 Billion |
| Market Size (2031) | USD 99.84 Billion |
| Growth Rate (2026 - 2031) | 13.21 % |
| Fastest Growing Market | Asia-Pacific |
| Largest Market | North America |
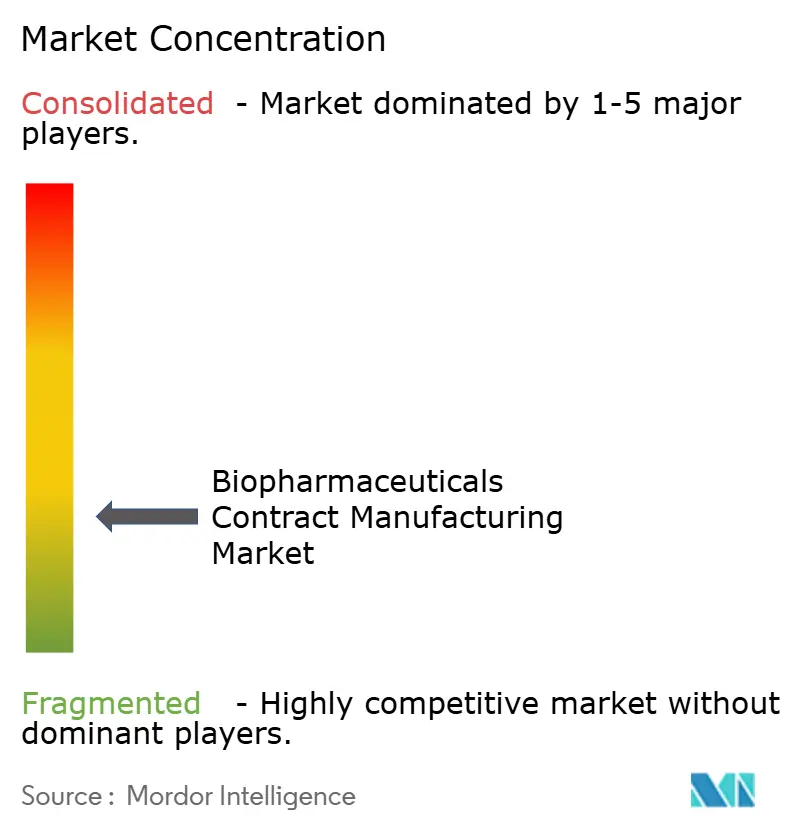
| Market Concentration | Low |
Major Players *Disclaimer: Major Players sorted in no particular order Image © Mordor Intelligence. Reuse requires attribution under CC BY 4.0. | |
Biopharmaceuticals Contract Manufacturing Market Analysis by Mordor Intelligence
Biopharmaceuticals contract manufacturing market size in 2026 is estimated at USD 53.68 billion, growing from 2025 value of USD 47.42 billion with 2031 projections showing USD 99.84 billion, growing at 13.21% CAGR over 2026-2031. This advancement outpaces the wider pharmaceutical sector because large sponsors are accelerating outsourcing to conserve capital and tap specialized expertise. Growth is amplified by the unrelenting expansion of biologic and biosimilar pipelines, rapid commercial uptake of single-use production systems, and widening capacity gaps for cell and gene therapy vectors. Geographic demand is broad-based, yet North America holds sway through its entrenched biotech clusters, while Asia Pacific posts the quickest gains as multinationals execute China-plus-one sourcing strategies. Technology investments in AI-driven predictive control, continuous bioprocessing, and modular facilities lift yields and compress timelines, sharpening the competitive edge of digital-first CDMOs.
Key Report Takeaways
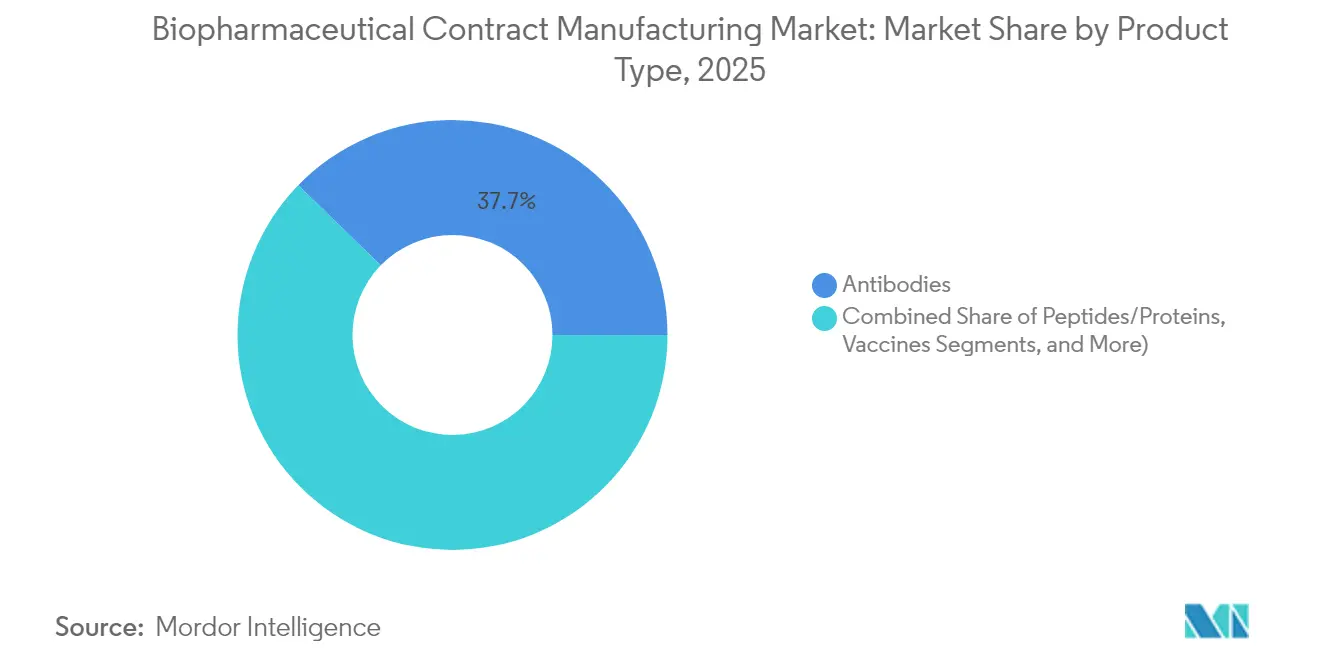
- By product type, antibodies led with 37.74% of biopharmaceuticals contract manufacturing market share in 2025, while cell and gene therapy vectors are forecast to expand at an 17.76% CAGR to 2031.
- By service type, cGMP drug substance manufacturing held 41.85% revenue share in 2025; process development services carry the highest projected CAGR at 16.45% through 2031.
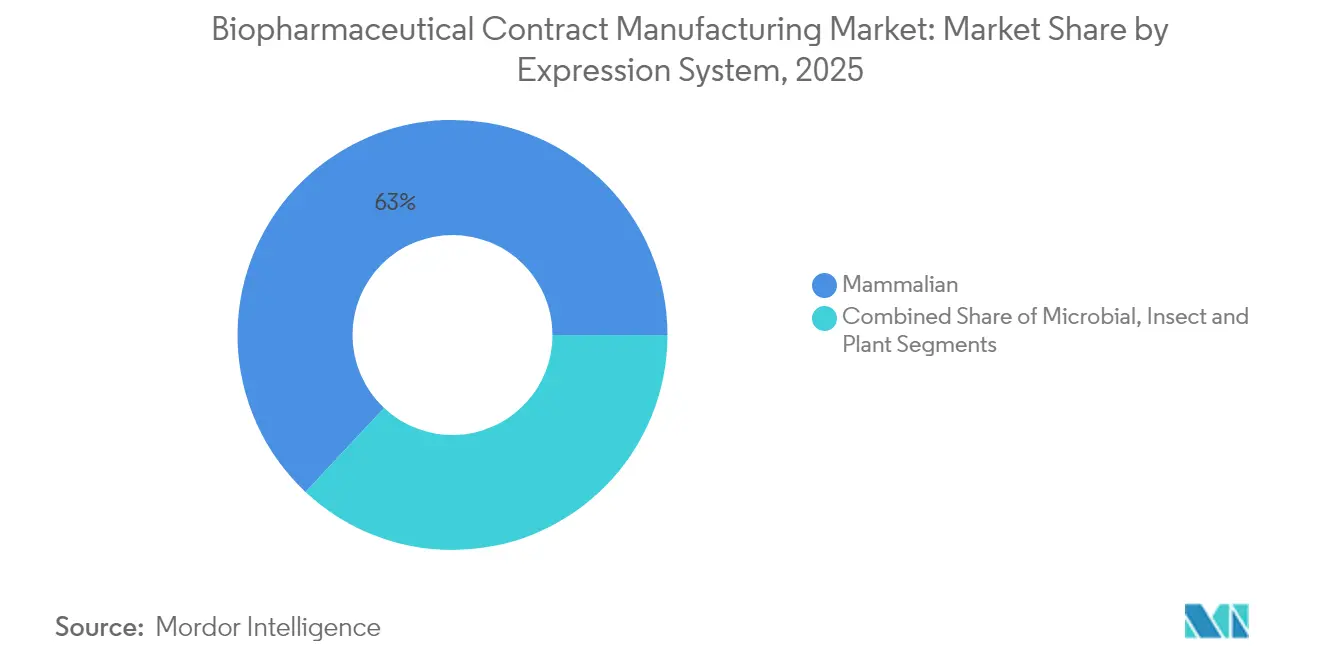
- By expression system, mammalian platforms accounted for 63.02% share of the biopharmaceuticals contract manufacturing market size in 2025 and are advancing at a 14.36% CAGR through 2031.
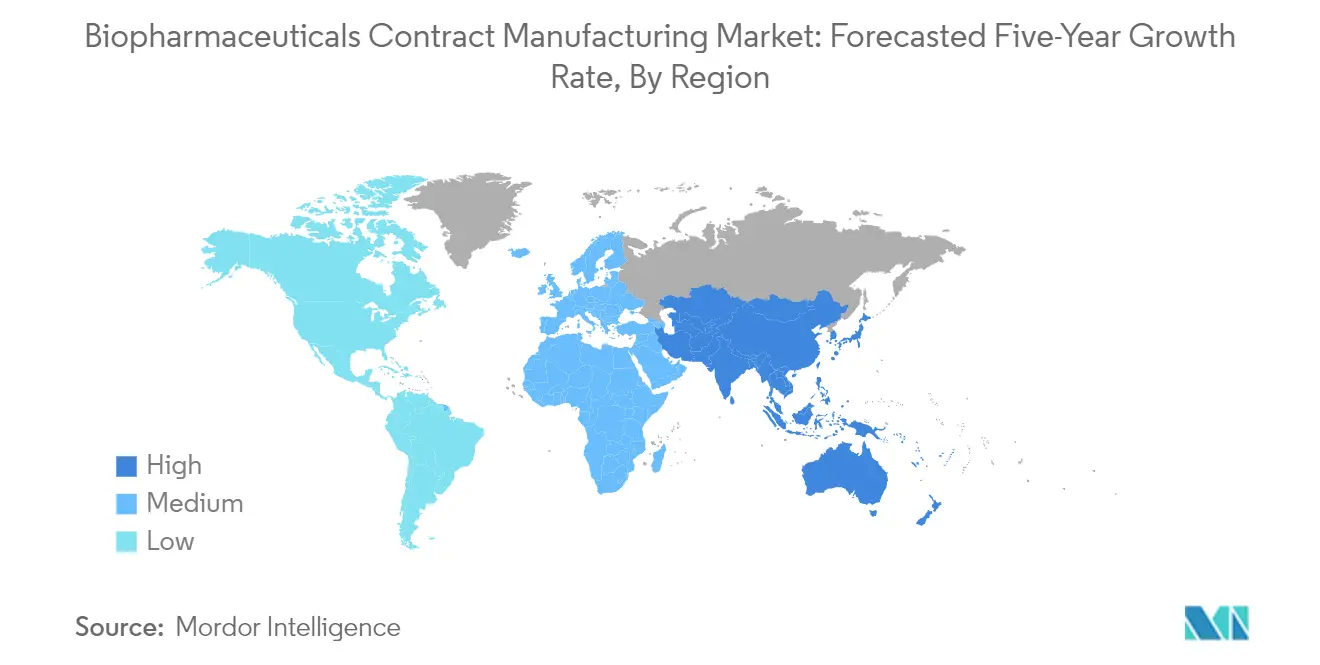
- By geography, North America captured 36.25% of the biopharmaceuticals contract manufacturing market in 2025, while Asia Pacific records the fastest regional CAGR at 11.18% through 2031.
Note: Market size and forecast figures in this report are generated using Mordor Intelligence’s proprietary estimation framework, updated with the latest available data and insights as of 2026.
Market Trends and Insights
Drivers Impact Analysis of Biopharmaceuticals Contract Manufacturing Market*
| Driver | (~) % Impact on CAGR Forecast | Geographic Relevance | Impact Timeline |
|---|---|---|---|
| Rapid expansion of biologics / biosimilar pipelines | +3.20% | Global with APAC acceleration | Long term (≥ 4 years) |
| Outsourcing surge among large bio-pharma sponsors | +2.80% | Global, particularly North America & Europe | Medium term (2–4 years) |
| Adoption of single-use & modular bioprocess skids | +2.10% | North America & EU; expanding to APAC | Short term (≤ 2 years) |
| Capacity gap for cell- & gene-therapy vectors | +1.90% | North America & EU core markets | Medium term (2–4 years) |
| China-plus-one procurement shift benefiting Korean/EU CDMOs | +1.40% | APAC core, spill-over to EU | Short term (≤ 2 years) |
| AI-driven predictive bioprocess control boosting yield | +1.20% | Global, early adoption in developed markets | Long term (≥ 4 years) |
| Source: Mordor Intelligence | |||
Outsourcing Surge Among Large Bio-Pharma Sponsors
The proportion of developers outsourcing at least one major activity rose to 86.9% in 2024 as firms sought flexibility and capital efficiency. Sponsors increasingly turn to CDMOs for complex modalities such as antibody-drug conjugates and autologous cell therapies that require niche expertise and rigorous regulatory stewardship. Outsourcing also shortens clinical timelines, with integrated providers offering process development, analytics, and commercial scale-up under a single quality system. Capacity reservations tied to multi-year master service agreements have become the norm, ensuring priority access as pipeline demand surges. Together, these forces embed the CDMO partnership model firmly within corporate manufacturing strategies, reinforcing the growth trajectory of the biopharmaceuticals contract manufacturing market.
Rapid Expansion of Biologics / Biosimilar Pipelines
More than 700 gene-based therapies and 450 biosimilar molecules are advancing through global development programs in 2025. Small and mid-sized innovators rarely possess industrial-scale capability, so they depend on external manufacturers that bring cell-culture know-how, global regulatory track records, and agility to pivot among regional filings. Harmonized guidelines across the United States, Europe, and key Asia Pacific jurisdictions further reward CDMOs with multinational site networks. As biologics complexity rises, differentiated purification, formulation, and delivery technologies become critical value drivers in biologics contract manufacturing, prompting deep collaboration and technology-transfer frameworks that embed CDMOs across the product life cycle.
Adoption of Single-Use & Modular Bioprocess Skids
Modern facilities outfitted with single-use bioreactors can lift overall volumetric capacity by 20% while trimming fixed costs by 40%, according to bioprocess benchmarking data.[1] Disposable flow-paths reduce cross-contamination risk, underpinning multiproduct suites that pivot quickly between campaigns. Off-the-shelf modular skids such as the FlexFactory platform arrive pre-validated, compressing green field build times by 70% and cutting carbon footprints by 55% compared with stainless-steel plants. These efficiencies resonate strongly with biosimilar developers focused on price competitiveness and with emerging-market sponsors facing stringent capital allocation hurdles.
Capacity Gap for Cell- & Gene-Therapy Vectors
Industry analyses peg vector manufacturing shortfalls at 500%, pushing lead times for qualified CMO slots to 18 months. Heavy investment is underway; examples include Fujifilm Diosynth’s USD 120 million Advanced Center for Gene Therapies in Texas, but demand still outruns supply. This scarcity incentivizes novel solutions such as allogeneic platforms aimed at scalable off-the-shelf therapies. In tandem, continuous perfusion processes are gaining traction to stretch bioreactor output. Developers now view strategic CDMO alliances as essential for locking in capacity and de-risking commercialization plans, cementing long-term revenue visibility for service providers across the biopharmaceuticals contract manufacturing market.
Restraints Impact Analysis of Biopharmaceuticals Contract Manufacturing Market*
| Restraint | (~) % Impact on CAGR Forecast | Geographic Relevance | Impact Timeline |
|---|---|---|---|
| Stringent cGMP & data-integrity compliance burden | –1.8% | Global, particularly stringent in EU & US | Long term (≥ 4 years) |
| Global shortage of skilled bioprocess engineers | –1.5% | Global, acute in developed markets | Medium term (2–4 years) |
| Sustainability pressure on single-use plastics | –0.9% | EU leading, expanding globally | Long term (≥ 4 years) |
| Over-building risk creating idle stainless & SU capacity | –0.7% | Global, concentrated in high-investment regions | Short term (≤ 2 years) |
| Source: Mordor Intelligence | |||
Stringent cGMP & Data-Integrity Compliance Burden
Implementation of EU GMP Annex 1 heightens sterile-manufacturing requirements, compelling extensive contamination-control and quality monitoring upgrades. FDA warning letters in 2024 spotlighted governance lapses and software validation gaps, reinforcing regulators’ focus on ALCOA+ data principles. Smaller CDMOs face disproportionate financial pressure when deploying electronic batch-record systems, track-and-trace platforms, and advanced environmental monitoring. The compliance load can delay facility utilization, tempering short-term revenue growth even as it lifts long-term quality standards across the biopharmaceuticals contract manufacturing industry.
Global Shortage of Skilled Bioprocess Engineers
Cytiva’s 2025 industry index shows that only 20% of executives find talent acquisition straightforward for upstream and downstream roles. Digitalization intensifies the gap: 80% of manufacturers report mismatches between existing skills and biopharma 4.0 requirements. Singapore projects a 30% jump in executive-level vacancies by 2032, mirroring broader global trends. CDMOs counter with accelerated academies, apprenticeships, and partnerships with universities. Yet, near-term workforce scarcity constrains ramp-ups, nudging some sponsors to continue dual-sourcing or invest in captive capacity as a hedge.
*Our forecasts treat driver/restraint impacts as directional, not additive. The impact forecasts reflect baseline growth, mix effects, and variable interactions.
Biopharmaceuticals Contract Manufacturing Market Segment Analysis
By Product Type:
Antibodies Lead While Cell & Gene Therapies SurgeThe antibodies segment generated 37.74% market share in 2025, cementing its role as the anchor modality for oncology and autoimmune indications. Continued clinical activity sustains high batch volumes, while process intensification lifts titers and economics. In parallel, biosimilar monoclonal antibodies stimulate incremental demand from cost-sensitive health systems in Latin America, Eastern Europe, and parts of Asia.
Cell and gene therapy vectors are expanding at an 17.76% CAGR due to the scarcity of GMP vector capacity, bespoke analytics, and stringent regulatory oversight, which combine to create high-margin opportunities for specialized CDMOs. Viral vector innovation, including next-generation AAV serotypes and non-viral delivery alternatives, deepens the service scope and accelerates convergence between development and manufacturing skill sets in the biopharmaceuticals contract manufacturing market.

By Service Type:
Manufacturing Dominance with Development AccelerationMammalian expression platforms, chiefly CHO cells, held 63.02% of market share in 2025 as advances in cell-line engineering, vector design, and media optimization boost specific productivity, reinforcing this platform’s dominance for glycosylated proteins and complex mAbs.
Bacterial and yeast systems remain cost-efficient for simple recombinant proteins and enzymes, especially in emerging economies where pricing pressure is acute. Plant and insect cell technologies show promise for niche applications, yet regulatory familiarity limits broader adoption. Providers balance portfolios across systems to meet client needs while maximizing facility utilization, an increasingly important lever as single-use suites enable flexible switching between platforms.
By Expression System:
Mammalian Systems Maintain Technology LeadershipMammalian expression platforms, chiefly CHO cells, held 63.02% of market share in 2025 as advances in cell-line engineering, vector design, and media optimization boost specific productivity, reinforcing this platform’s dominance for glycosylated proteins and complex mAbs.
Bacterial and yeast systems remain cost-efficient for simple recombinant proteins and enzymes, especially in emerging economies where pricing pressure is acute. Plant and insect cell technologies show promise for niche applications, yet regulatory familiarity limits broader adoption. Providers balance portfolios across systems to meet client needs while maximizing facility utilization, an increasingly important lever as single-use suites enable flexible switching between platforms.
By Development Phase:
Commercial Manufacturing Drives GrowthCommercial and Phase III projects represent the revenue backbone, providing predictable multi-year volume commitments that justify large-scale stainless or disposable bioreactor installations. Long-term supply agreements often incorporate technology-progress clauses to embed continuous improvement initiatives, safeguarding cost and quality competitiveness.
Pre-clinical and Phase I projects, however, fuel the future pipeline, with venture-backed startups outsourcing nearly all CMC activities to conserve cash. Rapid-turn proof-of-concept runs in 50–200 L single-use bioreactors bridge the data gap from discovery to IND filings. Phase II demand hinges on fast scale-up and validated analytical suites, emphasizing those CDMOs that offer end-to-end lifecycle management within one quality and digital infrastructure.
Geography Analysis
North America Biopharmaceuticals Contract Manufacturing Market
North America remained the largest regional contributor with a 36.25% biopharmaceuticals contract manufacturing market share in 2025, sustained by deep venture funding, advanced regulatory ecosystems, and dense talent pools in Boston-Cambridge and the San Francisco Bay Area. Capacity expansions such as Fujifilm Diosynth’s USD 3.2 billion North Carolina campus and WuXi Biologics’ Massachusetts site broaden service breadth and keep the region at the forefront of late-stage and commercial projects. Potential enactment of the BIOSECURE Act could reshape vendor selection by favoring domestic and allied suppliers, yet strong demand and diversified pipelines maintain robust outlooks across modalities.
APAC Biopharmaceuticals Contract Manufacturing Market
Asia Pacific is the fastest-growing territory, advancing at an 11.18% CAGR to 2031. China’s regulatory reforms and infrastructure build-out elevate its status as a manufacturing option for early-stage runs, although geopolitical tensions influence dual-sourcing habits. South Korea’s Samsung Biologics commands global attention with a cumulative capacity of 784,000 L by 2025, underscoring the region’s ascent. India leverages cost advantages and English-language talent, while Singapore markets its stringent quality oversight and government incentives to capture advanced-therapy projects.
Europe Biopharmaceuticals Contract Manufacturing Market
Europe sustains its position through incumbents such as Lonza, Boehringer Ingelheim, and Catalent, each reinforcing local ecosystems with billion-dollar investments in Switzerland, Germany, and Austria. The Vacaville acquisition adds 330,000 L of capacity to Lonza’s network, highlighting continued commitment despite Brexit-related supply chain complexity. EMA’s harmonized review pathways and robust IP protections entice U.S. and Asian clients seeking regulatory diversification. Collectively, mature infrastructure, automation initiatives, and green-manufacturing incentives place Europe firmly in the strategic plans of multinational sponsors evaluating the biopharmaceuticals contract manufacturing market.
Regulatory Landscape
Global biopharmaceutical contract manufacturing operates under stringent cGMP regimes led by the US FDA, the European Medicines Agency (EMA) and EU/EEA national inspectorates, and Chinas National Medical Products Administration (NMPA), with increasing emphasis on data integrity and demonstrable quality-system effectiveness across outsourced networks. In the EU, the Product Lifecycle Management (PLCM) guidance and related variations expectations became applicable in January 2026, reinforcing the need for a robust Pharmaceutical Quality System (PQS) to support post-approval CMC change management. EMA also advanced a 2026-2027 PQS effectiveness pilot that evaluates quality maturity during inspections.
Regulators also moved toward frameworks that accommodate newer operating models, while increasing oversight of contract manufacturing. In the United States, the FDA opened a July 2026 proposed rulemaking to create a registration and listing pathway tailored for distributed (hub-and-spoke) manufacturing networks, and FDA PreCheck Pilot Program pre-operational engagements for the initial cohort began July 1, 2026. In China, NMPA implementation actions in April 2026 tied to Announcement No. 134 (2025) increased provincial-level scrutiny of Class C contract manufacturing licenses, raising the compliance bar for sponsor oversight, quality agreements, and assignment of responsibilities between marketing authorization holders and CDMOs.
Value Chain Analysis
The biopharmaceutical contract manufacturing value chain begins with sponsors (biotech and large biopharma) defining CMC strategy and transferring process and analytical packages to CDMOs for process development, tech transfer, and cGMP manufacture of drug substance (commonly mammalian cell culture) and drug product (sterile fill-finish, lyophilization). It then moves through release testing, QA/QP activities where applicable, and packaging and cold-chain logistics. Critical upstream and enabling inputs include cell lines and plasmids, single-use assemblies and bioreactors, chromatography resins and filters, media and buffers, and validated digital quality systems (eBR, LIMS), with third-party testing and specialized raw-material suppliers acting as important nodes.
Operational bottlenecks and risk concentrations continue to cluster around high-quality sterile fill-finish capacity, single-use supply availability, and specialized talent, which affect lead times and campaign scheduling for CDMOs. Supply-chain resilience and geopolitical considerations are also shaping network choices and regionalization, alongside heightened scrutiny of cross-border dependencies. For example, Samsung Biologics completed the acquisition of a GSK manufacturing facility in Rockville, Maryland in March 2026 to establish its first US footprint, while WuXi Biologics secured FDA pre-license inspection approval in July 2026 for its MFG8 drug substance facility in Hebei, China, supporting commercial supply using a single-use bioreactor configuration.
Competitive Landscape
The market is moderately concentrated and in the midst of consolidation. Novo Holdings’ USD 16.5 billion takeover of Catalent stands as the largest CDMO transaction to date, marrying upstream biologics expertise with expansive fill-finish capabilities.
Leading players are recasting themselves as innovative partners rather than commodity manufacturers. Samsung Biologics’ S-Cellerate program integrates cell-line development, process optimization, and regulatory documentation to compress timelines. Lonza’s One Lonza framework unites biologics, advanced synthesis, and cell-and-gene platforms under uniform digital and quality systems. Technology investments in AI-enabled digital twins, continuous perfusion lines, and end-to-end electronic batch history improve productivity and reduce deviation rates, sharpening competitive differentiation across the biopharmaceuticals manufacturing market.
White-space opportunities cluster around antibody-drug conjugates and advanced viral vectors, both capital-intensive niches with steep learning curves. Disruptive entrants such as PAK BioSolutions target continuous bioprocessing with USD 12 million in seed funding, promising reductions in footprint and operating costs. Meanwhile, regional specialists leverage proximity advantages and tailored service offerings, for example, SK pharmteco’s peptide expansion in South Korea or Ardena’s move into U.S. drug-product manufacturing to carve defensible positions.
Biopharmaceuticals Contract Manufacturing Industry Leaders
-
Boehringer Ingelheim GmbH
-
Lonza Group
-
Samsung Biologics
-
WuXi Biologics
-
Thermo Fisher Scientific Inc.
- *Disclaimer: Major Players sorted in no particular order
Biopharmaceuticals Contract Manufacturing Market Companies Covered in this Report
- Samsung Group
- Lonza Group
- Wuxi Biologics
- Thermo Fisher Scientific (Patheon)
- Catalent Pharma Solutions
- Boehringer Ingelheim BioXcellence
- FUJIFILM
- AGC Biologics
- Siegfried Holding
- Recipharm
- ProBioGen
- AbbVie Contract Manufacturing
- Novartis (Lek)
- INCOG BioPharma Services
- Lotte Biologics
- Thermex (Merck Life Science)
- Emergent Bio Solutions
Market Opportunities and Future Outlook
Capacity, capability, and geography remain the main whitespace levers for CDMOs as sponsors deepen outsourcing for complex biologics, advanced therapies, and multi-region filings. In the United States, multiple large, named investments in 2026 underline continued demand for biologics and cell therapy manufacturing ecosystems, and they also create opportunities for CDMOs that can integrate process development, analytics, and commercial supply under one quality system. Genentech increased investment in its Holly Springs, North Carolina campus to about USD 2 billion (January 2026), Johnson and Johnson announced more than USD 1 billion for a next-generation cell therapy manufacturing facility in Montgomery County, Pennsylvania (February 2026), UCB selected Gwinnett County, Georgia for a new 460,000 sq. ft. biologics manufacturing facility (March 2026), and AbbVie selected Durham, North Carolina for a USD 1.4 billion manufacturing campus (April 2026). These steps increase the need for external partners that can deliver surge capacity, specialized modalities, and flexible fill-finish to support launches and lifecycle expansions.
Modality specialization and regulatory modernization are also opening clearer differentiation lanes. High-complexity segments such as antibody-drug conjugates are drawing targeted capacity actions, including Lonzas July 2026 plan to expand ADC manufacturing capabilities at Visp, Switzerland. Meanwhile, distributed and networked production models are gaining clearer regulatory pathways through the FDAs July 2026 proposal for a new registration and listing approach for distributed manufacturing. CDMOs that combine modular or single-use platforms with mature PQS and digital traceability can support faster tech transfer and post-approval change execution across multi-site networks, which aligns with EU PLCM expectations and broader regulator emphasis on demonstrable quality-system effectiveness.
Recent Industry Developments in Biopharmaceuticals Contract Manufacturing Market
- July 2026: WuXi Biologics announced that its MFG8 drug substance facility in Hebei, China, secured FDA pre-license inspection approval to advance commercial supply of a potential autoimmune therapy. The clearance supports late-stage and commercial readiness for single-use-based drug substance capacity, strengthening WuXi Biologics position in global biologics outsourcing despite tighter quality and geopolitical scrutiny.
- December 2025: Thermo Fisher Scientific expanded its bioprocessing capabilities network with new or upgraded Bioprocess Design Centers in Hyderabad (India), Incheon (Korea), and Singapore. The footprint expansion increases upstream and downstream process development support for clients in Asia and helps accelerate tech transfer into cGMP manufacturing programs across the region.
- December 2024: Novo Holdings completed its USD 16.5 billion acquisition of Catalent. The transaction reshaped the competitive landscape by combining scaled fill-finish and broader manufacturing services under new ownership, influencing outsourcing partner selection and capacity allocation for biologics and other complex modalities.
Biopharmaceuticals Contract Manufacturing Market Report Scope and Research Methodology
Market Definition and Coverage
This market covers the revenue earned by contract development and manufacturing partners for making biopharmaceutical drug substance and drug product for clinical and commercial supply, including related manufacturing support services that are billed to customers.
Scope exclusions: This sizing excludes small-molecule API manufacturing, stand-alone preclinical CRO work, and pure distribution and logistics services.
Segments Covered in This Report
- By Product Type
- Peptides/Proteins
- Antibodies (mAbs & ADCs)
- Vaccines
- Biosimilars
- Other Biologics
- By Service Type
- Process Development
- cGMP Drug Substance Manufacturing
- Fill-Finish & Lyophilization
- Analytical & QC Services
- Packaging & Logistics
- By Expression System
- Mammalian
- Microbial
- Insect & Plant
- By Development Phase
- Pre-clinical
- Phase I
- Phase II
- Phase III & Commercial
- By Geography
- North America
- United States
- Canada
- Mexico
- Europe
- Germany
- United Kingdom
- France
- Italy
- Spain
- Rest of Europe
- Asia Pacific
- China
- Japan
- India
- South Korea
- Australia
- Rest of Asia Pacific
- Middle East and Africa
- GCC
- South Africa
- Rest of Middle East and Africa
- South America
- Brazil
- Argentina
- Rest of South America
- North America
Data Sources, Market Sizing, and Validation
Desk Research
Desk research is used to build the initial fact base for demand, supply, and pricing logic in biopharmaceutical outsourcing. We typically refer to public sources such as FDA and EMA databases on biologics approvals, CDER and CBER publications, clinical trial registries, and CDC and WHO immunization and vaccine updates, where they help explain volume direction and modality mix.
To translate industry signals into sizing inputs, we also review company filings, investor decks, annual reports, and reputable press for capacity expansions, facility utilization commentary, and service mix changes across drug substance and fill finish. Where needed, we supplement this with paid subscriptions that compile company financials and intelligence, patent databases, and shipment-level import and export records for cold chain relevant materials and key intermediates. These examples are not exhaustive, and additional public sources were also used during data collection, validation, and clarification.
Primary Interviews and Surveys
Primary interviews and surveys are used to pressure test the desk assumptions and fill gaps on pricing, capacity tightness, and outsourcing behavior by modality. We speak with manufacturing leaders, quality and operations managers, process development teams, and procurement stakeholders across APAC, EMEA, and the Americas, so regional capacity additions and client demand patterns are reflected consistently.
Distribution of primary research fieldwork respondents
| Company type | Respondent position | Region |
|---|---|---|
| Top tier: 31% | CXOs: 12% | APAC: 43% |
| Mid tier: 49% | Functional/Unit leaders: 41% | EMEA: 36% |
| Smaller Players: 20% | Managers: 47% | Americas: 21% |
Market-Sizing & Forecasting
Market sizing is built using top-down and bottom-up, with the main totals reconstructed from the addressable outsourced manufacturing spend tied to biologics output and outsourcing penetration by modality. Since public volume is not always reported in a single unit, the model is anchored on a few practical signals, and the main clause comes last, which is that revenue is counted only when manufacturing and related billed services are delivered by a contracted partner.
Key inputs include biologics approvals and pipeline flow by major modality, the split between clinical and commercial manufacturing activity, capacity expansion timelines for mammalian and microbial facilities, typical utilization ranges discussed by operators, and average pricing direction for drug substance and fill finish work. We also track cell and gene therapy vector demand indicators and vaccine seasonality signals, because they can shift near-term capacity allocation and pricing. Where bottom-up detail is available, sampled checks are done using a limited roll-up of supplier revenue disclosures, public contract announcements, and a volume times ASP approximation for representative services, and then adjusted for white spaces where companies do not break out biologics-only outsourcing revenue.
For forecasting, scenario analysis is used so base, conservative, and faster adoption paths can be tested against expert views on outsourcing rates, capacity commissioning risk, and expected pricing normalization. Final year-by-year values are produced after the scenario set is reconciled with observed approval trends and with capacity additions expected to come online.
Data Validation & Update Cycle
Validation is done through multiple checks that look for gaps between the model outputs and independent market signals, such as announced capacity additions, utilization commentary, and near-term biologics launch cadence. When a variance is seen, assumptions are revisited, follow-up calls are triggered, and the sizing is recalculated before internal sign-off.
Each report is refreshed annually, and interim updates are made when material events occur, such as major facility commissioning delays, large capacity expansions, or regulation-led manufacturing shifts. Before delivery, we do a fresh review pass so the numbers reflect the latest available public data and the most recent primary feedback.
Mordor Intelligence's Biopharmaceuticals Contract Manufacturing Market Size Measured Against Other Published Estimates
Published market values for biopharmaceutical contract manufacturing can look far apart even when they talk about similar outsourcing themes, because firms do not always count the same services or timing. Differences usually come from what is included in manufacturing revenue, the base year used, and how quickly pricing and outsourcing penetration are assumed to move.
In our checks, the largest gap drivers are whether process development, analytical testing, and integrated packaging are counted along with cGMP manufacturing, and whether adjacent research-only services are folded into the same total. Currency conversion timing and the refresh cadence also matter, because capacity announcements and biologics launches can quickly shift the next year estimate. This spread is easiest to see when the scope is kept to contracted manufacturing and billed support services, which is the approach applied by Mordor Intelligence.
Benchmark comparison
| Source | Market Size | Gaps in Research Methodology |
|---|---|---|
| Mordor Intelligence | USD 53.68 B (2026) | |
| Global Consultancy A | USD 40.10 B (2024) | Uses an earlier base year and frames the market around contract manufacturing, with inclusions and exclusions not always stated clearly in public highlights, which can leave out billed add-on services like integrated packaging or testing in some reads. |
| Industry Publisher B | USD 40.99 B (2024) | Starts from a 2024 base and provides broad segmentation, but public extracts do not clarify whether process development, analytical testing, and packaging are consistently included in the revenue total, which can shift the market size versus a manufacturing-plus-billed-services scope. |
Looking across the table, most of the difference is explained by year alignment and service scope, not by a disagreement that outsourcing is rising. When the model is tied to clear, billed service lines and then cross-checked against capacity and launch signals, the resulting totals are easier to trace and to update as new facility and demand information comes in.
Key Questions Answered in the Report
How big is the Biopharmaceuticals Contract Manufacturing Market?
The Biopharmaceuticals Contract Manufacturing Market size is expected to reach USD 53.68 billion in 2026 and grow at a CAGR of 13.21% to reach USD 99.84 billion by 2031.
What is the current Biopharmaceuticals Contract Manufacturing Market size?
In 2026, the Biopharmaceuticals Contract Manufacturing Market size is expected to reach USD 53.68 billion.
Who are the key players in Biopharmaceuticals Contract Manufacturing Market?
Boehringer Ingelheim GmbH, JRS Pharma (Celonic), Lonza Group, Rentschler Biotechnologie GmbH and Inno Biologics Sdn Bhd are the major companies operating in the Biopharmaceuticals Contract Manufacturing Market.
Which is the fastest growing region in Biopharmaceuticals Contract Manufacturing Market?
Asia-Pacific is estimated to grow at the highest CAGR over the forecast period (2026-2031).
Which region has the biggest share in Biopharmaceuticals Contract Manufacturing Market?
In 2025, the North America accounts for the largest market share in Biopharmaceuticals Contract Manufacturing Market.
What years does this Biopharmaceuticals Contract Manufacturing Market cover, and what was the market size in 2025?
In 2025, the Biopharmaceuticals Contract Manufacturing Market size was estimated at USD 53.68 billion. The report covers the Biopharmaceuticals Contract Manufacturing Market historical market size for years: 2021, 2022, 2023 and 2024. The report also forecasts the Biopharmaceuticals Contract Manufacturing Market size for years: 2026, 2027, 2028, 2029, 2030 and 2031.