Market Overview
| Study Period | 2019 - 2031 |
|---|---|
| Forecast Data Period | 2026 - 2031 |
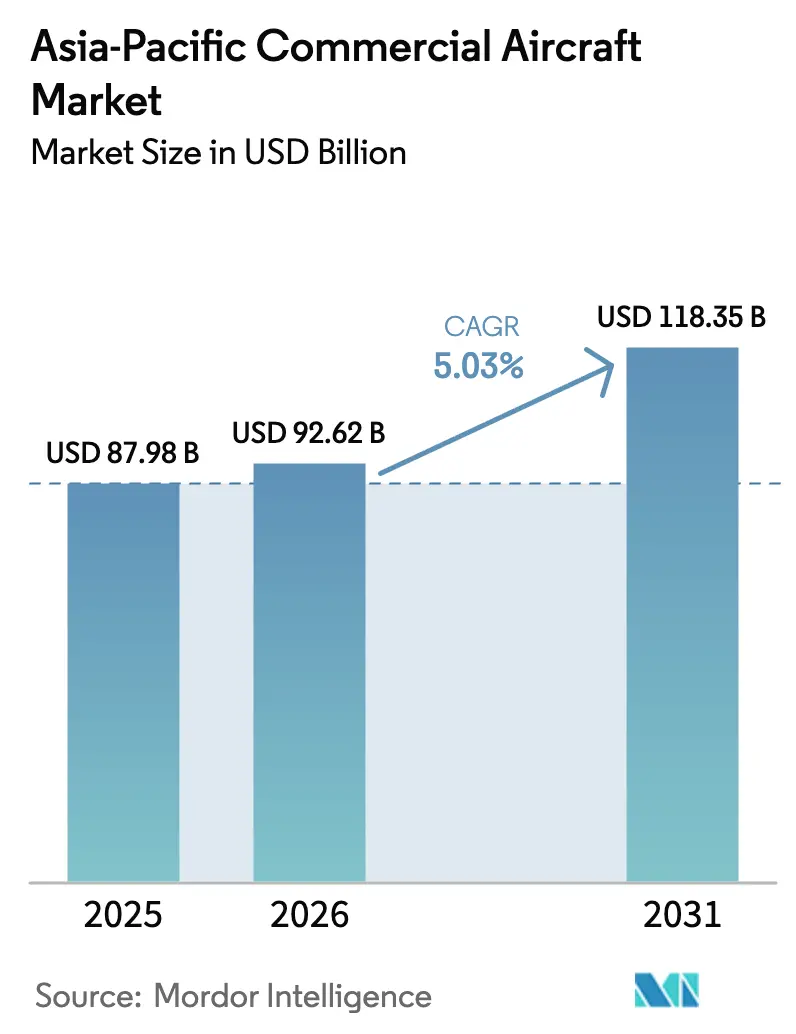
| Base Year Market Size (2025) | USD 87.98 Billion |
| Market Size (2026) | USD 92.62 Billion |
| Market Size (2031) | USD 118.35 Billion |
| Growth Rate (2026 - 2031) | 5.03% CAGR |
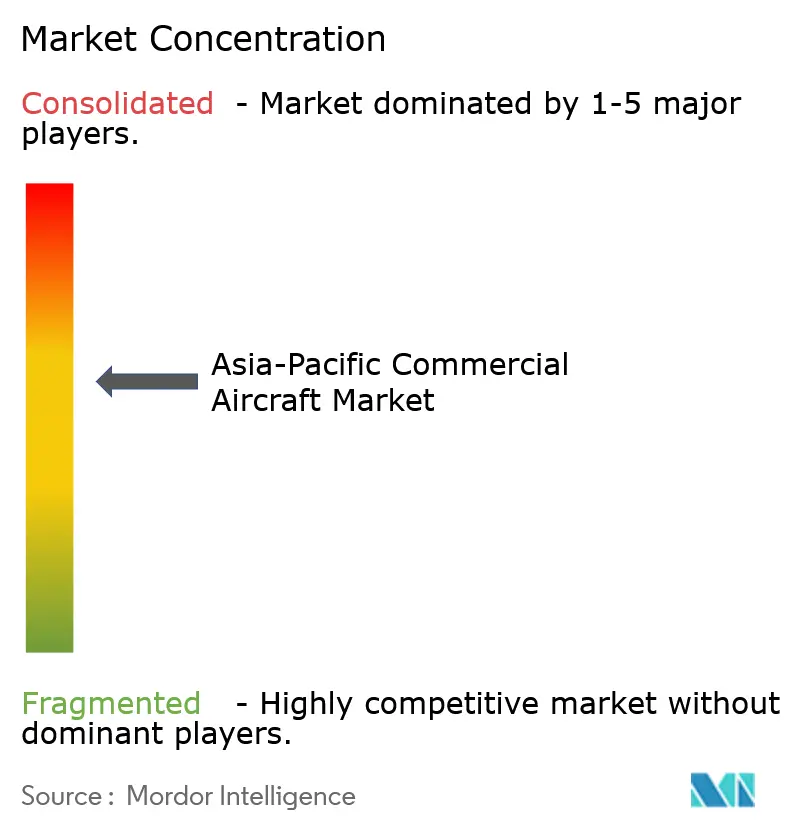
| Market Concentration | Medium |
Major Players *Disclaimer: Major Players sorted in no particular order Image © Mordor Intelligence. Reuse requires attribution under CC BY 4.0. | |
Asia-Pacific Commercial Aircraft Market Analysis by Mordor Intelligence
The Asia-Pacific commercial aircraft market size is expected to grow from USD 87.98 billion in 2025 to USD 92.62 billion in 2026 and is forecasted to reach USD 118.35 billion by 2031 at a 5.03% CAGR over 2026-2031. Fleet growth is being propelled by low-cost carriers (LCCs) capturing an outsized share of narrowbody deliveries, domestic Asian original-equipment manufacturers winning early export traction, and airport infrastructure programs connecting secondary cities. Rising e-commerce volumes are accelerating demand for freighter conversions, while software-defined avionics and predictive maintenance solutions are shifting component value toward digital systems. Regional jet and turboprop orders are increasing because they profitably serve thinner routes that were previously uneconomical, and sustainable aviation fuel mandates are beginning to influence aircraft selection and operating economics.
Key Report Takeaways
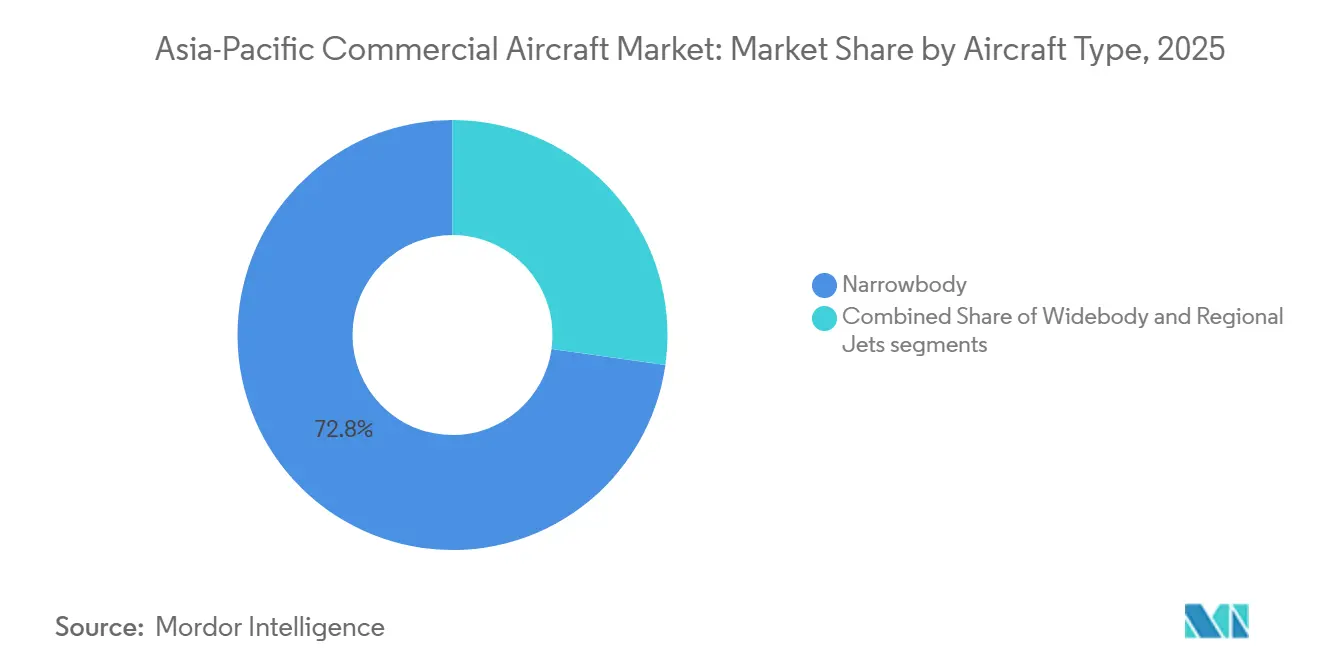
- By aircraft type, narrowbody models controlled 72.78% of the Asia-Pacific commercial aircraft market share in 2025, while regional jets are projected to record a 7.37% CAGR through 2031.
- By application, passenger variants accounted for 94.89% of the Asia-Pacific commercial aircraft market size in 2025, and freighter configurations are expected to advance at an 8.81% CAGR through 2031.
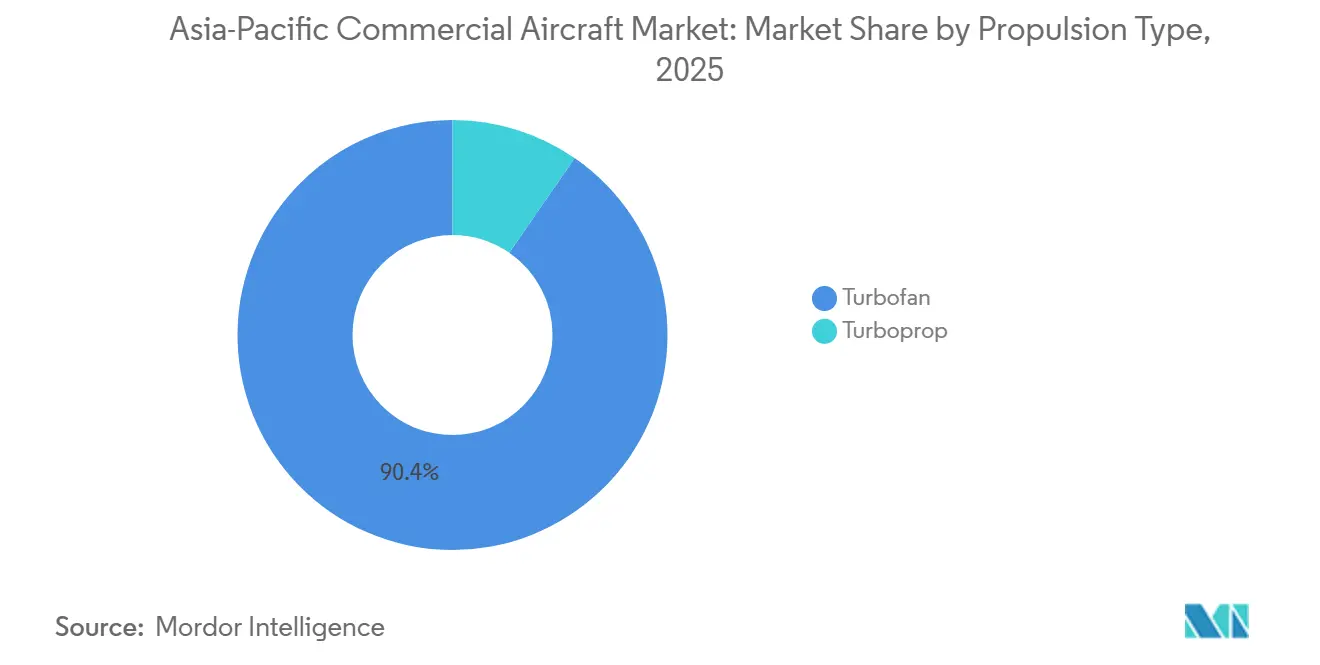
- By propulsion type, turbofan engines dominated with a 90.38% share in 2025; however, turboprops are forecasted to grow at 9.71% annually from 2026 to 2031.
- By component, airframe structures represented 34.21% of the value in 2025, whereas avionics and flight control systems are projected to expand at a 6.67% CAGR through 2031.
- By geography, China held a 37.74% share in 2025; however, India is expected to log a 10.04% CAGR during 2026-2031.
Note: Market size and forecast figures in this report are generated using Mordor Intelligence’s proprietary estimation framework, updated with the latest available data and insights as of January 2026.
Asia-Pacific Commercial Aircraft Market Trends and Insights
Driver Impact Analysis*
| Driver | (~) % Impact on CAGR Forecast | Geographic Relevance | Impact Timeline |
|---|---|---|---|
| Rapid LCC-led fleet expansion | +1.2% | India and Southeast Asia, spillover into China cities | Medium term (2-4 years) |
| Replacement need for fuel-efficient narrowbodies | +0.9% | China, Japan, South Korea | Short term (≤ 2 years) |
| Accelerated airport-infrastructure build-out | +0.8% | India, Indonesia, Thailand | Long term (≥ 4 years) |
| Scale-up of China’s domestic OEM capacity | +0.7% | China and early Southeast Asia exports | Medium term (2-4 years) |
| Engine final-assembly localization incentives | +0.5% | India, China | Long term (≥ 4 years) |
| Digital MRO ecosystem adoption | +0.4% | Singapore and Australia first movers | Short term (≤ 2 years) |
| Source: Mordor Intelligence | |||
Rapid LCC-Led Fleet Expansion
LCCs ordered 800 single-aisle aircraft between 2024 and 2025, accounting for 68% of the regional backlog, as their unit-cost advantage enables them to profit at load factors as low as 72%. IndiGo’s 500-jet order, VietJet’s 200-unit deal, and Cebu Pacific’s 100-aircraft commitment underscore a pivot toward point-to-point networks that bypass congested hubs. Fuel-efficient A320neo-family aircraft deliver a 15% reduction in fuel burn, enabling 8-12% lower average fares on sub-three-hour routes.[1]Airbus S.A.S., “A320neo Family Fuel Performance,” airbus.com Airport slots remain available in many Tier 2 Asian cities, allowing carriers to expand without incurring high congestion fees. The strategy lifts secondary-airport traffic and attracts private investment into regional terminals. Consequently, the Asia-Pacific commercial aircraft market is seeing pronounced demand for narrowbodies that match LCC economics.
Replacement Need for Fuel-Efficient Narrowbodies
More than 1,800 CFM56- and V2500-powered narrowbodies in China, Japan, and South Korea averaged 14.3 years of age in 2025, pushing maintenance reserves above residual values. China Southern retired 38 B737-800 aircraft in 2025 and cut unit fuel burn by 13% after switching to locally built C919 jets. Japan Airlines ordered 21 A321neo aircraft in 2026, citing a 19% lower trip cost versus B767-300ERs on 1,000-kilometer legs. Mid-life B737-800 and A320ceo jets are entering conversion lines, extending service life by up to 15 years and supporting freighter growth. Replacement cycles, therefore, funnel narrowbody orders toward next-generation platforms and sustain aftermarket demand for conversions.
Accelerated Airport-Infrastructure Build-Out
India opened 22 new airports in 2025, raising the national total to 148 and reducing the required daily traffic for route viability to 85 passengers. Indonesia commissioned eight new runways across Kalimantan and Sulawesi, enabling 70- to 90-seat turboprops on 1,200-meter strips. Thailand’s USD 3.8 billion expansion of U-Tapao Airport will alleviate congestion in Bangkok and add 15 million passengers per year by 2028. Such projects slash ground-handling barriers, invite new entrants, and broaden the Asia-Pacific commercial aircraft market’s route map. As infrastructure spreads, airlines diversify fleet mixes to match runway constraints and demand densities.
Scale-Up of China’s Domestic OEM Capacity
COMAC lifted C919 output to 207 units in 2025, a 63% rise year on year, and now sources 68% of components domestically. Water-over-operation certification secured in late 2025 enables the C919 to reach Indonesia and the Philippines, offering Southeast Asian carriers a 22-28% cheaper alternative to Western single-aisle aircraft. ARJ21 exports to TransNusa Airlines show that price concessions can offset brand inertia in emerging markets. As Chinese OEMs scale, Airbus and Boeing lose share in their largest regional market, reshaping procurement bargaining power across Asia-Pacific commercial aircraft market participants.
Restraint Impact Analysis*
| Restraint | (~) % Impact on CAGR Forecast | Geographic Relevance | Impact Timeline |
|---|---|---|---|
| Persistent global supply-chain bottlenecks | -0.8% | India and Southeast Asia delivery schedules | Short term (≤ 2 years) |
| Certification delays for new aircraft programs | -0.6% | China and Japan | Medium term (2-4 years) |
| Rising SAF-compliance cost pressure | -0.4% | Singapore, Japan, Australia | Medium term (2-4 years) |
| Skilled labor shortage in aero-manufacturing | -0.3% | India, China, Thailand | Long term (≥ 4 years) |
| Source: Mordor Intelligence | |||
Persistent Global Supply-Chain Bottlenecks
Pratt & Whitney’s geared-turbofan recall grounded 637 regional aircraft across 2024-2025 for inspections averaging 95 days, delaying 180 Asia-Pacific deliveries slated for 2026.[2]Jon Ostrower, “GTF Recall Timelines Stretch into 2027,” wsj.com Boeing capped B737 MAX output at 38 units per month due to fuselage quality issues, prompting carriers to extend leases at rates 18-22% above pre-recall levels. Airbus trimmed A320neo output by 6% amid titanium shortages after sanctions hit Russian supply lines. These bottlenecks compress airlines’ fleet-planning horizons and restrain near-term growth in the Asia-Pacific commercial aircraft market.
Certification Delays for New Aircraft Programs
EASA and FAA validations for the C919 have slipped beyond the expected 24-month window due to software-redundancy debates, limiting export potential to China-only certificates. Mitsubishi’s cancellation of the SpaceJet erased Japan’s only home-grown commercial airplane and left a gap in the 70-100 seat segment. Indonesia’s N219 remains uncertified outside its domestic market, curbing export revenue targets. Lengthy approvals reinforce the Western duopoly on global routes and temper competitive pressure in the Asia-Pacific commercial aircraft market.
*Our forecasts treat driver/restraint impacts as directional, not additive. The impact forecasts reflect baseline growth, mix effects, and variable interactions.
Segment Analysis
By Aircraft Type: Narrowbody Dominance Masks Regional-Jet Momentum
Narrowbody models controlled 72.78% of the Asia-Pacific commercial aircraft market share in 2025, reflecting their economics on 800- to 3,500-kilometer sectors. The Asia-Pacific commercial aircraft market for regional jets is projected to expand at a 7.37% CAGR, outpacing the overall market, as 100- to 150-seat models profitably serve routes with 90-110 daily passengers at upgraded secondary airports, where airport fees are lower.[3]Embraer, “Market Outlook 2025,” embraer.com IndiGo’s order for 50 ATR 72-600s to launch 28 UDAN routes underscores the attractiveness of rightsized aircraft on thin city pairs.
Regional jets are gaining traction as carriers introduce twice-daily frequencies on 800- to 1,200-kilometer sectors, previously served only four times a week by 50-seat turboprops. Embraer delivered 34 E195-E2 aircraft to Asia-Pacific customers in 2025, including 12 to Colorful Guizhou Airlines, whose break-even load factor dropped to 68% thanks to a 17.3% fuel-burn edge over legacy E-Jets. Turboprop interest is also reviving in Southeast Asia, where ATR has secured 78 orders for operations on runways up to 1,400 meters in length at minimal ground-support costs. Widebody deliveries declined 9% in 2025 as airlines prioritized faster asset turnover on single-aisles, signaling that long-haul growth will lag behind regional-route expansion through 2031.


By Application: Freighter Upswing Alters Revenue Mix
Passenger configurations held a 94.89% share in 2025; however, the Asia-Pacific commercial aircraft freighter market is growing at an 8.81% CAGR, driven by e-commerce, which now treats air cargo as a core distribution layer. Alibaba’s Cainiao arm expanded its dedicated fleet from eight to 14 units in 2025 and aims to reach 25 by 2027, utilizing 737-800 and A321 converted freighters that carry payloads of 23-27 tons at 35% lower costs than widebody freighters on intra-Asia lanes.
Retailers are bypassing forwarders and contracting with airlines directly for guaranteed capacity, which commands premiums of 18-25%. Lessors exploit arbitrage in passenger-to-freighter conversions, investing USD 4-6 million to earn unlevered returns of over 14% over a 12-year life. Combination passenger-freighter use remains niche because cabin-cargo rules limit flexibility, allowing dedicated freighters to capture most incremental cargo demand in the Asia-Pacific commercial aircraft market.
By Propulsion Type: Turboprops Stage a Cost-Driven Revival
Turbofan engines still dominate with a 90.38% share, but turboprops are forecast to record a 9.71% CAGR through 2031 as airlines revisit the economics of sub-600-kilometer routes. Philippine Airlines ordered 18 ATR 72-600 aircraft, citing 12% lower maintenance costs and 40% longer overhaul intervals than the Dash 8 they are replacing. PW127XT engines deliver an incremental 3% fuel-burn improvement, extending maximum range to 1,665 kilometers and opening longer island-hopping sectors.
Around 142 Southeast Asian airports have runways shorter than 1,500 meters and lack precision approaches, conditions ideal for turboprops’ short-field capability. Turbofan speed remains decisive beyond 1,000 kilometers; however, slot costs drive airlines to diversify their propulsion choices. Experimental hybrid-electric concepts are in flight-test phases, but commercial entry before 2029 depends on breakthroughs in battery density.
By Component: Avionics and Flight Control Systems Gain Share
Airframe structures accounted for 34.21% of the component value in 2025, but avionics and flight-control systems are growing at a 6.67% CAGR due to software-defined upgrades. Honeywell’s GoDirect orders jumped 34% in 2025 as carriers embraced predictive-maintenance savings. Thales retrofitted 240 narrowbody aircraft with 100 Mbps satellite links, generating USD 8-12 in ancillary revenue per passenger.
Engines accounted for 28% of value, led by LEAP variants compatible with 50% SAF blends, a feature that shields operators from rising carbon-offset costs. Cabin interiors captured 19% as airlines invested in premium-economy retrofits, a strategy that lifted Singapore Airlines’ premium bookings by 18% after a USD 230 million upgrade. Other systems, such as landing gear and APUs, account for 18.79% and are expected to expand significantly in line with fleet growth.
Geography Analysis
China commanded 37.74% of the Asia-Pacific commercial aircraft market value in 2025, supported by 660 million passengers. In contrast, India is poised for a 10.04% CAGR from 2026 to 2031, driven by UDAN-enabled connectivity, which lifted domestic traffic 16% in 2025 to 185 million.[4]Directorate General of Civil Aviation India, “Traffic Report 2025,” dgca.gov.in Air India’s 470-aircraft order will raise the national narrowbody fleet 38% by 2027 and introduce 91 new routes. IndiGo’s 61% domestic market share across 142 monopoly city pairs underscores its pricing power in India’s fast-growing market.
Japan, South Korea, and Australia accounted for 28% of the market in 2025, driven by fleet replacements rather than expansion. Japan Airlines and ANA are introducing A321XLRs and 787-8s to reduce trip costs by up to 22% on dense short-haul routes. Australia’s market saw new competition when Bonza Airlines launched B737 MAX operations on 17 regional routes, forcing incumbents to lower fares by 12-18% and growing traffic by 9% on the affected sectors.
Southeast Asia, comprising Thailand, Indonesia, Vietnam, the Philippines, and Malaysia, accounted for 19% of the regional value in 2025 and is projected to grow at 6.8%, as privatized airports attract USD 12 billion for new terminals that will add capacity for 47 million additional passengers by 2028. Indonesia’s archipelagic geography favors 70-90-seat turboprop aircraft connecting Kalimantan and Sulawesi, an opportunity underscored by the completion of 8 airports in 2025.
South Korea is pivoting toward long-haul premium traffic, with Korean Air and Asiana operating 68 widebody aircraft and capturing yields, as premium cabins generate 55% of revenue. Smaller Pacific and Himalayan markets together accounted for 4% in 2025; liberalization moves, such as Papua New Guinea’s 2024 policy, are attracting carrier interest in niche mining charters.
Competitive Landscape
Airbus and Boeing still held 78% of single-aisle and twin-aisle backlog in late 2025, yet COMAC’s 18% share of Chinese orders indicates a structural shift. Western OEMs are localizing final assembly. Airbus increased Tianjin A320 production to eight per month in 2025, and Boeing is negotiating a Shanghai interiors center to meet content mandates and hedge currency exposure. In turn, COMAC offers 20-25% price discounts with payment deferrals covering 40% of the list price until after delivery, which is attractive to cash-constrained LCCs.[5]Financial Times, “Asian Aircraft Financing Trends,” ft.com
White space persists in the 100-150 seat range: Airbus A220 penetration remains limited, and the Embraer E2 family holds only a 6% share, leaving room for Chinese stretch variants to compete if certification hurdles ease. Leasing firms are vertically integrating to secure aftermarket earnings; BOC Aviation’s 35% stake in ST Engineering Aerospace ensures access to engine-shop slots and trims hourly maintenance costs by 8-11%.
Digital ecosystems confer measurable advantages: airlines that deploy predictive analytics can extend utilization by up to 220 block hours per year, effectively adding two aircraft to every 100 without incurring capital expenditures. Emissions policies also shape decisions; the A321neo’s 20% fuel-burn edge over B737-800s cuts annual CORSIA offsets by up to USD 2.4 million on typical regional networks.
Asia-Pacific Commercial Aircraft Industry Leaders
Airbus SE
The Boeing Company
ATR
Embraer S.A.
Commercial Aircraft Corporation of China, Ltd. (COMAC)
- *Disclaimer: Major Players sorted in no particular order

Recent Industry Developments
- December 2024: Air India, a prominent global airline based in India, announced an order for 100 additional Airbus aircraft. This order comprises 10 widebody A350 aircraft and 90 narrowbody A320 Family aircraft, including the A321neo. These 100 aircraft are in addition to the 470 jets previously ordered from Airbus and Boeing.
- July 2024: Japan Airlines (JAL) signed a firm order with Airbus for 20 A350-900 widebody aircraft and 11 single-aisle A321neo aircraft.
- April 2024: Air China announced that it had signed an agreement with the Commercial Aircraft Corporation of China (COMAC) to purchase 100 C919 aircraft.


Asia-Pacific Commercial Aircraft Market Report Scope
Commercial aircraft means any aircraft other than public aircraft engaged in the business of transporting property or persons.
The Asia-Pacific commercial aircraft market is segmented by aircraft type, propulsion type, application, component, and geography. By aircraft type, the market is segmented into narrowbody, widebody, and regional jets. By propulsion type, the market is segmented into turbofan and turboprop. By application, the market is classified into passenger aircraft and freighters. By component, the market is segmented into airframe structures, aero-engines, avionics and flight controls, cabin interiors and IFEC, and other elements. The report also covers the market sizes and forecasts for the Asia-Pacific commercial aircraft market across major countries in the region. The market sizing and forecasts have been provided in value (USD billion).
By Aircraft Type
| Narrowbody |
| Widebody |
| Regional Jets |
By Application
| Passenger |
| Freighter |
By Propulsion Type
| Turbofan |
| Turboprop |
By Component
| Airframe Structures |
| Aero-Engines |
| Avionics and Flight Control |
| Cabin Interior and IFEC |
| Other Components |
By Geography
| China |
| India |
| Japan |
| South Korea |
| Australia |
| Thailand |
| Indonesia |
| Rest of Asia-Pacific |
| By Aircraft Type | Narrowbody |
| Widebody | |
| Regional Jets | |
| By Application | Passenger |
| Freighter | |
| By Propulsion Type | Turbofan |
| Turboprop | |
| By Component | Airframe Structures |
| Aero-Engines | |
| Avionics and Flight Control | |
| Cabin Interior and IFEC | |
| Other Components | |
| By Geography | China |
| India | |
| Japan | |
| South Korea | |
| Australia | |
| Thailand | |
| Indonesia | |
| Rest of Asia-Pacific |


Key Questions Answered in the Report
How large is the Asia-Pacific commercial aircraft market in 2026?
It reached USD 92.62 billion in 2026 and is forecast to grow at a 5.03% CAGR to USD 118.35 billion by 2031.
Which aircraft segment is growing fastest in the region?
Regional jets are projected to advance at a 7.37% CAGR through 2031, the quickest among major aircraft types.
Why are turboprops making a comeback in Asia-Pacific?
Sub-600 kilometer routes, short runways, and fuel savings of 25-30% over jets are driving a 9.71% CAGR for turboprops.
Which country will post the strongest growth through 2031?
India is forecast to record a 10.04% CAGR as UDAN connectivity and large fleet orders expand capacity.
How is e-commerce affecting aircraft demand?
Rising parcel volumes are boosting freighter conversions, lifting freighter growth to an 8.81% CAGR in the region.
What strategic moves are OEMs making to stay competitive?
Airbus and Boeing are localizing final assembly in China, while COMAC offers price discounts and state-backed financing to win orders.
Page last updated on:


