Raw Coffee Beans Market Size and Share
Raw Coffee Beans Market Analysis by Mordor Intelligence
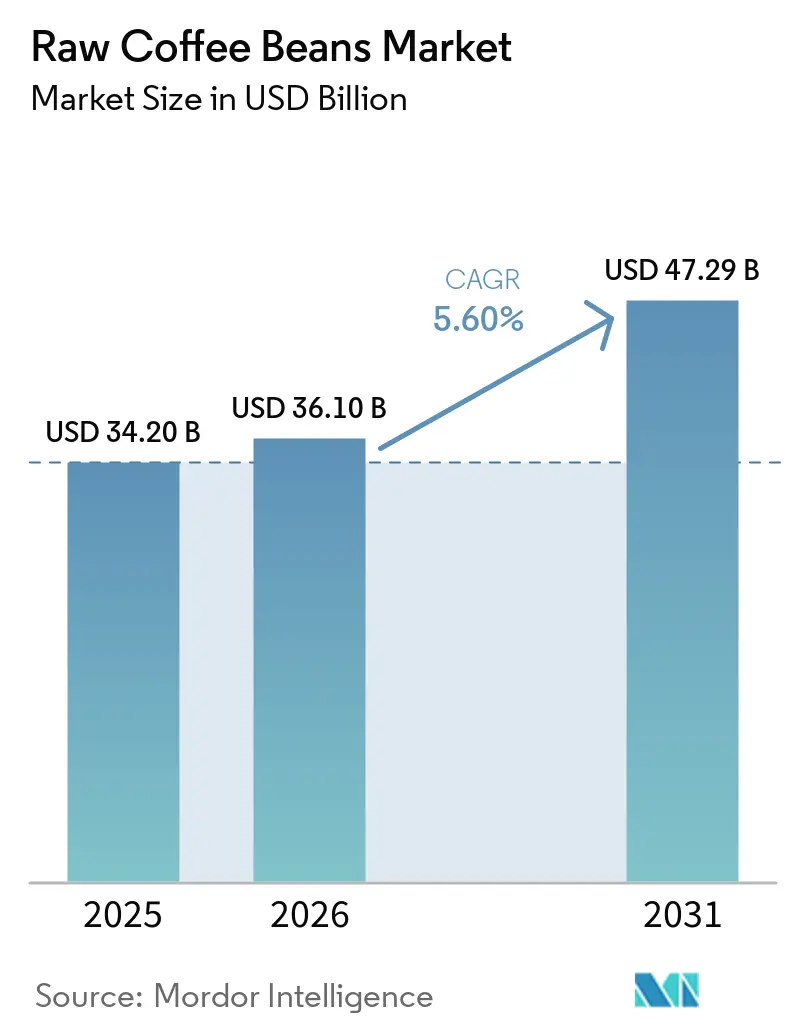
The raw coffee beans market size is projected to expand from USD 34.20 billion in 2025 and USD 36.10 billion in 2026 to USD 47.29 billion by 2031, registering a CAGR of 5.60% during 2026–2031. Tight supply and depleted inventories kept green coffee prices elevated in 2025, with the International Coffee Organization‘s (ICO) Composite Indicator Price reaching 354.32 US cents per lb in February, further pressuring roaster margins across major consuming countries. Demand remains resilient because Europe continues to anchor global imports, while Asia-Pacific is adding new consumption through expanding roasting, café, and domestic processing. At the same time, consolidation among large traders and rising traceability and carbon-reporting requirements are pushing the raw coffee beans market toward better-capitalized supply chains and more selective origin partnerships. Parallel investments in blockchain traceability currently encompass 42,000 raw coffee bean farmers across Honduras, India, and Kenya, transforming the distribution of quality premiums to producers and lowering verification costs for buyers.
Key Report Takeaways
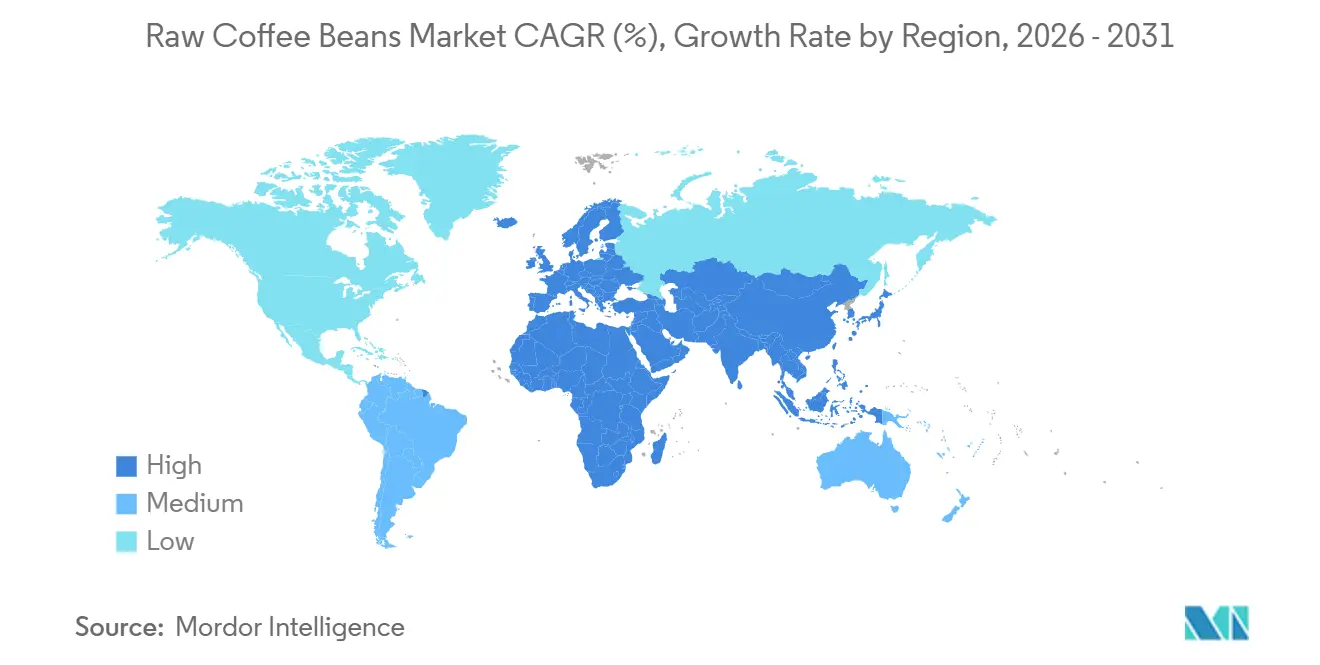
- By geography, Europe is the largest region, accounting for 32.7% of raw coffee beans market size, whereas Asia-Pacific is the fastest-growing region, projected to grow at a 6.2% CAGR through 2026 to 2031.
Note: Market size and forecast figures in this report are generated using Mordor Intelligence’s proprietary estimation framework, updated with the latest available data and insights as of 2026.
Global Raw Coffee Beans Market Trends and Insights
Drivers Impact Analysis*
| Driver | (~) % Impact on CAGR Forecast | Geographic Relevance | Impact Timeline |
|---|---|---|---|
| Rising specialty coffee demand and premiumization wave | +1.5% | Global, strongest in North America, Europe, and Asia-Pacific urban centers | Medium term (2-4 years) |
| Certification premiums driving price floors for producers | +0.8% | Global, with early gains in the European Union, North America, and East Africa | Medium term (2-4 years) |
| Ready-To-Drink (RTD) coffee category pulling incremental green bean demand | +1.2% | Asia-Pacific core, with spillover to North America, Middle East and Africa | Short term (≤ 2 years) |
| Digital and direct-trade platforms expanding market access | +0.5% | Global, led by Japan, the Netherlands, Colombia, and Ethiopia | Medium term (2-4 years) |
| Corporate net-zero and Scope 3 commitments restructuring sourcing | +0.6% | European Union and North America, with knock-on effects on Brazil, Vietnam, and Uganda | Long term (≥ 4 years) |
| R&D in climate-resilient and disease-resistant coffee varieties | +0.4% | South America, Africa, and Asia-Pacific | Long term (≥ 4 years) |
| Source: Mordor Intelligence | |||
Rising Specialty Coffee Demand and the Premiumization Wave
Specialty demand has become a structural support for the raw coffee beans market, as buyers increasingly seek origin-specific coffee with greater traceability and more stable cup quality. According to the United States Department of Agriculture (USDA), Colombia’s 2024/25 crop reached 14.8 million bags, its highest output in 30 years, strengthening the supply of washed Arabica lots to higher-value channels[1]Source: United States Department of Agriculture Foreign Agricultural Service, “Coffee, World Markets and Trade,” usda.gov. That premium signal is encouraging growers to keep investing in farm renovation rather than relying solely on short-term price gains. Use of rust-resistant varieties is growing in Colombia, supporting more consistent quality and greater resilience for premium-oriented export programs. The result is a raw coffee beans market where grading, segregation, and verified origin quality matter more than they did in a purely volume-led trade.
Certification Premiums are Driving Price Floors for Producers
Certification programs are providing the raw coffee beans market with a more stable pricing floor for farmers, especially when spot prices are volatile, and compliance costs are rising. Fairtrade International kept the minimum price for washed Arabica at USD 1.80 per lb from August 2023, with an added USD 0.40 per lb organic differential, which continued to support certified producers through 2025 and 2026. In Europe, Rainforest Alliance-certified green coffee imports reached 751 thousand metric tons in 2024, representing 22.7% of total European green coffee imports, demonstrating that certification already has meaningful scale in large-consuming markets. In the raw coffee beans market, this matters because certification systems are increasingly serving 2 functions at once, helping producers earn a premium and supporting the traceability infrastructure that buyers now need for stricter sourcing rules.
Ready-To-Drink (RTD) Coffee Category Pulling Incremental Green Bean Demand
Ready-To-Drink (RTD) coffee is strengthening the raw coffee beans market because manufacturers need dependable, forward-planned access to beans that fit consistent flavor and processing requirements. This demand pattern favors suppliers that can deliver large, traceable lots over multiple contract cycles rather than relying on spot cargoes. Nestlé's freeze-drying innovation enhances cold coffee solubility and extends product shelf life. In the Asia-Pacific region, demand is driven by rapid urbanization and a growing preference for convenient, portable formats. Advances in processing now enable the monetization of coffee waste; ofi has commercialized cascara powder, while PectCof extracts Dutch Gum emulsifiers, generating additional revenue streams and improving overall coffee bean economics.
Digital and Direct-Trade Platforms Expanding Market Access
Digital channels are widening access in the raw coffee beans market by reducing the number of intermediaries between producers and buyers. Japan’s TYPICA platform operates across 40 countries, connects producers in 36 origins with more than 5,000 buyers, and has reported average producer earnings 2.2 times higher than under conventional trade structures. This model is helping smaller and differentiated lots reach roasters that want direct relationships without building a large physical sourcing network. Over time, the raw coffee beans market is likely to split more clearly between standardized commodity flows run by major merchants and higher-value lots sold through digital and direct-trade systems.
Restraints Impact Analysis*
| Restraint | (~) % Impact on CAGR Forecast | Geographic Relevance | Impact Timeline |
|---|---|---|---|
| Climate volatility causing production shortfalls in key origins | -0.9% | South America, Asia-Pacific, and East Africa | Short term (≤ 2 years) to Long term (≥ 4 years) |
| European Union Deforestation Regulation (EUDR) compliance burden creating market access barriers | -0.7% | European Union importers and African, Central American, and Asian exporters | Medium term (2-4 years) |
| Green coffee price instability compressing downstream demand | -0.8% | Global, with sharper pressure in price-sensitive Asian and African consuming markets | Short term (≤ 2 years) |
| Competition from alternative beverages in key consuming markets | -0.5% | Asia-Pacific, and with secondary impact in the Middle East | Medium term (2-4 years) |
| Source: Mordor Intelligence | |||
Climate Volatility Causing Production Shortfalls in Key Origins
Climate volatility remains the strongest downside pressure on the raw coffee beans market because it directly affects flowering, fruit set, yield, and bean quality across key origins. A 2025 study in Agricultural Systems projected Arabica yield declines of 23% to 35% across South America by 2036 to 2065 under different emissions pathways[2]Source: Raniero Della Peruta, Valentina Mereu, Donatella Spano, Serena Marras, Remi Vezy, and Antonio Trabucco, “Projecting Trends of Arabica Coffee Yield Under Climate Change, A Process-Based Modelling Study at Continental Scale,” cirad.fr. Separate research published in Climatic Change showed that Brazil’s leading Arabica-producing states could still face material yield declines later in the century, indicating the risk is not confined to a single bad season. Uganda also faces lower Arabica suitability by 2050 under medium-emission scenarios, which shows that the raw coffee beans market is dealing with a widening geographic spread of climate risk rather than an isolated regional issue.
European Union Deforestation Regulation (EUDR) Compliance Burden Creating Market Access Barriers
The European Union Deforestation Regulation (EUDR) is increasing access costs in the raw coffee market, as exporters must demonstrate deforestation-free sourcing and plot-level traceability for coffee sold into Europe. This burden is easier for large, well-documented suppliers to manage than for fragmented smallholder systems with limited digital registration. Foreign Policy reported that Ethiopia’s 5 million coffee smallholder households may need about 2 years to complete full geolocation, underscoring how demanding the process can be for major African origins. The result for the raw coffee beans market is a growing risk that European sourcing becomes more concentrated in a smaller number of origins and exporters that already have traceability at scale.
*Our forecasts treat driver/restraint impacts as directional, not additive. The impact forecasts reflect baseline growth, mix effects, and variable interactions.
Geography Analysis
Europe accounted for 32.7% of the raw coffee beans market share in 2025, and remains the largest demand center. Germany is the leading importer of green coffee in Europe. It hosts Neuman Kaffee Gruppe (NKG), the world’s largest coffee trader. A significant portion of the imported coffee is re-exported to neighboring countries. Germany also has the second-largest coffee roasting industry in Europe, following Italy. According to Eurostat, Germany imported 1.16 million metric tons of green coffee in 2024. The European Union imported 46.2 million 60-kg bags in 2024/25, indicating that mature consumption is still supported by a large industrial roasting base[3]Source: CBI, “What Is the Demand for Coffee on the European Market,” cbi.eu.
Asia-Pacific is the fastest-growing region, projected to grow at a 6.2% CAGR through 2026 to 2031, making it the fastest-growing consumption region. According to the United States Department of Agriculture (USDA), Vietnam's domestic coffee market is experiencing notable growth, driven by an expanding cafe culture, rising income levels, and a young, urban population seeking diverse coffee experiences. Although exports continue to dominate the industry, the local market is gaining significance. Annual per capita coffee consumption is increasing steadily and reached 3 kilograms in 2025. This change gives the raw coffee beans industry a stronger internal demand base across producing and neighboring countries. It also means the raw coffee beans market is becoming less dependent on a single mature consumption pattern and more influenced by younger café, soluble, and processed coffee channels in Asia-Pacific.
South America is a major global supplier of raw (green) coffee beans, with significant demand centered in countries like Brazil, Colombia, Peru, and Ecuador. Brazil leads in both production and export, driven by extensive arabica and robusta cultivation. Colombia is internationally renowned for its premium arabica beans, which are widely used in specialty coffee markets. Peru is witnessing growing export demand for organic and sustainable green coffee beans, particularly from roasters in North America and Europe.


Competitive Landscape
The competitive structure of the raw coffee beans market involves various stakeholders, including producers, importers, exporters, and distributors. Companies such as Neumann Kaffee Gruppe, Louis Dreyfus Company, Sucafina, ECOM Agroindustrial, and ofi hold a significant share of globally traded green coffee volumes. Meanwhile, smaller importers and specialty merchants remain active in local and niche channels. Technology and compliance tools are increasingly important in the raw coffee beans market. For instance, ofi reported that its AtSource platform and Digital Footprint Calculator provided farm-level greenhouse gas data for nearly half of its direct coffee volumes in 2024. Additionally, NKG Verified tracked over 30,000 farmers across 10 countries.
Sustainability, traceability, and regulatory compliance are emerging as critical competitive factors in the raw coffee beans market. Leading traders and exporters are prioritizing investments in transparent sourcing systems, farmer training initiatives, and climate-resilient agricultural practices to align with evolving buyer expectations and international regulations, including the European Union Deforestation Regulation (EUDR). Companies are also strengthening collaborations with cooperatives and certification organizations to ensure a consistent supply of responsibly sourced coffee beans. Certifications such as Rainforest Alliance, Fairtrade, and Organic continue to play a significant role in influencing purchasing decisions, particularly among global roasters and specialty coffee brands in Europe and North America.
Market competition is intensifying amid growing demand for specialty and premium coffee products. Specialty coffee importers and regional roasters are increasingly emphasizing single-origin beans, micro-lot sourcing, and unique flavor profiles to target higher-value market segments. The adoption of digital trading platforms, blockchain-based traceability systems, and AI-driven supply chain analytics is further transforming procurement and inventory management processes across the industry. Climate variability in key producing countries such as Brazil and Vietnam is prompting companies to diversify sourcing regions and enhance supply chain resilience to mitigate pricing fluctuations and production risks.
Recent Industry Developments
- August 2025: The United States imposed 50% tariffs on Brazilian coffee and 40% on Colombian and Vietnamese beans to protect domestic industries, address trade imbalances, and encourage supply diversification. These tariffs raised import costs, prompting importers to expedite shipments and reassess sourcing to minimize costs and maintain supply stability.
- August 2024: Intercontinental Exchange (ICE) introduced its Commodity Traceability Service with Space Intelligence, delivering geospatial forest-mapping for coffee supply chains ahead of European Union deforestation rules.
- November 2023: Saudi Coffee Company, a unit of the Public Investment Fund, has opened its first model farm in Jazan. The one-million-square-meter site acts as a living laboratory for sustainable Coffea arabica cultivation. By 2030, the project plans to plant five million coffee trees and lift the Kingdom’s annual production from 300 tons to 2,500 metric tons. The program supports Saudi Vision 2030 while following global best-practice farming standards.


Global Raw Coffee Beans Market Report Scope
Raw coffee beans are the seeds of the coffee plant, which are roasted and processed to make coffee powders, granules, and other beverage forms. The raw coffee beans market is segmented by geography (North America, South America, Asia-Pacific, and more). The report includes production analysis (volume), consumption analysis (value and volume), export analysis (value and volume), import analysis (value and volume), and price trend analysis. The market forecasts are provided in terms of Value (USD) and Volume (Metric Tons).
| North America | United States | Production Analysis (Area Harvested, Yield, and Production Volume) |
| Consumption Analysis (Consumption Value and Volume) | ||
| Import Market Analysis (Import Value, Volume, and Key Supplying Markets) | ||
| Export Market Analysis (Export Value, Volume, and Key Destination Markets) | ||
| Wholesale Price Trend Analysis and Forecast | ||
| Regulatory Framework | ||
| List of Key Players | ||
| Logistics and Infrastructure | ||
| Seasonality Analysis | ||
| Mexico | Production Analysis (Area Harvested, Yield, and Production Volume) | |
| Consumption Analysis (Consumption Value and Volume) | ||
| Import Market Analysis (Import Value, Volume, and Key Supplying Markets) | ||
| Export Market Analysis (Export Value, Volume, and Key Destination Markets) | ||
| Wholesale Price Trend Analysis and Forecast | ||
| Regulatory Framework | ||
| List of Key Players | ||
| Logistics and Infrastructure | ||
| Seasonality Analysis | ||
| Europe | Italy | Production Analysis (Area Harvested, Yield, and Production Volume) |
| Consumption Analysis (Consumption Value and Volume) | ||
| Import Market Analysis (Import Value, Volume, and Key Supplying Markets) | ||
| Export Market Analysis (Export Value, Volume, and Key Destination Markets) | ||
| Wholesale Price Trend Analysis and Forecast | ||
| Regulatory Framework | ||
| List of Key Players | ||
| Logistics and Infrastructure | ||
| Seasonality Analysis | ||
| Germany | Production Analysis (Area Harvested, Yield, and Production Volume) | |
| Consumption Analysis (Consumption Value and Volume) | ||
| Import Market Analysis (Import Value, Volume, and Key Supplying Markets) | ||
| Export Market Analysis (Export Value, Volume, and Key Destination Markets) | ||
| Wholesale Price Trend Analysis and Forecast | ||
| Regulatory Framework | ||
| List of Key Players | ||
| Logistics and Infrastructure | ||
| Seasonality Analysis | ||
| Switzerland | Production Analysis (Area Harvested, Yield, and Production Volume) | |
| Consumption Analysis (Consumption Value and Volume) | ||
| Import Market Analysis (Import Value, Volume, and Key Supplying Markets) | ||
| Export Market Analysis (Export Value, Volume, and Key Destination Markets) | ||
| Wholesale Price Trend Analysis and Forecast | ||
| Regulatory Framework | ||
| List of Key Players | ||
| Logistics and Infrastructure | ||
| Seasonality Analysis | ||
| Asia-Pacific | China | Production Analysis (Area Harvested, Yield, and Production Volume) |
| Consumption Analysis (Consumption Value and Volume) | ||
| Import Market Analysis (Import Value, Volume, and Key Supplying Markets) | ||
| Export Market Analysis (Export Value, Volume, and Key Destination Markets) | ||
| Wholesale Price Trend Analysis and Forecast | ||
| Regulatory Framework | ||
| List of Key Players | ||
| Logistics and Infrastructure | ||
| Seasonality Analysis | ||
| India | Production Analysis (Area Harvested, Yield, and Production Volume) | |
| Consumption Analysis (Consumption Value and Volume) | ||
| Import Market Analysis (Import Value, Volume, and Key Supplying Markets) | ||
| Export Market Analysis (Export Value, Volume, and Key Destination Markets) | ||
| Wholesale Price Trend Analysis and Forecast | ||
| Regulatory Framework | ||
| List of Key Players | ||
| Logistic and Infrastructure | ||
| Seasonality Analysis | ||
| Vietnam | Production Analysis (Area Harvested, Yield, and Production Volume) | |
| Consumption Analysis (Consumption Value and Volume) | ||
| Import Market Analysis (Import Value, Volume, and Key Supplying Markets) | ||
| Export Market Analysis (Export Value, Volume, and Key Destination Markets) | ||
| Wholesale Price Trend Analysis and Forecast | ||
| Regulatory Framework | ||
| List of Key Players | ||
| Logistics and Infrastructure | ||
| Seasonality Analysis | ||
| Indonesia | Production Analysis (Area Harvested, Yield, and Production Volume) | |
| Consumption Analysis (Consumption Value and Volume) | ||
| Import Market Analysis (Import Value, Volume, and Key Supplying Markets) | ||
| Export Market Analysis (Export Value, Volume, and Key Destination Markets) | ||
| Wholesale Price Trend Analysis and Forecast | ||
| Regulatory Framework | ||
| List of Key Players | ||
| Logistics and Infrastructure | ||
| Seasonality Analysis | ||
| South America | Brazil | Production Analysis (Area Harvested, Yield, and Production Volume) |
| Consumption Analysis (Consumption Value and Volume) | ||
| Import Market Analysis (Import Value, Volume, and Key Supplying Markets) | ||
| Export Market Analysis (Export Value, Volume, and Key Destination Markets) | ||
| Wholesale Price Trend Analysis and Forecast | ||
| Regulatory Framework | ||
| List of Key Players | ||
| Logistics and Infrastructure | ||
| Seasonality Analysis | ||
| Colombia | Production Analysis (Area Harvested, Yield, and Production Volume) | |
| Consumption Analysis (Consumption Value and Volume) | ||
| Import Market Analysis (Import Value, Volume, and Key Supplying Markets) | ||
| Export Market Analysis (Export Value, Volume, and Key Destination Markets) | ||
| Wholesale Price Trend Analysis and Forecast | ||
| Regulatory Framework | ||
| List of Key Players | ||
| Logistics and Infrastructure | ||
| Seasonality Analysis | ||
| Peru | Production Analysis (Area Harvested, Yield, and Production Volume) | |
| Consumption Analysis (Consumption Value and Volume) | ||
| Import Market Analysis (Import Value, Volume, and Key Supplying Markets) | ||
| Export Market Analysis (Export Value, Volume, and Key Destination Markets) | ||
| Wholesale Price Trend Analysis and Forecast | ||
| Regulatory Framework | ||
| List of Key Players | ||
| Logistics and Infrastructure | ||
| Seasonality Analysis | ||
| Middle East | Turkey | Production Analysis (Area Harvested, Yield, and Production Volume) |
| Consumption Analysis (Consumption Value and Volume) | ||
| Import Market Analysis (Import Value, Volume, and Key Supplying Markets) | ||
| Export Market Analysis (Export Value, Volume, and Key Destination Markets) | ||
| Wholesale Price Trend Analysis and Forecast | ||
| Regulatory Framework | ||
| List of Key Players | ||
| Logistics and Infrastructure | ||
| Seasonality Analysis | ||
| Saudi Arabia | Production Analysis (Area Harvested, Yield, and Production Volume) | |
| Consumption Analysis (Consumption Value and Volume) | ||
| Import Market Analysis (Import Value, Volume, and Key Supplying Markets) | ||
| Export Market Analysis (Export Value, Volume, and Key Destination Markets) | ||
| Wholesale Price Trend Analysis and Forecast | ||
| Regulatory Framework | ||
| List of Key Players | ||
| Logistics and Infrastructure | ||
| Seasonality Analysis | ||
| Yemen | Production Analysis (Area Harvested, Yield, and Production Volume) | |
| Consumption Analysis (Consumption Value and Volume) | ||
| Import Market Analysis (Import Value, Volume, and Key Supplying Markets) | ||
| Export Market Analysis (Export Value, Volume, and Key Destination Markets) | ||
| Wholesale Price Trend Analysis and Forecast | ||
| Regulatory Framework | ||
| List of Key Players | ||
| Logistics and Infrastructure | ||
| Seasonality Analysis | ||
| Africa | Ethiopia | Production Analysis (Area Harvested, Yield, and Production Volume) |
| Consumption Analysis (Consumption Value and Volume) | ||
| Import Market Analysis (Import Value, Volume, and Key Supplying Markets) | ||
| Export Market Analysis (Export Value, Volume, and Key Destination Markets) | ||
| Wholesale Price Trend Analysis and Forecast | ||
| Regulatory Framework | ||
| List of Key Players | ||
| Logistics and Infrastructure | ||
| Seasonality Analysis | ||
| South Africa | Production Analysis (Area Harvested, Yield, and Production Volume) | |
| Consumption Analysis (Consumption Value and Volume) | ||
| Import Market Analysis (Import Value, Volume, and Key Supplying Markets) | ||
| Export Market Analysis (Export Value, Volume, and Key Destination Markets) | ||
| Wholesale Price Trend Analysis and Forecast | ||
| Regulatory Framework | ||
| List of Key Players | ||
| Logistics and Infrastructure | ||
| Seasonality Analysis | ||
| Uganda | Production Analysis (Area Harvested, Yield, and Production Volume) | |
| Consumption Analysis (Consumption Value and Volume) | ||
| Import Market Analysis (Import Value, Volume, and Key Supplying Markets) | ||
| Export Market Analysis (Export Value, Volume, and Key Destination Markets) | ||
| Wholesale Price Trend Analysis and Forecast | ||
| Regulatory Framework | ||
| List of Key Players | ||
| Logistics and Infrastructure | ||
| Seasonality Analysis | ||
| By Geography | North America | United States | Production Analysis (Area Harvested, Yield, and Production Volume) |
| Consumption Analysis (Consumption Value and Volume) | |||
| Import Market Analysis (Import Value, Volume, and Key Supplying Markets) | |||
| Export Market Analysis (Export Value, Volume, and Key Destination Markets) | |||
| Wholesale Price Trend Analysis and Forecast | |||
| Regulatory Framework | |||
| List of Key Players | |||
| Logistics and Infrastructure | |||
| Seasonality Analysis | |||
| Mexico | Production Analysis (Area Harvested, Yield, and Production Volume) | ||
| Consumption Analysis (Consumption Value and Volume) | |||
| Import Market Analysis (Import Value, Volume, and Key Supplying Markets) | |||
| Export Market Analysis (Export Value, Volume, and Key Destination Markets) | |||
| Wholesale Price Trend Analysis and Forecast | |||
| Regulatory Framework | |||
| List of Key Players | |||
| Logistics and Infrastructure | |||
| Seasonality Analysis | |||
| Europe | Italy | Production Analysis (Area Harvested, Yield, and Production Volume) | |
| Consumption Analysis (Consumption Value and Volume) | |||
| Import Market Analysis (Import Value, Volume, and Key Supplying Markets) | |||
| Export Market Analysis (Export Value, Volume, and Key Destination Markets) | |||
| Wholesale Price Trend Analysis and Forecast | |||
| Regulatory Framework | |||
| List of Key Players | |||
| Logistics and Infrastructure | |||
| Seasonality Analysis | |||
| Germany | Production Analysis (Area Harvested, Yield, and Production Volume) | ||
| Consumption Analysis (Consumption Value and Volume) | |||
| Import Market Analysis (Import Value, Volume, and Key Supplying Markets) | |||
| Export Market Analysis (Export Value, Volume, and Key Destination Markets) | |||
| Wholesale Price Trend Analysis and Forecast | |||
| Regulatory Framework | |||
| List of Key Players | |||
| Logistics and Infrastructure | |||
| Seasonality Analysis | |||
| Switzerland | Production Analysis (Area Harvested, Yield, and Production Volume) | ||
| Consumption Analysis (Consumption Value and Volume) | |||
| Import Market Analysis (Import Value, Volume, and Key Supplying Markets) | |||
| Export Market Analysis (Export Value, Volume, and Key Destination Markets) | |||
| Wholesale Price Trend Analysis and Forecast | |||
| Regulatory Framework | |||
| List of Key Players | |||
| Logistics and Infrastructure | |||
| Seasonality Analysis | |||
| Asia-Pacific | China | Production Analysis (Area Harvested, Yield, and Production Volume) | |
| Consumption Analysis (Consumption Value and Volume) | |||
| Import Market Analysis (Import Value, Volume, and Key Supplying Markets) | |||
| Export Market Analysis (Export Value, Volume, and Key Destination Markets) | |||
| Wholesale Price Trend Analysis and Forecast | |||
| Regulatory Framework | |||
| List of Key Players | |||
| Logistics and Infrastructure | |||
| Seasonality Analysis | |||
| India | Production Analysis (Area Harvested, Yield, and Production Volume) | ||
| Consumption Analysis (Consumption Value and Volume) | |||
| Import Market Analysis (Import Value, Volume, and Key Supplying Markets) | |||
| Export Market Analysis (Export Value, Volume, and Key Destination Markets) | |||
| Wholesale Price Trend Analysis and Forecast | |||
| Regulatory Framework | |||
| List of Key Players | |||
| Logistic and Infrastructure | |||
| Seasonality Analysis | |||
| Vietnam | Production Analysis (Area Harvested, Yield, and Production Volume) | ||
| Consumption Analysis (Consumption Value and Volume) | |||
| Import Market Analysis (Import Value, Volume, and Key Supplying Markets) | |||
| Export Market Analysis (Export Value, Volume, and Key Destination Markets) | |||
| Wholesale Price Trend Analysis and Forecast | |||
| Regulatory Framework | |||
| List of Key Players | |||
| Logistics and Infrastructure | |||
| Seasonality Analysis | |||
| Indonesia | Production Analysis (Area Harvested, Yield, and Production Volume) | ||
| Consumption Analysis (Consumption Value and Volume) | |||
| Import Market Analysis (Import Value, Volume, and Key Supplying Markets) | |||
| Export Market Analysis (Export Value, Volume, and Key Destination Markets) | |||
| Wholesale Price Trend Analysis and Forecast | |||
| Regulatory Framework | |||
| List of Key Players | |||
| Logistics and Infrastructure | |||
| Seasonality Analysis | |||
| South America | Brazil | Production Analysis (Area Harvested, Yield, and Production Volume) | |
| Consumption Analysis (Consumption Value and Volume) | |||
| Import Market Analysis (Import Value, Volume, and Key Supplying Markets) | |||
| Export Market Analysis (Export Value, Volume, and Key Destination Markets) | |||
| Wholesale Price Trend Analysis and Forecast | |||
| Regulatory Framework | |||
| List of Key Players | |||
| Logistics and Infrastructure | |||
| Seasonality Analysis | |||
| Colombia | Production Analysis (Area Harvested, Yield, and Production Volume) | ||
| Consumption Analysis (Consumption Value and Volume) | |||
| Import Market Analysis (Import Value, Volume, and Key Supplying Markets) | |||
| Export Market Analysis (Export Value, Volume, and Key Destination Markets) | |||
| Wholesale Price Trend Analysis and Forecast | |||
| Regulatory Framework | |||
| List of Key Players | |||
| Logistics and Infrastructure | |||
| Seasonality Analysis | |||
| Peru | Production Analysis (Area Harvested, Yield, and Production Volume) | ||
| Consumption Analysis (Consumption Value and Volume) | |||
| Import Market Analysis (Import Value, Volume, and Key Supplying Markets) | |||
| Export Market Analysis (Export Value, Volume, and Key Destination Markets) | |||
| Wholesale Price Trend Analysis and Forecast | |||
| Regulatory Framework | |||
| List of Key Players | |||
| Logistics and Infrastructure | |||
| Seasonality Analysis | |||
| Middle East | Turkey | Production Analysis (Area Harvested, Yield, and Production Volume) | |
| Consumption Analysis (Consumption Value and Volume) | |||
| Import Market Analysis (Import Value, Volume, and Key Supplying Markets) | |||
| Export Market Analysis (Export Value, Volume, and Key Destination Markets) | |||
| Wholesale Price Trend Analysis and Forecast | |||
| Regulatory Framework | |||
| List of Key Players | |||
| Logistics and Infrastructure | |||
| Seasonality Analysis | |||
| Saudi Arabia | Production Analysis (Area Harvested, Yield, and Production Volume) | ||
| Consumption Analysis (Consumption Value and Volume) | |||
| Import Market Analysis (Import Value, Volume, and Key Supplying Markets) | |||
| Export Market Analysis (Export Value, Volume, and Key Destination Markets) | |||
| Wholesale Price Trend Analysis and Forecast | |||
| Regulatory Framework | |||
| List of Key Players | |||
| Logistics and Infrastructure | |||
| Seasonality Analysis | |||
| Yemen | Production Analysis (Area Harvested, Yield, and Production Volume) | ||
| Consumption Analysis (Consumption Value and Volume) | |||
| Import Market Analysis (Import Value, Volume, and Key Supplying Markets) | |||
| Export Market Analysis (Export Value, Volume, and Key Destination Markets) | |||
| Wholesale Price Trend Analysis and Forecast | |||
| Regulatory Framework | |||
| List of Key Players | |||
| Logistics and Infrastructure | |||
| Seasonality Analysis | |||
| Africa | Ethiopia | Production Analysis (Area Harvested, Yield, and Production Volume) | |
| Consumption Analysis (Consumption Value and Volume) | |||
| Import Market Analysis (Import Value, Volume, and Key Supplying Markets) | |||
| Export Market Analysis (Export Value, Volume, and Key Destination Markets) | |||
| Wholesale Price Trend Analysis and Forecast | |||
| Regulatory Framework | |||
| List of Key Players | |||
| Logistics and Infrastructure | |||
| Seasonality Analysis | |||
| South Africa | Production Analysis (Area Harvested, Yield, and Production Volume) | ||
| Consumption Analysis (Consumption Value and Volume) | |||
| Import Market Analysis (Import Value, Volume, and Key Supplying Markets) | |||
| Export Market Analysis (Export Value, Volume, and Key Destination Markets) | |||
| Wholesale Price Trend Analysis and Forecast | |||
| Regulatory Framework | |||
| List of Key Players | |||
| Logistics and Infrastructure | |||
| Seasonality Analysis | |||
| Uganda | Production Analysis (Area Harvested, Yield, and Production Volume) | ||
| Consumption Analysis (Consumption Value and Volume) | |||
| Import Market Analysis (Import Value, Volume, and Key Supplying Markets) | |||
| Export Market Analysis (Export Value, Volume, and Key Destination Markets) | |||
| Wholesale Price Trend Analysis and Forecast | |||
| Regulatory Framework | |||
| List of Key Players | |||
| Logistics and Infrastructure | |||
| Seasonality Analysis | |||


Key Questions Answered in the Report
How large is the raw coffee beans market size to be by 2031?
The raw coffee beans market was valued at USD 34.20 billion in 2025 and is forecast to reach USD 47.29 billion by 2031.
Which region is growing fastest in coffee consumption?
Asia-Pacific is the fastest-growing consumption region, with a forecast CAGR of 6.2% through 2026 to 2031, supported by rising demand in China and Vietnam.
How is the European Union deforestation rule affecting coffee trade?
The rule is raising traceability and geolocation costs, especially for smallholder-heavy origins, which may shift Europe Union buying toward more compliance-ready suppliers.
Which companies are most influential in global coffee trading?
Neumann Kaffee Gruppe, Louis Dreyfus Company, Sucafina, ECOM Agroindustrial, and ofi remain the most influential top-tier traders, supported by scale, finance, and compliance systems.
Page last updated on:


