
Coffee Market Analysis by Mordor Intelligence
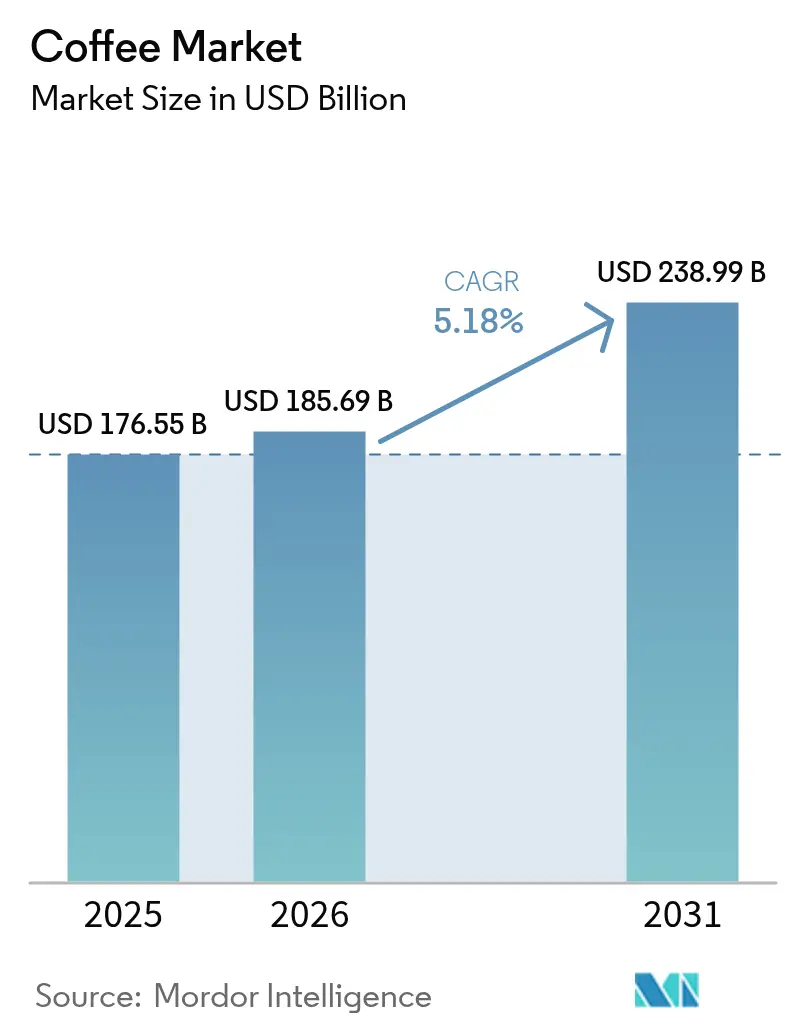
The coffee market size is estimated at USD 185.7 billion in 2026 and is projected to be USD 195.3 billion in 2027, reaching USD 247.7 billion by 2032, growing at a CAGR of 4.87% from 2027 to 2032. The coffee market volume is estimated at 11.03 million tonnes in 2026 and is projected to be 11.2 million tonnes in 2027, reaching 12.07 million tonnes by 2032, growing at a CAGR of 1.5% from 2027 to 2032.
Specialty and ready-to-drink (RTD) demand in the United States supports differentiated coffee propositions. Brands can combine retail access with convenient coffee-service ordering. Trading around New York's July options and futures deadlines drove a global coffee-price spike beginning in early June 2026. That volatility and traceability costs make dependable sourcing important to translating differentiated coffee demand into sales.
Key Report Takeaways
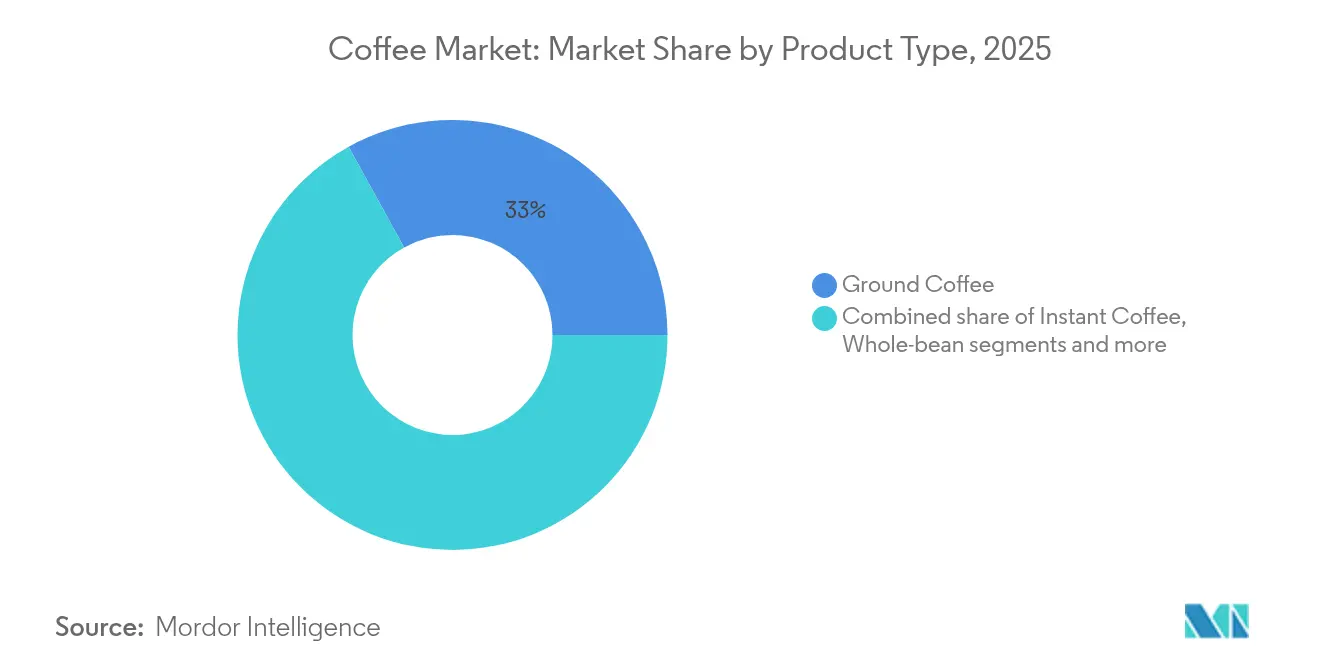
- By product type, ground coffee held a 32.76% coffee market share in 2026, while RTD coffee is forecast to grow fastest at a CAGR of 7.2% from 2027 to 2032.
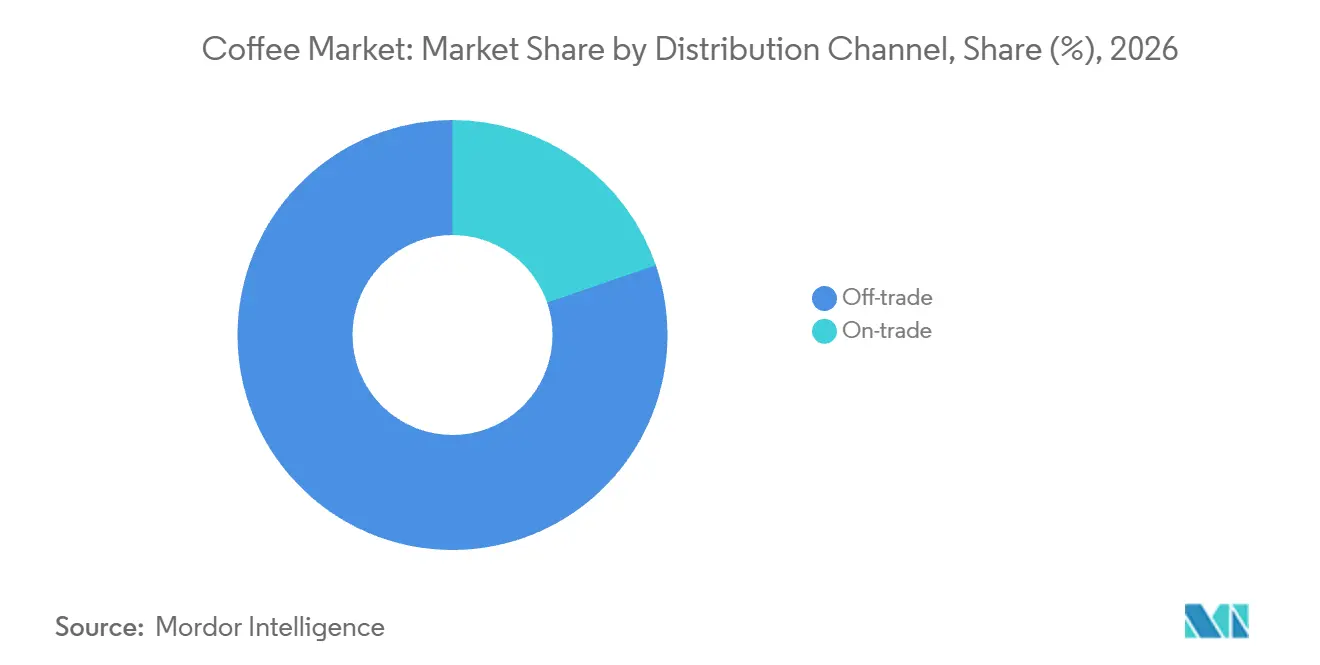
- Across distribution channels, off-trade accounted for an 80.26% share of the coffee market size in 2026, and on-trade is projected to lead growth at a CAGR of 5.74% from 2027 to 2032.
- Arabica was the leading coffee species with a 56.48% share in 2026, whereas Robusta is forecast to grow fastest at a CAGR of 5.68% from 2027 to 2032.
- Mixed coffee topped the origin breakdown with a 79.56% share in 2026, with single-origin and specialty coffee growing fastest at a projected CAGR of 6.58% from 2027 to 2032.
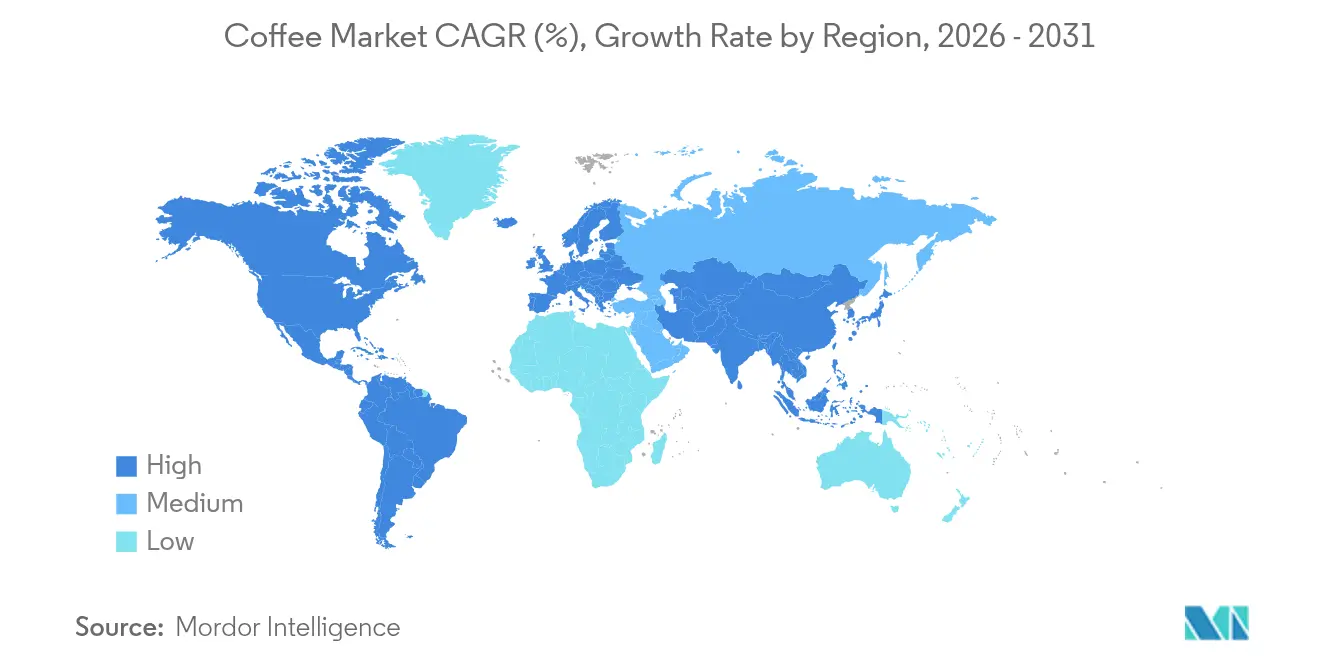
- Geographically, North America led with a 23.62% share in 2026, while Middle East and Africa is projected to grow fastest at a CAGR of 7.8% from 2027 to 2032.
Note: Market numbers in this report are based on Mordor Intelligence's proprietary estimation framework, which combines nine months of actuals with Q4 projections for base year 2026.
Market Trends and Insights
Drivers Impact Analysis of Coffee Market*
| Driver | (~) % Impact on CAGR Forecast | Geographic Relevance | Impact Timeline |
|---|---|---|---|
| Rising demand for specialty and premium coffee | +2.1% | The United States | Medium term (2-4 years) |
| Growing coffee culture among millennials and Gen Z | +1.4% | The United States | Long term (≥ 4 years) |
| Booming RTD/cold-brew consumption | +1.8% | United States and Canada | Short term (≤ 2 years) |
| Sustainability and ethical sourcing awareness | +0.9% | Brazil and Kenya | Long term (≥ 4 years) |
| Corporate and workplace coffee solutions | +0.7% | The United States | Medium term (2-4 years) |
| Influence of social media and influencer marketing | +0.3% | Garut and Bogor Regency | Short term (≤ 2 years) |
| Source: Mordor Intelligence | |||
Rising demand for specialty and premium coffee
Specialty demand expands the commercial role of coffee preparation, because an espresso-based drink can carry a distinct proposition beyond the underlying beans. In June 2026, 47% of U.S. adults had an espresso-based beverage in the past week, up 17.5% since 2022.[1] Espresso-based beverages included lattes, cappuccinos and caffè mochas. An established audience for this preparation family gives roasters a reason to develop coffee propositions around the drinks cafés serve. Café operators can therefore make repeatable beverage execution part of the specialty investment case, with roasting and preparation serving the same drink proposition.
Growing coffee culture among millennials and Gen Z
Younger adults provide an established audience for specialty coffee, giving suppliers a basis for age-specific product positioning. In the spring 2026 U.S. survey, collected January 5 to 20, 69% of adults aged 25 to 39 had specialty coffee in the past week. The corresponding figure for adults aged 18 to 24 was 50%. This contrast separates a majority-participation specialty audience from an age band evenly divided on past-week use. Adults aged 25 to 39 consequently offer the broader demonstrated starting audience for a specialty supplier choosing an initial proposition for one of these 2 age groups.
Booming RTD/cold-brew consumption
Cold coffee creates separate commercial openings in packaged drinks and prepared foodservice beverages. In the United States, 19% of past-day coffee drinkers had ready-to-drink coffee in fall 2025, up from 9% in 2021. Canadian iced and cold-brew coffee represented 16% of foodservice coffee servings in the 12 months ending August 2025, with servings up 13% year over year. The Canadian increase gives operators a volume-based reason to develop cold offerings alongside their other coffee drinks. Broader U.S. participation gives packaged-coffee suppliers a distinct reason to pursue RTD consumers. These opportunities favor format-specific expansion, because a packaged-drink proposition and a foodservice serving address different routes to the customer.
Sustainability and ethical sourcing awareness
Sustainability-oriented procurement creates a demand route for coffee distinguished by agricultural practices alongside beverage characteristics. In 2025, NESCAFÉ sourced 53% of its green coffee from farmers adopting regenerative agriculture practices. The Global Coffee Platform's 2025-2026 Kenya mid-program update reported that 8,306 farmers had been trained. That program aimed to strengthen coffee farmers' livelihoods and climate resilience while expanding access to extension services. These examples identify both a coffee buyer's sourcing preference and the practical capabilities needed to support sustainable production. A sourcing proposition built on farming practices therefore needs both a buyer-facing coffee offer and a practical route for growers to develop those practices.
Restraints Impact Analysis of Coffee Market*
| Restraint | (~) % Impact on CAGR Forecast | Geographic Relevance | Impact Timeline |
|---|---|---|---|
| Volatility in coffee bean prices | -1% | United States and Brazil | Short term (≤ 2 years) |
| Tariffs and European Union Deforestation Regulation barriers | -0.8% | United States, Brazil, Vietnam, Indonesia and European Union | Medium term (2-4 years) |
| Regulatory pressure and import/export restrictions | -0.3% | Brazil and Japan | Long term (≥ 4 years) |
| Consumer concerns over caffeine and health risks | -0.2% | Japan and United Kingdom | Short term (≤ 2 years) |
| Source: Mordor Intelligence | |||
Volatility in coffee bean prices
Trading around New York's July options and futures deadlines drove a global coffee-price spike beginning in early June 2026. In July, Expana analyst Oliver Broster described his impression that high prices and an anticipated large Brazilian crop discouraged small and medium roasters from securing future supply through futures contracts. As the July deadline approached, the roasters entered the market to fix contracts. For roasters, postponing coverage can concentrate purchasing into a deadline even when prices discourage longer commitments. In fiscal 2025, Starbucks used forward, futures and collar contracts to hedge “C” price exposure under price-to-be-fixed green-coffee contracts and forecast demand without fixed-price or price-to-be-fixed purchasing commitments. The remaining commercial constraint is the cost of committing to supply when contract timing leaves little freedom to defer.
Tariffs and European Union Deforestation Regulation barriers
From August to November 2025, Brazilian coffee exports to the United States fell 54.9% from 2,917,000 to 1,315,000 bags compared with the same 4 months of 2024. Cecafé dates the tariff period from August 6 to November 21, 2025, with relief retroactive to November 13. That episode illustrates a disruption in a specific origin-destination trading relationship. The European Union Deforestation Regulation (EUDR) will require covered coffee products to be deforestation-free from December 30, 2026, with most micro and small operators' duties starting June 30, 2027. By May 2026, coffee producers had spent 2 years investing in green-coffee geolocation, with regulatory changes adding cost. Suppliers therefore face both the risk of interrupted trade and the cost of preparing traceability before the applicable European market-access deadline.
*Our forecasts treat driver/restraint impacts as directional, not additive. The impact forecasts reflect baseline growth, mix effects, and variable interactions.
Coffee Market Segment Analysis
By Product Type:
Processing Scale and Retail Access Shape Format CompetitionGround coffee accounted for a 32.76% share of the coffee market size in 2026. Highlands inaugurated its first Vietnamese coffee roasting and grinding factory on April 15, 2025, for roasted and ground products serving domestic and export markets. The largest segment's supply base can therefore include combined roasting and grinding investments serving domestic and export outlets. Ground-coffee expansion can consequently depend on building domestic and export outlets for the same processing base, so added factory capability has more than one commercial destination.
Ready-to-drink (RTD) coffee is the fastest-growing segment, with a projected CAGR of 7.2% from 2027 to 2032. Black Rifle Coffee Company reported sales-weighted U.S. single-serve RTD distribution of 52.4% in the 4 weeks ending June 27, 2026, versus 53.4% a year earlier. Nielsen's category included Monster-Java, and the measure weighted distribution by total store sales across tracked retail and convenience channels. The decline makes distribution execution a constraint within the growth case even where the brand has a substantial retail presence. RTD brands can pursue more purchases within their existing reach while treating additional distribution as a separate commercial objective.

By Distribution Channel:
Household Access and Ordering Convenience Support Different ModelsOff-trade was the largest segment, with an 80.26% share in 2026. Grocery stores were the leading U.S. channel for coffee purchases for in-home preparation in June 2026. This provides a concrete household-purchasing route through which packaged-coffee suppliers can reach buyers outside a dedicated coffee-service setting. For those suppliers, retail access and the proposition for preparation at home belong to the same commercial decision, since the outlet brings the coffee into the household. Grocery access is consequently a route to the at-home customer relationship, giving packaged-coffee brands a way to serve consumption without owning the preparation venue.
On-trade is the fastest-growing segment, with a projected CAGR of 5.74% from 2027 to 2032. In June 2026, 38% of U.S. past-day coffee drinkers consumed coffee out of home, the highest level since January 2020. Among U.S. past-week out-of-home coffee buyers, 55% ordered at a drive-through and a record 40% ordered through an app in June 2026. Those pathways make access to the prepared drink part of the service proposition, connecting coffee demand with how the order reaches the operator. The expansion opportunity for operators includes convenient ordering alongside the beverage itself, so an additional café counter is only one possible way to serve that audience.
By Coffee Species:
Arabica Supply Scale Meets Robusta Blending EconomicsArabica represented a 56.48% coffee market share in 2026. Brazil's September 2026 estimate put its Arabica harvest at 48.2 million bags, up 34.8% from 2025, with 99% of the country's total coffee area harvested.[2] The largest segment's greater estimated crop volume can support larger origin-specific sourcing programs, tying commercial availability to a substantial producing-country base. The advanced harvest stage also gives procurement teams a more concrete supply reference than an estimate made before most harvesting takes place. Harvest progress gives Arabica-focused roasters a firmer basis for origin-specific commitments, linking a substantial crop estimate with extensive completed harvesting across Brazil's coffee area.
Robusta is the fastest-growing segment, with a projected CAGR of 5.68% from 2027 to 2032. Global Robusta export volume rose 10.7% from October 2025 through August 2026 compared with the same months a year earlier. A 2025 USDA report identified a separate incentive in Brazil, where the Arabica-Robusta price gap could prompt industries to use more Robusta in blends to reduce costs. That conditional blending incentive gives coffee processors a potential formulation response to relative bean costs, alongside the substantial activity in traded Robusta. The growth case consequently combines an active cross-border supply route with a specific cost-sensitive application in Brazilian coffee blends.
By Origin:
Mixed Coffee Serves Affordability While Specialty Broadens Its AudienceMixed-origin coffee was the largest segment, with a 79.56% share in 2026. In its 2025 semiannual report, USDA described most Colombian households as preferring soluble coffee and affordable blends, which often combined coffee with other origins such as Brazil. This country-level preference gives blenders a customer-facing use for mixed-origin sourcing, connecting different coffee origins to an affordable household product. For manufacturers serving those households, an additional origin is commercially useful when it helps sustain the finished blend's price proposition and suitability for consumption at home.
Single origin/specialty is the fastest-growing segment, with a projected CAGR of 6.58% from 2027 to 2032. In June 2026, 48% of U.S. adults had specialty coffee in the past day, a new record. At the September 2026 Best of Panama auction, JD.com of China bought Lamastus Family Estates' Elida Geisha Torre lot for USD 18,004 per kilogram.[3] The transaction shows how a named estate and lot can form the unit of an international specialty-coffee purchase. Preserving that identity can make differentiation commercially actionable across borders, linking the origin proposition to a specific buyer and a completed coffee transaction.
Geography Analysis
North America Coffee Market
North America held a 23.62% coffee market share in 2026, making it the largest geography. USDA estimated U.S. domestic coffee consumption at 25.55 million 60-kilogram bags and Canadian consumption at 5.05 million bags on the same basis in marketing year 2025/26. Separately, 66% of U.S. adults had coffee in the past day in June 2026, indicating a broad consumer base alongside substantial national consumption volumes. North American suppliers therefore have room to build differentiated coffee propositions inside a broad established demand base, alongside the task of serving substantial consumption in 2 national markets.
Middle East and Africa Coffee Market
Middle East and Africa is the fastest-growing geography, with a projected CAGR of 7.8% from 2027 to 2032. Saudi Arabia imported USD 235.3 million of roasted, non-decaffeinated coffee in 2025, establishing a substantial country-level route for finished roasted products. In October 2025, Nonda Coffee, a brand of Nonda Commodities Limited in Uganda, launched a single-origin coffee café in Riyadh. The opening illustrates how an African producer-country brand can create a direct coffee-service foothold within another country in the region, bringing origin identity into the customer offer. For regional coffee suppliers, growth can therefore be pursued through both established import channels and origin-branded retail service, with the route chosen shaping how the coffee reaches its final buyer.
Across the remaining regions, local product preferences and processing roles create different coffee opportunities. In South America, Peru's domestic consumption was estimated at 305,000 60-kilogram bags for 2026/27, including 230,000 bags of soluble coffee and 75,000 bags of roasted and ground coffee. European companies import green coffee for local roasting, while Swiss consumption was approximately 9 kilograms per person on a green-coffee basis in 2025. In Asia-Pacific, Vietnamese consumers show a home-brewing trend involving high-quality and specialty coffee, including premium Robusta and Arabica. These distinctions give suppliers separate commercial tasks, from serving Peru's soluble-coffee demand to reaching European roasters and Vietnamese households seeking differentiated coffee for preparation at home.
Regulatory Framework and Outlook
This comparison of selected jurisdictions assesses requirements for a packaged-coffee supplier selling through local importers. Product-specific labeling and general food-import requirements create different commercial tasks, from admitting a coffee product to determining what its retail package must say. The UAE column concerns qualifying packaged RTD coffee with added sugar or other sweeteners under the excise decision's product definition. Beverages containing at least 75% milk or milk substitutes and drinks prepared and served in open, unsealed containers for direct consumption in restaurants or similar establishments are excluded, alongside other statutory categories.
Regulatory Table of Coffee Market
| Decision factor | United States | Brazil | Germany | Japan | United Arab Emirates |
|---|---|---|---|---|---|
| Primary authority | Food and Drug Administration (FDA) | Ministry of Agriculture and Livestock (MAPA) | Federal Office for Agriculture and Food (BLE) | Ministry of Health, Labour and Welfare | Federal Tax Authority, with Ministry of Industry and Advanced Technology certification |
| Key instruments or direction | Foreign supplier verification program (FSVP), 21 CFR Part 1, Subpart L | Portaria SDA 570/2022 for roasted coffee | EU Regulation 2023/1115 and soluble-coffee scope addition under Regulation 2026/2102 | Food Sanitation Act Article 27 and FY2026 monitoring plan | Cabinet Decision 197 of 2025 and qualifying sweetened-drink certification |
| Commercial effect | Covered importers maintain food-specific verification programs, subject to exemptions | Roasted-coffee product, species and roast disclosures | Due-diligence declarations for covered coffee products | Notification for each sale or business-use import before sale | Accredited testing and certificate submission during qualifying product registration |
| Current policy attractiveness | Medium | High | Medium | Medium | Medium |
| Future direction of policy attractiveness | Hardening | No change | Hardening | No change | Hardening |
| Source: Mordor Intelligence | |||||
In the United States, FDA's June 16, 2026 withdrawal of temporary COVID-related supplier-audit guidance reduced enforcement flexibility within the underlying risk-based regime. Germany faces added soluble-coffee coverage from December 30, 2027, while Brazil's March 2026 FAQ reaffirmed existing roasted-coffee labels with grind information optional. Japan's FY2026 monitoring plan continued notification and conformity checks, providing a positive continuity basis. The UAE's certificate requirement took effect January 1, 2026, making documented laboratory evidence commercially important because missing certification triggers high-sugar classification until a report establishes otherwise.
Value Chain Stages
Coffee value capture differs across green-coffee processing, branded manufacturing and retail access. In 2025, JDE Peet's sourced approximately 8% of the world's coffee for its manufacturing facilities. At December 31, 2025, it operated more than 700 coffee stores across multiple markets through brands including Peet's, OldTown and Campos. This combination illustrates how a coffee business can participate in both upstream purchasing and the final customer relationship, with different earnings mechanisms at each stage.
Value Chain Analysis Table of Coffee Market
| Primary activity | Key participants | Value capture | Bottleneck | Resilience response |
|---|---|---|---|---|
| Green-coffee processing and storage | Green-coffee merchants and processors such as Louis Dreyfus Company | Processed green-coffee sales | Matching storage capacity with processing throughput | Balance storage expansion with processing capacity |
| Branded coffee production and distribution | Branded-coffee manufacturers such as Starbucks Corporation and JDE Peet's, and packaged-coffee distributors such as Nestlé SA | Branded coffee product sales | Maintaining the coffee proposition across retail and foodservice channels | Coordinate product specifications with each channel's offering |
| Retail service and licensing | Coffee retailers such as JDE Peet's and retail licensors such as Starbucks Corporation | Coffee sales, branded-supply margins and retail royalties | Coordinating branded supply with independently operated stores | Align product supply and licensee service execution |
| Source: Mordor Intelligence | ||||
In July 2025, Louis Dreyfus Company opened its expanded Varginha facility in Brazil, with processing capacity set to reach 2.5 million 60-kilogram bags annually and storage increased to about 1 million bags. Additional storage can give a merchant more flexibility to schedule processing and dispatch. In fiscal 2025, Starbucks received branded-product and supply margins from licensed-store operators alongside royalties on their retail sales. That downstream model can support repeat coffee sales through additional operators while retaining an earnings stream linked to the brand.
Competitive Landscape
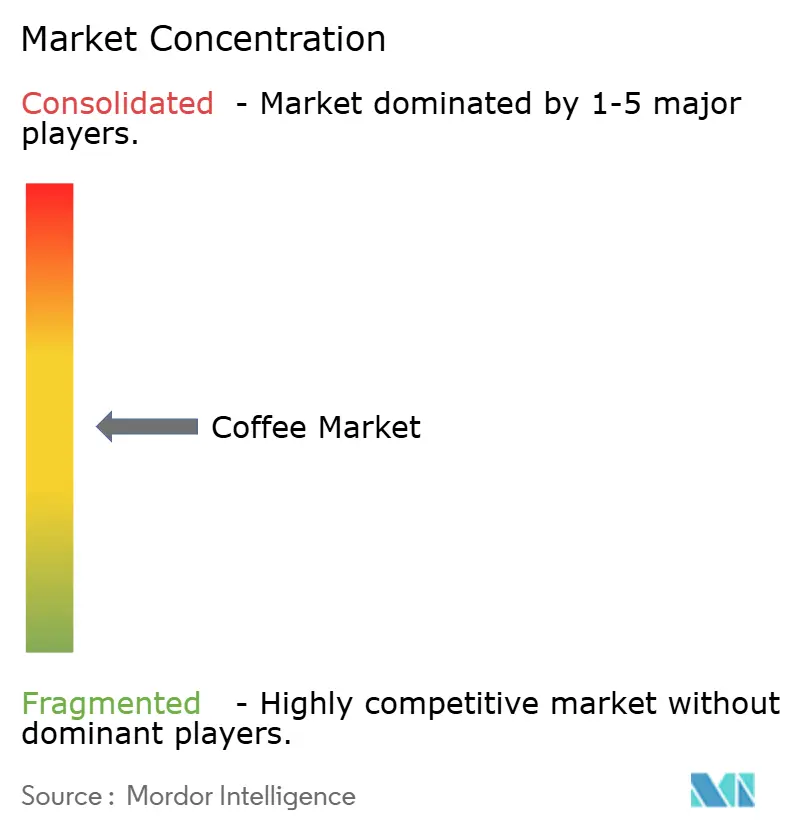
A moderately concentrated field brings Nestlé SA and Luigi Lavazza S.p.A. into competition through branded coffee businesses. The Kraft Heinz Company and The J. M. Smucker Company overlap in mainstream U.S. roast-and-ground coffee through Maxwell House and Yuban against Folgers and Café Bustelo. Starbucks Corporation adds a coffeehouse-led model alongside its licensed channels. Smucker's U.S. Retail Coffee net sales reached USD 807.8 million in the quarter ended July 31, 2026, with pricing contributing 10 percentage points to year-over-year net sales growth and volume/mix 2 points. These routes to customers give large coffee suppliers several ways to compete, making a common industry presence compatible with distinct retail and service propositions.
In August 2026, Kraft Heinz said it was spending to defend Maxwell House's share, framing its coffee investment as a hold-share objective. Lavazza launched its Tablì capsule-free, single-serve coffee system in the UK from September 2026, exclusively at John Lewis, with coffee tabs made without coating or binders. A dedicated brewing system makes the coffee-tab offer a linked product proposition, so the commercial task includes establishing repeat purchases of the coffee tabs. Share-defense spending and a new coffee format consequently address different competitive needs, with one centered on an established brand and the other on a distinct preparation system.
Regulatory positioning adds another competitive requirement for coffee destined for the European Union. Scheduled EUDR obligations make deforestation-free production and production-country legality relevant to access for covered coffee products. For an EU-facing supplier, product differentiation therefore has to be supported by coffee that can satisfy the relevant origin-evidence requirement. A challenger can pair a clearly defined coffee format with a supplier base capable of supporting those records, addressing both the consumer offer and the operator's access decision. The resulting competitive opening lies in joining a distinct coffee proposition with verifiable sourcing, so the branded offer can be sold through the intended destination's channels.
Coffee Industry Leaders
-
Nestlé SA
-
Luigi Lavazza S.p.A.
-
The Kraft Heinz Company
-
The J. M. Smucker Company
-
Starbucks Corporation
- *Disclaimer: Major Players sorted in no particular order
Coffee Market Companies Covered in this Report
- Nestlé SA
- UCC Ueshima Coffee Co.
- Starbucks Corporation
- The Kraft Heinz Company
- Luigi Lavazza S.p.A.
- Massimo Zanetti Beverage Group SpA
- The J. M. Smucker Company
- Tata Consumer Products
- Coava Coffee Roasters
- Tchibo GmbH
- Louis Dreyfus Company Coffee
- TGL Company
- Trung Nguyen Legend Group
- Mayora Group (Kopiko)
- The Coca-Cola Company
- Unilever PLC
- Zino Davidoff Group
- Sleepy Owl Coffee
- Bewley's Limited
- Strauss Group
Key Opportunities for Market Participants
Coffee sourcing opportunities differ in their buyer, enabling program and route to a repeatable coffee sale. A collective-action program for coffee farmers in Kenya and Uganda launched in 2025 with support from coffee companies and Germany's Federal Ministry for Economic Cooperation and Development. In November 2025, Starbucks Coffee Trading Company, SARL, and Tata Starbucks announced a Karnataka-based partnership targeting support for 10,000 Indian coffee farmers by 2030, including agronomy and coffee-quality training tools for 2026. These initiatives provide specific settings in which suppliers and buyers can develop coffee-supply propositions around farm-level capabilities.
Market Opportunities Table of Coffee Market
| Opportunity | Why now | Buyer / lead segment | Recommended play | Main barrier | Likely beneficiaries |
|---|---|---|---|---|---|
| Traceable coffee supply for EU access | Phased EU coffee traceability obligations are scheduled for 2026 and 2027 | Covered EU coffee operators | Organize coffee supply around production and legality records | Assembling the required production evidence | Prepared coffee exporters and covered EU operators |
| Coordinated coffee-supplier development in East Africa | Kenya-Uganda collective action launched in 2025 and was underway in 2026 | Participating coffee companies | Pool farm support around a defined coffee-sourcing objective | Coordinating a pre-competitive program | Participating companies and coffee-farming communities |
| Quality-focused Indian coffee supply | Karnataka-based farmer partnership targets support by 2030 | Indian coffee procurers and participating farmers | Link agronomy and coffee-quality work with sourcing specifications | Converting technical guidance into consistent coffee quality | Participating Indian farmers and coffee buyers |
| Source: Mordor Intelligence | |||||
The EU opportunity depends on satisfying a market-access condition, while the Indian partnership's quality focus offers a route to developing a differentiated coffee supply. Collective action in Kenya and Uganda provides another setting for coordinating supplier development across participating companies. The central opening is a coffee-supply relationship with an identifiable purchasing destination, so farm support and compliance preparation contribute to coffee that buyers intend to commercialize.
Recent Industry Developments in Coffee Market
- Sep 2026: Luigi Lavazza S.p.A. launched its Tablì single-serve coffee-tab system through John Lewis in the United Kingdom, with wider online sales scheduled from November 1, 2026.
- Apr 2026: Luckin Coffee began operating its Qingdao smart roasting center in China, adding roasting capability to the retail chain's integrated coffee supply operation.
- Mar 2026: Suntory Beverage & Food released Starbucks GRAB&GO brewed black, aroma latte and white mocha 500-milliliter bottled coffee drinks for exclusive sale through 7-Eleven in Japan on March 24.
Coffee Market Report Scope and Research Methodology
Market Definition and Coverage
The global coffee market measures annual spending on roasted coffee products and prepared coffee drinks worldwide. It covers purchases for consumption at home and away from home, valued in USD at the final customer sale.
Scope exclusions: Coffee brewing machines and equipment sold separately, coffee-flavored foods, and non-coffee beverages are excluded.
Segments Covered in This Report
- By Product Type
- Whole-bean
- Ground Coffee
- Instant Coffee
- Ready-to-Drink (RTD)
- Coffee Pod and Capsules
- By Distribution Channel
- On-trade
- Off-trade
- Supermarkets/Hypermarkets
- Convenience Stores
- Specialist Retailers
- Online Retail
- Other Off-trade Channels
- By Coffee Species
- Arabica
- Robusta
- Liberica
- Others
- By Origin
- Single Origin/Specialty
- Mixed
- By Geography
- North America
- United States
- Canada
- Mexico
- Rest of North America
- South America
- Brazil
- Colombia
- Argentina
- Rest of South America
- Europe
- Germany
- United Kingdom
- France
- Italy
- Spain
- Russia
- Netherlands
- Rest of Europe
- Asia-Pacific
- China
- Japan
- India
- South Korea
- Australia
- Indonesia
- Vietnam
- Malaysia
- Singapore
- Rest of Asia-Pacific
- Middle East and Africa
- United Arab Emirates
- Saudi Arabia
- Turkey
- South Africa
- Egypt
- Kuwait
- Ethiopia
- Rest of Middle East and Africa
- North America
Data Sources, Market Sizing, and Validation
Desk Research
Public sources such as the Food and Agriculture Organization (FAO) provide global production, trade and price context, while the International Coffee Organization (ICO) tracks coffee-year production, consumption, trade flows and prices. USDA Foreign Agricultural Service's Coffee: World Markets and Trade supplies country-level production, consumption, trade and stocks estimates, and UNdata's FAOSTAT series supports historical green-coffee production comparisons. These sources help analysts relate crop availability and trade flows to demand and the retail and foodservice coffee market.
Supplementary company filings, annual reports, investor materials and reputable business press can clarify product portfolios, channel exposure and price or mix changes for coffee producers, brands, retailers and foodservice operators. The named sources are not exhaustive and further sources inform collection, validation and clarification.
Primary Interviews and Surveys
Interviews and structured surveys with coffee roasters, packaged-coffee brand and retail leaders, foodservice operators, and coffee procurement specialists can clarify channel definitions, pricing, product mix and demand drivers. Respondents can review secondary-source assumptions and identify gaps in format, channel, species, origin and regional evidence. Analysts can resolve conflicting statements through targeted follow-up and compare responses with published consumption, trade and company disclosures.
Distribution of primary research fieldwork respondents
| Company type | Respondent position | Region |
|---|---|---|
| Top tier: 34% | CXOs: 20% | APAC: 38% |
| Mid tier: 43% | Functional/Unit leaders: 38% | EMEA: 33% |
| Smaller Players: 23% | Managers: 42% | Americas: 29% |
Market-Sizing & Forecasting
The model estimates global final-customer coffee spending from a top-down market view, then checks selected totals through supplier sales roll-ups and sampled retail or foodservice price times volume. Green-coffee production and trade, coffee consumption, channel sales, retail and menu prices, and product mix provide practical indicators. Supply and consumption anchor volume, while prices and mix connect physical demand to value. Evidence on product formats, on-trade and off-trade routes, species, origins and country demand supports segment shares, which are reconciled across each axis and geography. A multivariate regression can relate historical value and volume to these indicators, with scenario analysis for commodity-price, crop and channel shocks. Value and volume forecasts are built separately so price and mix effects remain visible. Where channel or country inputs are missing, analysts compare nearby years, use the closest documented regional or product evidence, and record a range for review. Coffee-sector specialists can check whether variable-level forecast paths reflect operating conditions and explain material gaps.
Data Validation & Update Cycle
Analysts triangulate market totals against independent production, consumption, trade, retail-price and company-sales signals, then investigate outliers and material variance across years, channels and segments before sign-off. A second analyst reviews source definitions, unit conversions, reconciliations and forecast drivers, and the team re-contacts relevant respondents when definitions conflict or a material input remains unclear. The model is refreshed annually, updated between cycles after material crop, price, trade or regulatory events, and given a fresh source and calculation review before delivery.
Mordor Intelligence's Coffee Market Size Measured Against Other Published Estimates
Published estimates can differ in the transactions and products they count and the inputs used to model demand. The global coffee market measures annual spending on roasted coffee products and prepared coffee drinks worldwide.
Key Gap Drivers include the study's defined coverage and market-specific modeling choices. Green-coffee production and trade, coffee consumption, channel sales, retail and menu prices, and product mix provide practical indicators.
Benchmark comparison
| Source | Market Size | Gaps in Research Methodology |
|---|---|---|
| Mordor Intelligence | Value: USD 195.3 B (2027) / Volume: 11.2 million tonnes (2027) | |
| Global Coffee Producer A | USD 125.7 B (2025) | The published global retail measure omits away-from-home coffee service sales included in this market. |
| Global Research Desk A | USD 147.42 B (2025) | The published at-home packaged-coffee measure excludes cafe service sales included in this market. |
Mordor Intelligence's analysts triangulate market totals against independent production, consumption, trade, retail-price and company-sales signals, then investigate outliers and material variance across years, channels and segments before sign-off.
Coffee Market Infographics


Key Questions Answered in the Report
What is the coffee market size and growth outlook?
The value is projected at USD 195.3 billion in 2027 and USD 247.7 billion by 2032, with a CAGR of 4.87% from 2027 to 2032.
What is encouraging coffee demand?
Specialty coffee and RTD adoption support demand, with 19% of U.S. past-day coffee drinkers consuming RTD coffee in fall 2025 versus 9% in 2021.
Which coffee product type leads sales value?
Ground coffee led with a 32.76% share in 2026, while RTD coffee is the fastest-growing segment at a projected CAGR of 7.2% from 2027 to 2032.
Which companies are major coffee competitors?
Major players include Nestlé SA, Luigi Lavazza S.p.A., The Kraft Heinz Company, The J. M. Smucker Company and Starbucks Corporation.
How do costs and compliance affect the coffee outlook?
Bean-price volatility and traceability work constrain suppliers. For covered coffee products, EUDR obligations begin December 30, 2026, for large and medium operators and June 30, 2027, for most micro and small operators.
Which regions lead coffee sales value and forecast growth?
North America held a 23.62% value share in 2026, while Middle East and Africa is projected to grow fastest at a CAGR of 7.8% from 2027 to 2032.