
Cloud Migration Services Market Size and Share
Market Overview
| Study Period | 2020 - 2031 |
|---|---|
| Market Size (2026) | USD 0.38 Trillion |
| Market Size (2031) | USD 1.3 Trillion |
| Growth Rate (2026 - 2031) | 27.68 % |
| Fastest Growing Market | Asia Pacific |
| Largest Market | North America |
| Market Concentration | Medium |
Major Players *Disclaimer: Major Players sorted in no particular order Image © Mordor Intelligence. Reuse requires attribution under CC BY 4.0. | |
Cloud Migration Services Market Analysis by Mordor Intelligence
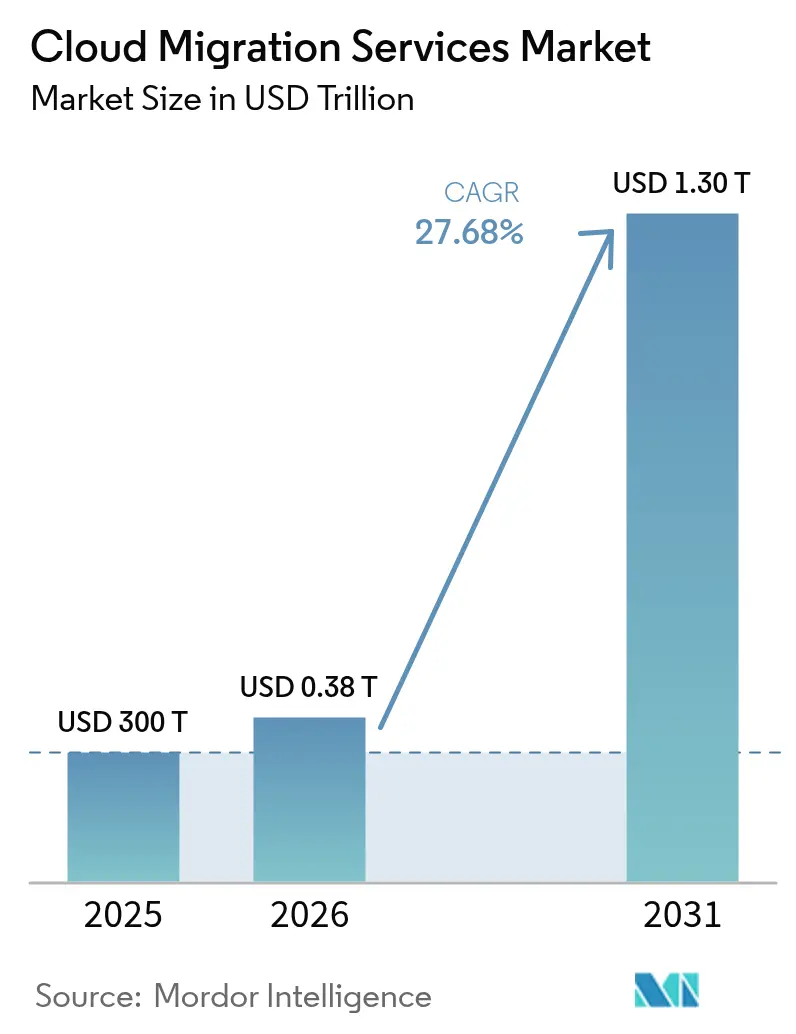
The cloud migration services market size was valued at USD 300 billion in 2025 and estimated to grow from USD 383.04 billion in 2026 to reach USD 1299.48 billion by 2031, at a CAGR of 27.68% during the forecast period (2026-2031). This rapid upside reflects how enterprises are shifting from capital-intensive on-premises assets toward scalable cloud environments that permit faster innovation cycles and superior cost control. Momentum is fueled by generative-AI workload acceleration, expanding hybrid strategies, and mounting Scope-3 carbon-reporting obligations that favor cloud-native architectures. Public cloud keeps its leadership position, yet hybrid patterns are gaining ground as firms work to balance performance with compliance and cost-optimization goals. Large enterprises remain the biggest spenders, but small and medium enterprises (SMEs) are closing the gap as automated migration toolchains lower technical barriers. Across industries, Banking, Financial Services and Insurance (BFSI) and Healthcare are pacing adoption, while hyperscale providers and niche specialists continue to broaden service portfolios amid vendor-lock-in and egress-fee concerns.
Key Report Takeaways
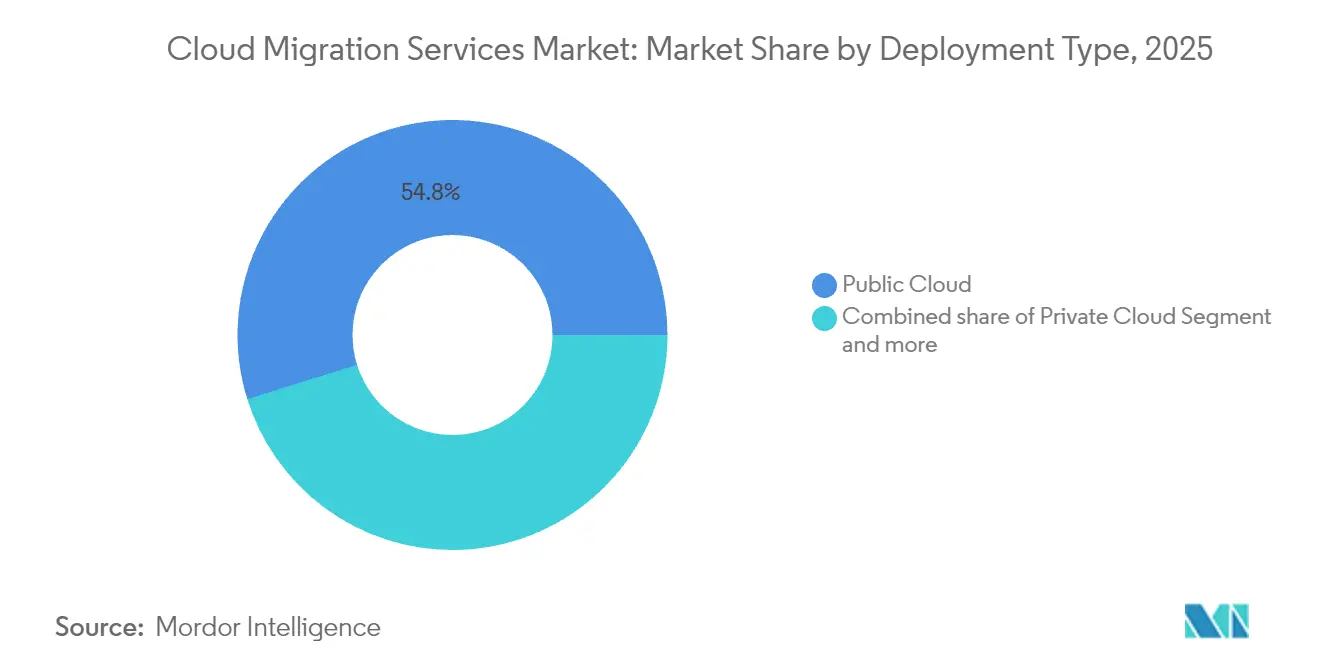
- By deployment type, public cloud retained 54.82% of cloud migration services market share in 2025, while hybrid cloud is projected to expand at an 18.35% CAGR to 2031.
- By enterprise size, large enterprises held 61.20% share of the cloud migration services market size in 2025; SMEs are advancing at an 17.65% CAGR through 2031.
- By service type, Software-as-a-Service led with 46.10% revenue share in 2025; Platform-as-a-Service is the fastest-growing at a 21.35% CAGR through 2031.
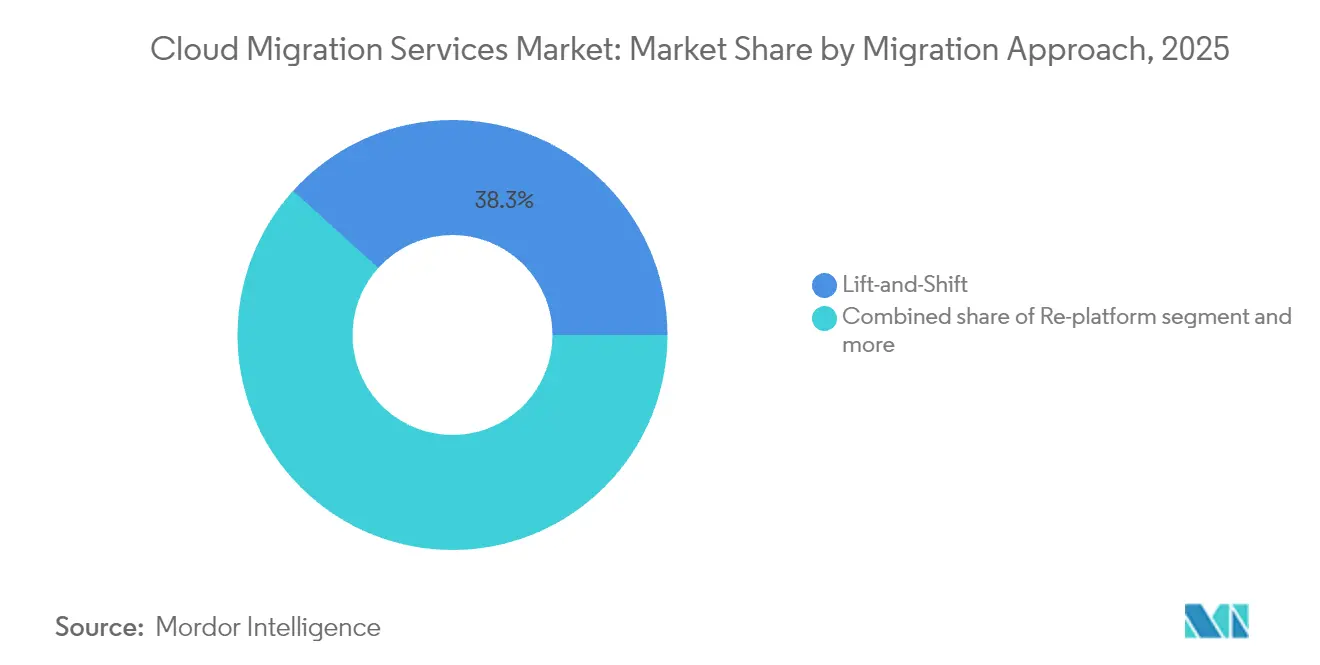
- By migration approach, lift-and-shift accounted for 38.30% of current activity in 2025, whereas refactor/re-architect strategies are climbing at a 22.35% CAGR to 2031.
- By end-user vertical, BFSI commanded 24.30% of cloud migration services market share in 2025; Healthcare and Life Sciences are forecast to grow at a 18.55% CAGR through 2031.
- By geography, North America captured 37.10% share in 2025; Asia-Pacific is set to register an 18.15% CAGR to 2031.
Note: Market size and forecast figures in this report are generated using Mordor Intelligence’s proprietary estimation framework, updated with the latest available data and insights as of 2026.
Global Cloud Migration Services Market Trends and Insights
Drivers Impact Analysis*
| Driver | (~) % Impact on CAGR Forecast | Geographic Relevance | Impact Timeline |
|---|---|---|---|
| Cost-efficiency and scalability advantages | +6.2% | Global | Medium term (2-4 years) |
| Rising remote-work and BYOD penetration | +4.8% | North America and Europe, expanding to Asia-Pacific | Short term (≤ 2 years) |
| Government digital-transformation funding | +3.1% | North America, Europe, select Asia-Pacific markets | Medium term (2-4 years) |
| Proliferation of hybrid / multi-cloud models | +2.9% | Global, concentrated in developed markets | Long term (≥ 4 years) |
| Generative-AI-driven refactoring | +1.7% | North America and Europe early adoption, Asia-Pacific following | Short term (≤ 2 years) |
| Scope-3 carbon-aware migrations | +1.2% | Europe leading, North America and Asia-Pacific adoption | Long term (≥ 4 years) |
| Source: Mordor Intelligence | |||
Cost-efficiency and Scalability Advantages of Cloud Adoption
Enterprises continue to realize 20-30% operational-expenditure savings after moving workloads to the cloud, primarily by eliminating capital-intensive hardware refresh cycles and right-sizing resources on demand. Infomart’s business-to-business platform migration to Oracle Cloud Infrastructure cut data-center costs by 38% while boosting performance flexibility. Elastic resource provisioning now allows organizations to handle unexpected demand spikes without the six-to-twelve-month procurement delays common in physical data-center environments. Budget freed from infrastructure upkeep is increasingly redirected toward innovation initiatives that sharpen competitive differentiation. These cumulative benefits give cost-rationalization strategies the highest positive impact on the forecast CAGR.
Rising Remote-work and BYOD Penetration
Hybrid work models have solidified, prompting organizations to migrate collaboration suites, identity services and security controls to the cloud to guarantee consistent user experiences across locations and devices. A recent survey shows 89% of IT leaders intend to raise cloud spending in 2025 to support distributed teams. BYOD complicates perimeter security, steering enterprises toward zero-trust architectures that are easier to enforce in cloud-native form. Consequently, migrations increasingly encompass secure access service edge, endpoint management and real-time analytics layers that maintain workforce productivity from any location. This trend exerts a strong, near-term pull on project pipelines, particularly in North America and Europe.
Government Digital-transformation Funding
Public-sector investment continues to underpin large-scale migrations. The United States allocated USD 8.3 billion in the 2024 federal IT budget specifically for cloud modernization. Similar initiatives in Alaska, Utah and Virginia offer reference architectures other jurisdictions emulate. European authorities are simultaneously financing sovereign-cloud programs to preserve data residency while capturing cloud efficiency gains. Budgets extend beyond compute contracts to encompass workforce reskilling, cyber-resilience and compliance frameworks, ensuring a consistent funding stream through the medium term.
Proliferation of Hybrid / Multi-cloud Strategies
Eighty-four percent of organizations now rely on hybrid or multi-cloud environments to optimize AI workload placement. This model lets firms keep latency-sensitive or regulated data close to users while exploiting hyperscale elasticity for analytics. Vendor diversification protects against lock-in and supports negotiation leverage, but multiplies management complexity. Demand therefore rises for service providers that can validate interoperability, automate policy enforcement and deliver observability across divergent platforms. As these expertise shortages persist, the driver’s impact extends into the long term.
Restraints Impact Analysis*
| Restraint | (~) % Impact on CAGR Forecast | Geographic Relevance | Impact Timeline |
|---|---|---|---|
| Data-security and regulatory-compliance risks | -3.4% | Global, heightened in Europe and regulated industries | Medium term (2-4 years) |
| Legacy-application complexity and interoperability | -2.1% | Global, concentrated in manufacturing and finance | Long term (≥ 4 years) |
| Escalating cloud egress fees | -1.8% | Global, affecting multi-cloud strategies | Short term (≤ 2 years) |
| Vendor lock-in amid sovereign-cloud mandates | -1.5% | Europe leading, expanding to Asia-Pacific and select North America | Medium term (2-4 years) |
| Source: Mordor Intelligence | |||
Data-security and Regulatory-compliance Risks
European firms struggle to reconcile General Data Protection Regulation (GDPR) stipulations with public-cloud service models, while global financial institutions juggle overlapping jurisdictional rules that rarely address cloud data flows explicitly. [1]Computing News Desk, “GDPR Challenges Slow Public-Cloud Adoption,” computing.co.uk The shared-responsibility model often blurs accountability for encryption, logging and incident response. In some cases, sovereign-cloud requirements force organizations to pay premiums for localized capacity or retain on-premises infrastructure, extending migration timelines. These factors temper growth across nearly every industry, especially healthcare, banking and government.
Legacy-application Complexity and Interoperability
Decades-old mainframe and monolithic applications require significant re-engineering before they can run economically in cloud environments. Japan Airlines migrated its mileage-program systems from an IBM mainframe to AWS in eight months using automated COBOL-to-Java tools, following a deep modernization effort. [2]TIS, “Japan Airlines Completes Mainframe Migration to AWS,” tis.co.jp Maintaining integrations between legacy and newly migrated workloads adds parallel-run complexity, sometimes leading to cost overruns. Skill shortages in both legacy platforms and cloud-native design further widen project risk, extending the restraint's drag well into the long term.
*Our forecasts treat driver/restraint impacts as directional, not additive. The impact forecasts reflect baseline growth, mix effects, and variable interactions.
Segment Analysis
By Deployment Type: Hybrid Configurations Drive Innovation
Hybrid deployments are the fastest riser, advancing at an 18.35% CAGR as enterprises balance low-latency on-premises demands with public-cloud scale. Public cloud still holds 54.82% cloud migration services market share due to the mature security posture of hyperscale providers. Edge-cloud integrations now push compute closer to the user while maintaining elastic backend analytics connectivity, signaling that future architectures will combine multiple execution venues within a single workflow. Migration specialists able to orchestrate workload placement across these nodes remain in high demand.
Enterprises no longer view deployment as a binary choice. Financial institutions position trading engines on private clusters for sub-millisecond latency while offloading regulatory reporting to cost-efficient public buckets. Healthcare groups process imaging data on-site, then route anonymized sets to AI pipelines in the cloud. These nuanced blueprints underline why hybrid options will keep expanding their footprint within the cloud migration services market.



By Enterprise Size: SMEs Accelerate Adoption
Large enterprises accounted for 61.20% of cloud migration services market size in 2025, reflecting multi-year transformation budgets and global rollouts. Yet SMEs exhibit an 17.65% CAGR, propelled by packaged migration toolchains that cut setup time and lower expertise thresholds. Cloud providers now segment offerings—white-glove consulting for Fortune 500 clients versus prescriptive templates for smaller firms—thereby widening addressable demand without eroding margins.
SMEs gravitate toward SaaS replacements and managed services to avoid staffing expensive in-house operations teams. Conversely, large entities pursue phased re-architecting across dozens of business units, often underpinned by center-of-excellence teams that codify governance and security blueprints. This bifurcation requires service vendors to maintain differentiated go-to-market motions tailored to each cohort’s budget cycles and compliance obligations.
By Service Type: PaaS Emerges as Growth Engine
Software-as-a-Service led 2025 revenue with a 46.10% slice, mirroring entrenched productivity and CRM platforms. Platform-as-a-Service, however, is projected to climb at a 21.35% CAGR through 2031 as developers pivot to containerization and microservices architectures. Infrastructure-as-a-Service remains foundational for lift-and-shift workloads that demand OS-level control.
The PaaS surge underscores a shift from infrastructure procurement to application lifecycle acceleration. Serverless functions, managed Kubernetes and automated CI/CD pipelines now form the baseline for modern app delivery. Migration engagements increasingly include code-refactoring to exploit these abstractions, shortening feature release cycles and curbing operating cost.
By Migration Approach: Refactoring Gains Strategic Priority
Lift-and-shift still represented 38.30% of project volume in 2025, favored by organizations needing quick data-center exits. Yet refactor and re-architect initiatives are expanding at a 22.35% CAGR as enterprises chase long-term efficiency. Re-platforming remains a compromise path when teams modify databases or middleware but leave core code intact. Replacement via SaaS continues to grow for commodity workflows such as HR or expense management.
Generative-AI-backed modernization platforms now parse millions of code lines to surface remediation tasks, drastically reducing manual effort during refactor journeys. NEC’s use of “cotomi” AI with SAP S/4HANA Cloud evidenced the acceleration potential of these toolchains. Over the forecast horizon, automated refactoring is expected to tilt budgets away from lift-and-shift toward cloud-native optimization.
By End-user Vertical: Healthcare Accelerates Digital Transformation
BFSI retained 24.30% of cloud migration services market size in 2025, reflecting tight regulatory deadlines and intense digital-channel competition. Healthcare and Life Sciences are the fastest movers, heading toward a 18.55% CAGR thanks to electronic health-record mandates and the expansion of telemedicine. Retail relies on cloud elasticity for peak-season traffic handling, while public sector agencies invest in secure citizen-service portals.
Manufacturers integrate IoT feeds with predictive asset maintenance models, demanding scalable analytics backends. Energy utilities connect distributed renewable assets to cloud control planes for real-time grid balancing. Each vertical faces unique compliance and integration tasks, prompting service providers to build industry-specific accelerators that flatten migration learning curves.
Geography Analysis
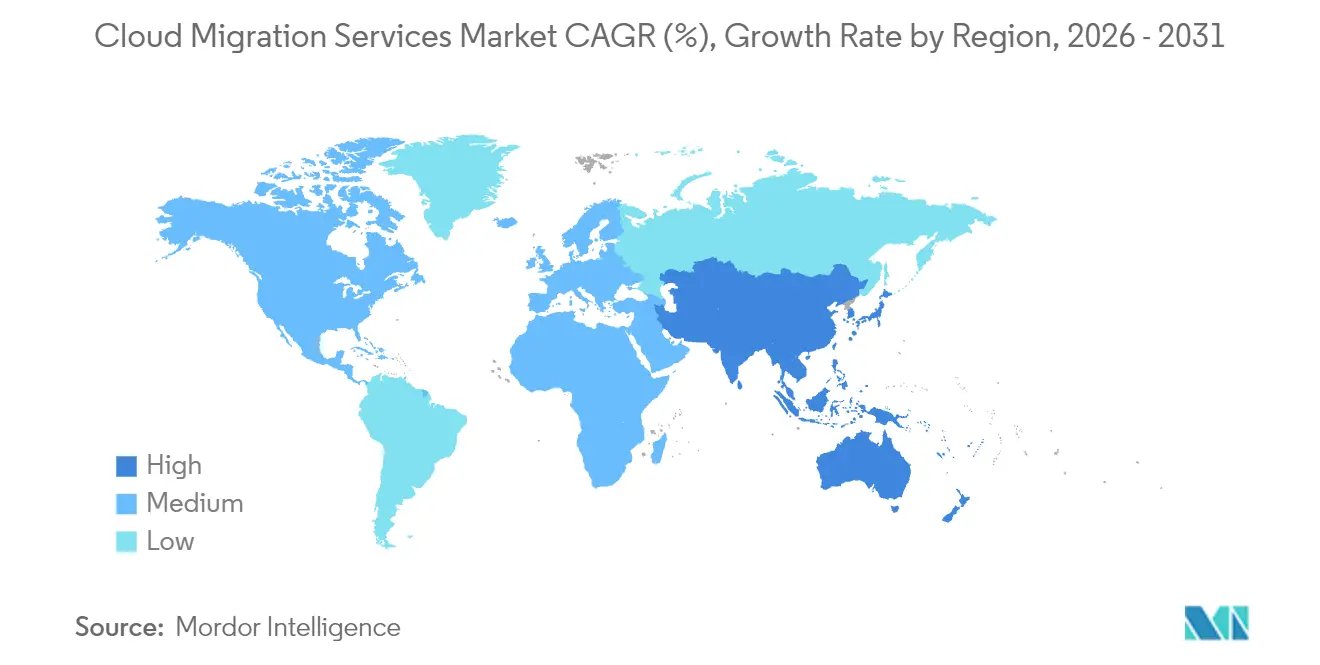
North America captured 37.10% of 2025 spend, anchored by early adopters that now focus on AI optimization and multi-cloud cost governance. The United States leads through federal cloud programs such as the USD 8.3 billion modernization budget, while Canada and Mexico leverage improved network backbones to accelerate adoption. Across the region, organizations are integrating predictive workload placement engines to refine consumption models and curb egress charges, reinforcing North America’s position at the core of the cloud migration services market.
Asia-Pacific is projected to post an 18.15% CAGR to 2031, propelled by state-level digital-transformation funds and hyperscaler investments. Microsoft earmarked USD 2.9 billion for data-center expansion in Japan, demonstrating confidence in Japan’s cloud trajectory. India is on course for a USD 25.5 billion cloud sector by 2028, reflecting widespread modernization across BFSI, retail and government. China’s domestic providers, supported by data-localization rules, continue to grow market share via tailored sovereign offerings. The region’s diverse regulatory landscape shapes a patchwork of hybrid and multi-cloud designs that migration firms must navigate.
Europe pairs steady growth with stringent data-sovereignty controls. Germany and the United Kingdom remain the largest adopters, yet France and Spain are championing sovereign-cloud frameworks that bolster domestic vendors. GDPR enforcement compels meticulous residency mapping and encryption governance across every project. Consequently, hybrid strategies dominate, allowing sensitive workloads to stay on national soil while analytics and AI tasks harness scalable regional nodes. This dynamic will keep Europe’s migration profile firmly tied to compliance-first architectures throughout the forecast period.

Regulatory Landscape
Cloud migration programs are increasingly shaped by security-by-design and data-sovereignty rules that affect where workloads can run and how they are operated under shared-responsibility models. In March 2026, NIST updated guidance for securing APIs in cloud-native systems (SP 800-228 update), reinforcing zero-trust-aligned controls around identity, runtime protection, and life-cycle risk management, which increases the compliance burden for migration projects that expose or modernize application interfaces.
Jurisdiction-specific sovereignty frameworks are also influencing procurement criteria and architecture choices for public cloud, hybrid, and sovereign deployments. In June 2026, the European Commission adopted the Proposal for the Cloud and AI Development Act (CADA), introducing an EU-wide assurance-level framework for cloud and AI sovereignty used in public procurement, while Nigeria issued its National Cloud Policy 2025 mandating a Cloud First approach for Federal Public Institutions and strengthening local data residency expectations through a Sovereign Cloud Governance Committee. Together, these updates are driving demand for regionally hosted cloud regions, auditable controls, and clearer contracting on data access, portability, and supplier assurances.
Value Chain Analysis
The cloud migration services value chain typically starts with advisory, discovery, and application portfolio rationalization, then moves into landing-zone and connectivity buildout, security and governance design, migration factory execution (data and application move), and post-migration optimization (FinOps, observability, resilience, and managed services). Delivery is anchored by hyperscalers (AWS, Microsoft Azure, Google Cloud, Oracle Cloud) and their partner ecosystems, where certifications and program tiers influence tool access, implementation patterns, and co-sell motions; global systems integrators (such as Accenture, Cognizant, Capgemini, HCLTech, Infosys, and TCS) and specialist boutiques execute migrations, modernization, and ongoing operations.
Key downstream dependencies include network and interconnection providers and tooling layers for data movement, infrastructure-as-code, and policy management, which affect cutover risk and timeline adherence. Evidence of execution friction remains visible in database modernization, where an August 2025 survey reported that 94% of database migration projects miss planned timelines, commonly tied to underestimated complexity and insufficient testing. On the enabling side, interconnection and data-transfer automation are becoming practical accelerators for multi-cloud programs, illustrated by Equinix Fabric Cloud Router being used to move 6.5 petabytes between clouds for Uber, supporting large-scale data mobility that underpins refactor and re-platform engagements.
Competitive Landscape
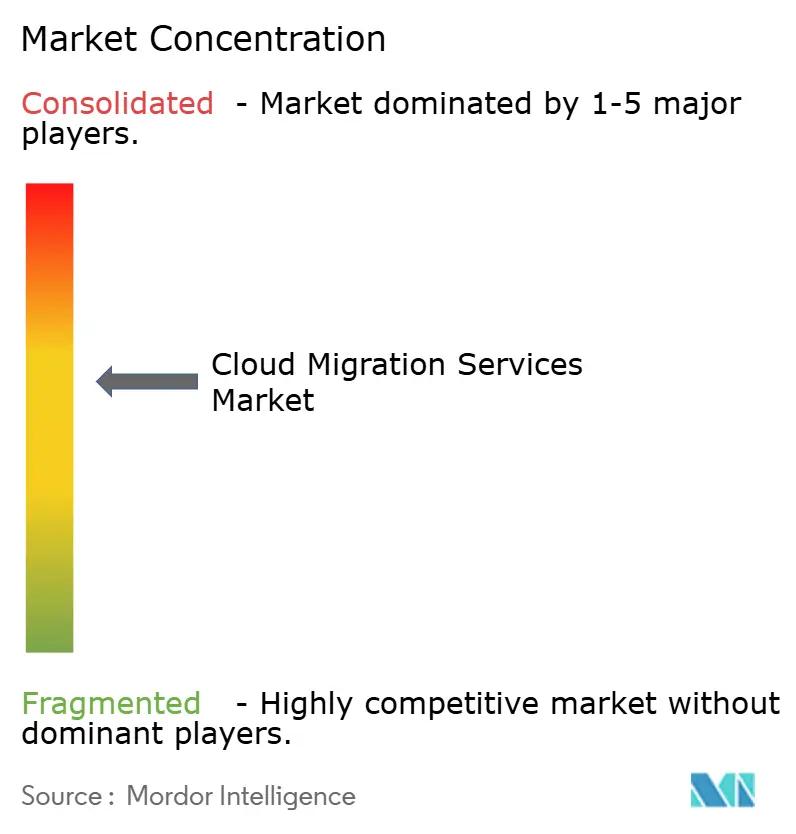
The market’s structural complexion is moderately fragmented. Amazon Web Services, Microsoft Azure and Google Cloud Platform constitute the backbone for most enterprise migrations, yet industry-specific integrators and boutique consultancies thrive by solving legacy and regulatory pain points. Oracle secured a cloud deal that could exceed USD 30 billion in annual revenue from fiscal 2028, signaling the scale of enterprise commitments. IBM’s USD 6.4 billion HashiCorp acquisition aims to enhance hybrid-cloud automation, while smaller players such as HYCU extend data-mobility platforms to blunt vendor-lock-in concerns.
Strategic themes coalesce around AI-powered refactoring, multi-cloud policy orchestration and edge-cloud convergence. Providers differentiate through automated code conversion, zero-trust security overlays and predictive cost-optimization engines. Specialized firms have carved defensible niches in mainframe modernization and healthcare compliance, areas where domain knowledge trumps raw scale. Price competition intensifies on generic lift-and-shift work, yet consultative engagements involving regulated workloads or heavy refactor commands premium margins.
M&A momentum is expected to persist as hyperscalers and global systems integrators acquire niche tooling to plug capability gaps and shorten time-to-value for large deals. At the same time, open-source frameworks for provisioning and policy management are lowering barriers for new entrants, ensuring the cloud migration services market remains competitive while gradually consolidating at the top tiers.
Cloud Migration Services Industry Leaders
Accenture plc
Amazon Web Services Inc.
Cisco Systems Inc.
Cognizant Technology Solutions Corporation
DXC Technology Company
- *Disclaimer: Major Players sorted in no particular order

Market Opportunities and Future Outlook
Enterprise modernization programs that combine migration with application refactoring and platform re-architecture represent a large near-term whitespace, since they go beyond infrastructure relocation alone. Public references from 2026 show the scale and complexity being addressed: Intesa Sanpaolo completed a migration of core IT systems to Google Cloud regions hosted in TIM data centers, shifting over 800 applications while decommissioning a similar number of physical systems, and Nokia, SAP, and Microsoft announced a multi-year program to migrate Nokia's core SAP ERP landscape to SAP S/4HANA on Microsoft Azure using RISE with SAP. These programs expand demand for migration factories that can standardize governance, data movement, testing, and cutover across hundreds of applications, while packaging industry controls for BFSI and other regulated verticals.
Opportunity is also growing around AI-assisted delivery and API-first modernization, where service providers are productizing repeatable capabilities to shorten time-to-migrate and improve quality. In February 2026, ISG highlighted telecom and media enterprises shifting toward cloud-native platforms, including OSS/BSS modernization and API-first architectures, with reported operational cost savings of 25 to 35 percent, supporting investment in migration-plus-modernization bundles that connect platform engineering, security, and operating-model change. Buyers are also backing automation-heavy approaches, including projects such as XLSMART and Tencent Cloud completing a 4.5-month transformation involving 1,200 microservices and 1,100 APIs, which creates room for providers that pair cloud landing zones, zero-trust controls, and program governance with measurable refactor throughput across microservices, APIs, and data pipelines.
Recent Industry Developments
- June 2026: Cognizant completed its acquisition of Astreya, expanding its AI-first managed services and IT operations capabilities. The deal adds scale in infrastructure and workplace operations that often follow cloud migration and post-migration managed service models, strengthening Cognizant's ability to run hybrid environments after large cutovers.
- May 2026: Accenture and AWS introduced three agentic AI solutions in AWS Marketplace focused on accelerating data transformation, migration, and governance. Packaging these capabilities as marketplace offerings supports repeatable delivery for both enterprise and mid-market customers while aligning modernization work with standardized controls.
- July 2025: Oracle announced a future cloud agreement forecast to deliver more than USD 30 billion annually, alongside reporting that its MultiCloud database revenue rose by over 100%. The size of the commitment signals continued expansion of large enterprise migrations and multi-cloud database deployments, increasing demand for implementation partners that can manage interoperability, governance, and data mobility across platforms.


Research Methodology Framework and Report Scope
Market Definition and Coverage
For this methodology, the cloud migration services market is counted as the revenue earned from professional services that plan, execute, and support the movement of applications, data, and workloads into a cloud environment, including cloud to cloud moves.
Scope exclusions: We exclude pure cloud hosting fees and standalone software license revenue when it is not sold as part of a migration service engagement.
Segmentation Overview
- By Deployment Type
- Public Cloud
- Private Cloud
- Hybrid Cloud
- Multi-Cloud
- By Enterprise Size
- Small and Medium Enterprises (SMEs)
- Large Enterprises
- By Service Type
- Infrastructure-as-a-Service (IaaS)
- Platform-as-a-Service (PaaS)
- Software-as-a-Service (SaaS)
- By Migration Approach
- Lift-and-Shift (Re-hosting)
- Re-platform
- Refactor / Re-architect
- Replace (SaaS Substitution)
- By End-user Vertical
- Banking, Financial Services and Insurance (BFSI)
- Healthcare and Life Sciences
- Retail and E-commerce
- Government and Public Sector
- IT and Telecommunication
- Manufacturing
- Energy and Utilities
- Others
- By Geography
- North America
- United States
- Canada
- Mexico
- South America
- Brazil
- Argentina
- Europe
- Germany
- United Kingdom
- France
- Russia
- Rest of Europe
- Asia-Pacific
- China
- India
- Japan
- South Korea
- Rest of Asia-Pacific
- Middle East and Africa
- Middle East
- Saudi Arabia
- UAE
- Turkey
- Africa
- South Africa
- Nigeria
- Middle East
- North America
Data Sources, Market Sizing, and Validation
Desk Research
Desk research is used to set the market context, the spend drivers, and the practical ranges for service pricing and project mix. We typically refer to public sources such as U.S. Bureau of Labor Statistics data for IT services employment trends, U.S. Census Bureau and OECD digital economy indicators, ITU connectivity statistics, and NIST and ISO publications that influence migration and security practices.
We also review sources such as SEC filings, annual reports, investor presentations, and reputable press releases to track vendor commentary around cloud programs, partner ecosystems, and pipeline conditions. In a few places, paid subscriptions are used to cross-check company financials, contract announcements, and patent activity linked to migration tooling and automation themes, which helps keep the assumptions aligned with what firms publicly signal. These examples are not exhaustive, and many other public and paid sources were also used for data collection, validation, and clarification.
Primary Interviews and Surveys
Primary work is used to pressure test what we see in desk research, especially where service scopes blur between migration, modernization, and managed operations. We speak with delivery leaders, solution architects, channel and partner contacts, and enterprise buyers across APAC, EMEA, and the Americas, then we reconcile differences in deal sizing, project duration, and cloud mix before finalizing the model.
Distribution of primary research fieldwork respondents
| Company type | Respondent position | Region |
|---|---|---|
| Top tier: 37% | CXOs: 12% | APAC: 51% |
| Mid tier: 48% | Functional/Unit leaders: 40% | EMEA: 30% |
| Smaller Players: 15% | Managers: 48% | Americas: 19% |
Market-Sizing & Forecasting
Sizing starts with a top-down build where enterprise cloud adoption and workload migration activity are reconstructed by region, and then translated into addressable service spend using penetration rates and typical engagement values. To keep the totals grounded, the output is corroborated with selective bottom-up checks, including sampled deal-size ranges by migration approach, partner channel checks on project volumes, and supplier roll ups for a limited set of visible service lines.
Key inputs that shape the model include the share of workloads moving from on-prem to cloud versus cloud to cloud, the mix of public, private, and hybrid deployments, typical migration waves by enterprise size, and the portion of projects that include refactor or re-architecture work rather than lift and shift. We also track service intensity signals such as security and compliance requirements, data gravity constraints, and the pace of application modernization, since these affect both effort hours and blended rates.
For forecasting, scenario analysis is used so optimistic and conservative paths can be tied back to what interviewees expect for cloud program budgets, hiring capacity, and project cycle times. Where bottom-up visibility is thinner in smaller geographies, gaps are handled through ratio-based allocations anchored to cloud spend indicators, then reviewed again with regional experts.
Data Validation & Update Cycle
Outputs are checked against independent signals such as cloud infrastructure spending direction, IT services labor trends, and the share of enterprises running hybrid environments, and then variances are investigated before sign-off. If a region or segment shows a jump that cannot be explained by adoption, pricing, or mix shifts, assumptions are revisited and the relevant interview set is re-contacted for clarification.
A multi-step analyst review is followed so that definitions, currency handling, and year mapping stay consistent across the model. Reports are refreshed annually, with interim updates when material events change spending behavior, and right before delivery a fresh pass is completed so clients receive the latest updated view.
Mordor Intelligence's Cloud Migration Services Market Size Versus Other Published Estimates
Published market sizes for cloud migration services often spread apart because firms count different activities under migration and they also use different base years, currencies, and growth paths. In our work, we try to keep the definition tied to real project delivery work, then we validate the numbers using interviews so the totals do not drift away from what buyers and providers see.
The main gap comes from scope expansion, where Mordor Intelligence counts cloud migration services as the full set of migration and related engagement revenues across regions, while some sources keep the market restricted to narrower service lines or only a subset of cloud platforms, which pulls their totals down.
Benchmark comparison
| Source | Market Size | Gaps in Research Methodology |
|---|---|---|
| Mordor Intelligence | USD 0.38 T (2026) | |
| Global Consultancy A | USD 20.67 B (2025) | Uses a smaller starting year and often reflects a tighter definition that can emphasize workload migration services while excluding adjacent modernization-heavy work and some cloud-to-cloud activity. |
| Industry Publisher B | USD 12.75 B (2025) | Base year and currency timing differ, and the scope described is typically narrower, which can undercount multi-year enterprise programs and the higher effort projects driven by compliance and complex data moves. |
The table shows that the spread is mainly explained by what is counted as migration work and which year is used for the starting point. By keeping assumptions tied to deployment mix, migration approach, and engagement sizing, our estimate stays traceable to clear demand drivers and can be repeated when new input data becomes available.


Key Questions Answered in the Report
What is the current value of the cloud migration services market?
The cloud migration services market size is USD 0.38 trillion in 2026 and is projected to climb to USD 1.30 trillion by 2031.
Which deployment model is growing fastest?
Hybrid cloud leads growth with an 18.35% CAGR through 2031 as enterprises align workload placement with latency, compliance and cost goals.
Why are SMEs increasingly adopting cloud migration services ?
Automated toolchains and tiered service models lower technical barriers and costs, enabling SMEs to capture enterprise-grade capabilities while fueling an 17.65% CAGR.
How do regulatory concerns restrain adoption?
Data-sovereignty mandates such as GDPR complicate compliance, forcing organizations to design hybrid or sovereign solutions that slow migration timelines.
What impact will generative AI have on future migrations?
AI-enabled code-analysis and refactoring tools are reducing modernization effort, accelerating the shift from lift-and-shift to cloud-native architectures expected to dominate by 2031.
Which region is expected to grow the quickest?
Asia-Pacific is forecast to register an 18.15% CAGR through 2031, driven by government investments and expanding hyperscale capacity.
Page last updated on:




