Clinical Oncology NGS Market Size and Share
Market Overview
| Study Period | 2020 - 2031 |
|---|---|
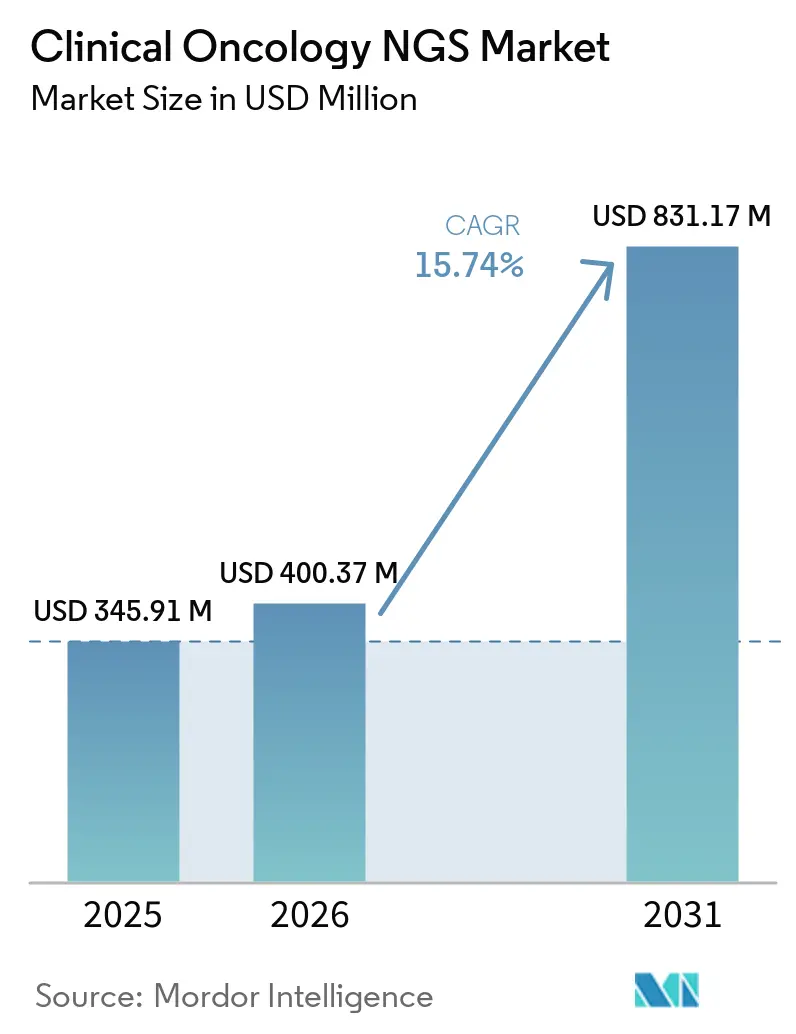
| Market Size (2026) | USD 400.37 Million |
| Market Size (2031) | USD 831.17 Million |
| Growth Rate (2026 - 2031) | 15.74% CAGR |
| Fastest Growing Market | North America |
| Largest Market | Asia-Pacific |
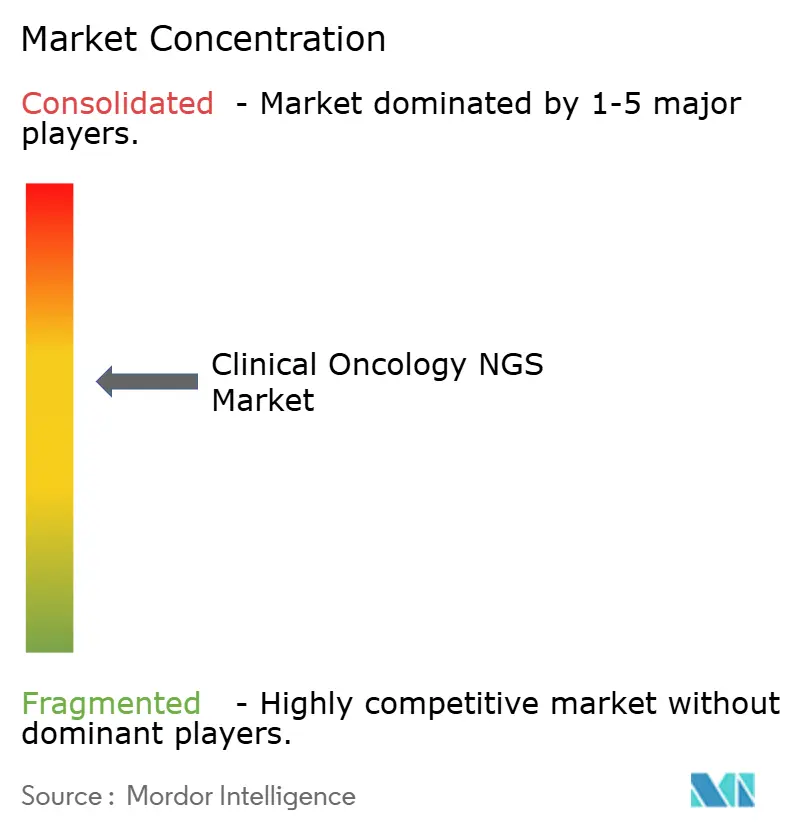
| Market Concentration | Medium |
Major Players *Disclaimer: Major Players sorted in no particular order Image © Mordor Intelligence. Reuse requires attribution under CC BY 4.0. | |
Clinical Oncology NGS Market Analysis by Mordor Intelligence
The Clinical Oncology NGS market size is expected to grow from USD 345.91 million in 2025 to USD 400.37 million in 2026 and is forecast to reach USD 831.17 million by 2031 at 15.74% CAGR over 2026-2031.
Wider coverage for comprehensive genomic profiling, sharp falls in cost-per-sample, and liquid-biopsy adoption anchor this growth. Sequencer throughput improvements shorten turnaround from weeks to days, transforming precision-oncology workflows in hospitals and reference labs. AI-enabled interpretation solves variant-calling bottlenecks, while newly standardized reimbursement frameworks increase test volumes across North America, Europe, and rapidly scaling Asia-Pacific hubs. Vendors now bundle tissue, blood, and hereditary panels, positioning the clinical oncology NGS market as a cornerstone of value-based oncology care.
Key Report Takeaways
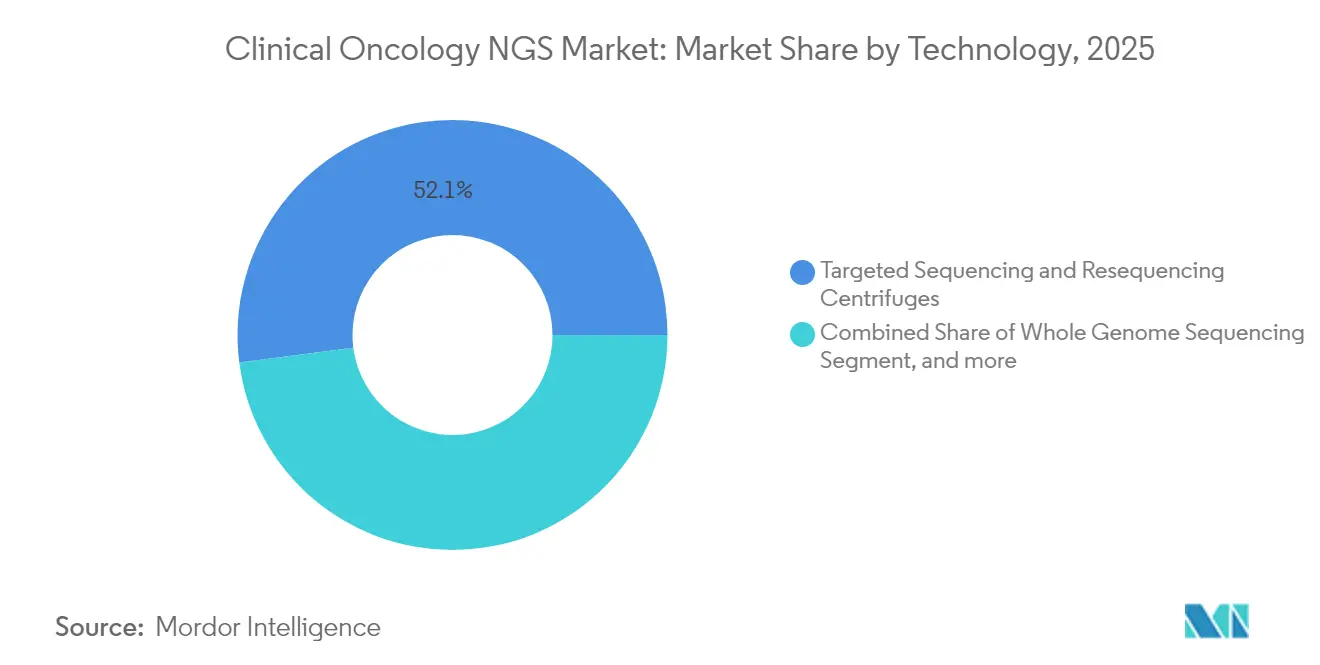
- By technology, targeted sequencing captured 52.05% revenue in 2025, whereas whole exome sequencing is projected to advance at a 16.98% CAGR through 2031.
- By workflow, sequencing operations held 43.41% share in 2025, while data analysis and interpretation is set to expand at 18.9% CAGR.
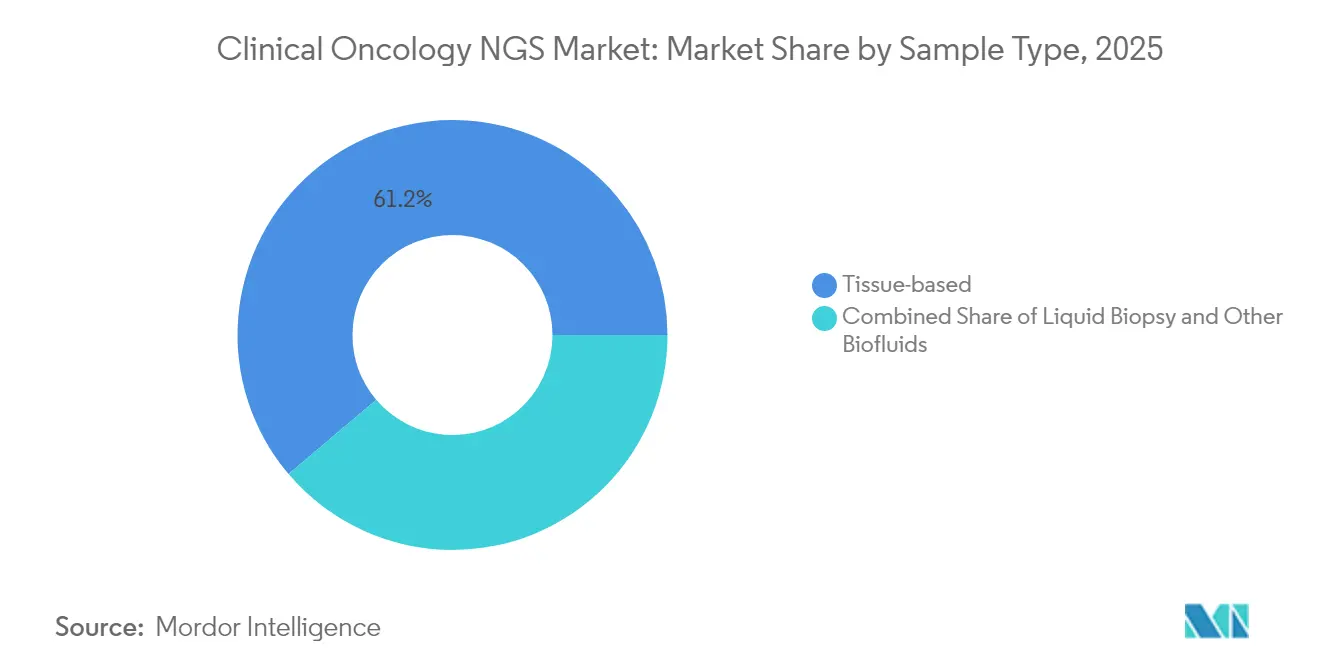
- By sample type, tissue testing accounted for 61.20% in 2025; liquid biopsy is on track for a 19.85% CAGR.
- By application, companion diagnostics led with 38.95% share in 2025, yet minimal residual disease monitoring is growing fastest at 21.5% CAGR.
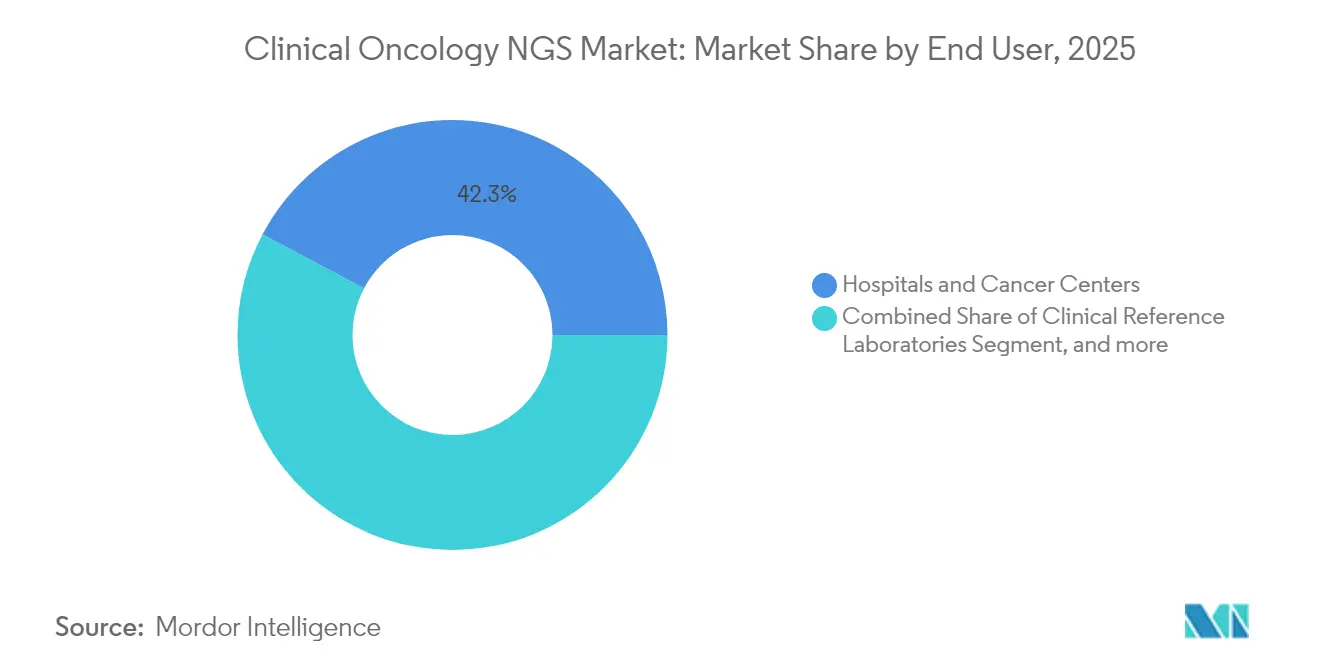
- By end user, hospitals and cancer centers retained 42.25% share in 2025, whereas clinical reference laboratories will grow at 17.9% CAGR.
- By geography, North America dominated with 45.20% share in 2025, and Asia-Pacific exhibits a 20.7% CAGR to 2031.
Note: Market size and forecast figures in this report are generated using Mordor Intelligence’s proprietary estimation framework, updated with the latest available data and insights as of 2026.
Global Clinical Oncology NGS Market Trends and Insights
Drivers Impact Analysis*
| Driver | (~) % Impact on CAGR Forecast | Geographic Relevance | Impact Timeline |
|---|---|---|---|
| Advancing Precision-Oncology Adoption & CGP Standard-Of-Care | +4.2% | Global, with early gains in North America, EU | Medium term (2-4 years) |
| Rising Global Cancer Incidence & Ageing Population | +3.8% | Global, concentrated in APAC and North America | Long term (≥ 4 years) |
| Rapid Decline in Sequencing Cost Per Sample | +3.1% | Global, with accelerated adoption in emerging markets | Short term (≤ 2 years) |
| Expanded Reimbursement For NGS-Based Oncology Tests | +2.9% | North America & EU, expanding to APAC | Medium term (2-4 years) |
| Liquid-Biopsy-Based MRD Monitoring Boosting Repeat Testing | +1.8% | Global, with premium adoption in developed markets | Medium term (2-4 years) |
| AI-Enabled Ultra-Rapid Sequencing for Point-Of-Care Decisions | +0.9% | North America & EU core, spill-over to APAC | Long term (≥ 4 years) |
| Source: Mordor Intelligence | |||
Advancing Precision-Oncology Adoption & CGP Standard-Of-Care
Clinical guidelines in lung, breast, colorectal, prostate, and ovarian cancers now recommend NGS-based comprehensive genomic profiling as first-line testing. FoundationOne CDx alone underpins 60% of U.S. companion-diagnostic approvals, spanning 300+ cancer-related genes. Consolidating multiple single-gene assays into one panel trims overall turnaround from 30 days to 2–3 days, lowering inpatient costs and accelerating targeted therapy start-dates.[1]Thermo Fisher Scientific, “In-House NGS Workflows Reduce Turnaround,” thermofisher.com Health-system savings and survival gains sustain widespread CGP uptake.
Rising Global Cancer Incidence & Aging Population
An older population profile and lifestyle shifts increase worldwide cancer prevalence, spurring demand for high-throughput NGS. In India, 80% of 1,000 profiled patients carried actionable alterations, prompting a national cancer budget of INR 99,858 crore (USD 12.3 billion) in 2025. Similar demographic pressure in China, Japan, and the United States drives annual test volumes, particularly for less invasive repeat draws favored by geriatric cohorts.
Rapid Decline in Sequencing Cost Per Sample
Genome-wide costs have dropped from USD 100 million in 2001 to roughly USD 500 in 2023, with Illumina’s NovaSeq X roadmap targeting USD 200.[2]World Intellectual Property Organization, “Sequencing Technology Cost Trends,” wipo.int Roll-to-roll fluidics and automated chemistry shrink per-sample overheads, opening reimbursement viability in mid-income systems and transforming single-gene cascades into one-shot multigene analyses at equal or lower cost.
Expanded Reimbursement For NGS-Based Oncology Tests
CMS now reimburses FDA-approved CGP, tumor mutation burden, and MRD codes, giving providers predictable margins. Guardant360 and Shield gained national coverage, and EU health-technology-assessment rules effective January 2025 harmonize evidence criteria across member states. Such policy milestones directly lift test adoption among payers and providers.
Restraints Impact Analysis*
| Restraint | (~) % Impact on CAGR Forecast | Geographic Relevance | Impact Timeline |
|---|---|---|---|
| Bioinformatics Talent & Data-Management Bottlenecks | -1.4% | Global, acute in emerging markets | Short term (≤ 2 years) |
| Uncertain Regulatory Pathways for Pan-Cancer Panels | -0.8% | EU & APAC regulatory jurisdictions | Medium term (2-4 years) |
| ESG Scrutiny of Sequencer Carbon Footprint Elevates Costs | -0.6% | Global, with premium impact in EU & North America | Medium term (2-4 years) |
| Cross-Border Genomic-Data Privacy Legislation | -0.4% | Global, concentrated in China, EU GDPR jurisdictions | Long term (≥ 4 years) |
| Source: Mordor Intelligence | |||
Bioinformatics Talent & Data-Management Bottlenecks
The supply of clinical bioinformaticians lags behind explosive test demand. Hospitals pay premium salaries while investing in cloud pipelines, yet variant-annotation complexity still slows reporting. Outsourcing to specialty providers and embedding AI interpretation engines partly offsets workforce constraints but does not fully resolve the training gap.
Uncertain Regulatory Pathways for Pan-Cancer Panels
EU IVDR demands third-party certification for up to 90% of IVDs, stalling many lab-developed pan-cancer assays.[3]HemaSphere, “IVDR Impact on Companion Diagnostics,” hemaspherejournal.com China enforces domestic data-hosting rules, complicating multi-site clinical trials. The approvals backlog deters smaller entrants and increases compliance costs for global launches.Laboratory-developed tests face particular challenges under IVDR, with institutions required to demonstrate that no equivalent CE-marked alternative exists before deploying in-house developed assays.
*Our forecasts treat driver/restraint impacts as directional, not additive. The impact forecasts reflect baseline growth, mix effects, and variable interactions.
Segment Analysis
By Technology: Targeted Sequencing Dominates Despite Exome Growth
Targeted panels held 52.05% of the clinical oncology NGS market share in 2025 by aligning actionable genes with payer preferences for concise reporting. Integrated DNA-plus-RNA kits enhance fusion detection while keeping file sizes manageable for hospital IT teams. Whole exome profiling is catching up on cost grounds, propelling a 16.98% CAGR that will narrow the gap by 2031. Clinicians increasingly order exomes for tumor types with heterogeneous driver mutations, leveraging the broader mutational canvas to guide immunotherapy combinations. The clinical oncology NGS market size for whole exome sequencing is set to climb sharply from 2026 as compelling evidence in solid tumors accumulates.
Growth prospects favor platforms that let laboratories toggle between 50-gene hotspot panels and 20,000-gene exomes within a single run. FoundationOne RNA adds splice-variant insight across 318 genes, signaling an era in which multi-omic panels become standard kit. Meanwhile, whole-genome assays remain a niche option for structural-variant-heavy malignancies or research cohorts but still benefit from falling reagents cost. As hospital molecular boards mature, demand shifts from “one-gene, one-drug” to pan-tumor biomarker signatures, sustaining the clinical oncology NGS market momentum across both targeted and exome modalities.


By Workflow: Data Analysis Bottlenecks Drive Growth
Sequencing instruments accounted for 43.41% revenue in 2025, reflecting their capital cost and consumables footprint. Yet the data-analysis tier is the fastest climber at 18.9% CAGR, because converting FASTQ files into therapy recommendations remains labor-intensive. Cloud-native interpretation suites now bundle automated QC, annotation, and report drafting, relieving clinical labs of scarce computational expertise. The emerging standard attaches tumor-only and paired-normal pipelines plus germline filtering to prevent incidental findings confusion.
Tempus, SOPHiA GENETICS, and Microsoft illustrate the shift toward hybrid SaaS plus bench-top models that bundle software seats with sequencing service credits. Long-read assemblers and graph-based aligners further stress compute infrastructure, fueling demand for GPU farms and FPGA accelerators. Consequently, the clinical oncology NGS market size expansion in data analytics is outpacing instrument sales, flipping the revenue mix toward interpretation subscriptions by early 2031. Vendors that integrate LIS connectivity, billing automation, and clinical-trial matching win contracts with both academic centers and community oncology chains.
By Sample Type: Liquid Biopsy Acceleration
Tissue assays still commanded 61.20% of 2025 revenue owing to entrenched pathology workflows and broad biomarker coverage. FFPE-optimized chemistries routinely meet quality metrics and remain required for PD-L1 immunohistochemistry or multiplex immunofluorescence adjuncts. Nonetheless, liquid biopsy volumes post a 19.85% CAGR as oncologists favor serial ctDNA draws during adjuvant and surveillance phases.
Guardant’s Shield (screening), Guardant360 (CGP), and Guardant Reveal (MRD) illustrate one vendor’s multistage continuum. Similar blood-based menus arrive from BGI, Roche, and Thermo Fisher. Cerebrospinal fluid, pleural effusion, and urine-derived exosome assays open fresh niche indications such as leptomeningeal spread. Together, these trends convert the once static diagnostic snapshot into a dynamic tumor-evolution movie, anchoring recurrent revenue for the clinical oncology NGS market and mitigating tissue adequacy failures.
By Application: MRD Monitoring Emerges
Companion diagnostics kept a 38.95% revenue share in 2025 because targeted therapy labels mandate biomarker confirmation. Panels now embed BRCA, EGFR, KRAS, RET, NTRK, and HRR mutations to align with FDA labels in breast, lung, and prostate cancers. Minimal residual disease monitoring, however, is set for 21.5% CAGR as hematologic and solid-tumor protocols add routine ctDNA checks every treatment cycle. Early relapse detection drives payer acceptance by preventing costly metastatic progression.
Hereditary risk assessment and tumor mutation burden scoring round out the menu, with germline add-ons capturing cascade testing revenue among family members. The clinical oncology NGS market size devoted to MRD could surpass screening volumes in high-recurrence cancers such as colorectal and triple-negative breast by 2031. As algorithmic thresholds mature, MRD may also guide therapy cessation decisions, reinforcing its economic value.
By End User: Reference Labs Scale Operations
Hospitals and dedicated cancer centers held 42.25% of 2025 revenue because integrated care teams demand rapid on-site answers. Their uptake is propelled by tumor boards that review NGS reports in real time to allocate scarce targeted-therapy slots. Clinical reference laboratories, however, will post an 17.9% CAGR as they consolidate specimens from community clinics lacking molecular infrastructure. High-throughput lanes, 24 hour uptime, and automated billing grant cost advantages that local labs struggle to replicate.
Flatiron Health’s EHR link with Tempus demonstrates how electronic ordering, courier logistics, and structured PDF imports shrink the ordering friction. Contract research organizations supply biopharma with trial enrollment screens and companion-diagnostic validation, tying their growth to pipeline size. Across end users, the clinical oncology NGS market pivots toward centralized scale balanced by edge sequencing pods embedded in hospital networks for emergent cases.
Geography Analysis
North America retained 45.20% of global revenue in 2025 because CMS Local Coverage Determinations reimburse both tissue and plasma CGP without case-by-case pre-authorization. FDA’s breakthrough-device pathway hastens liquid-biopsy approvals, and U.S. oncology networks such as US Oncology and Mayo Clinic institutionalize NGS in treatment guidelines. Canada’s publicly funded provinces follow with pan-Canadian Oncology Drug Review alignment, while Mexico’s private insurers gradually adopt U.S. CPT codes.
Europe’s adoption trajectory is shaped by IVDR and the January 2025 HTA regulation that synchronizes clinical-and-economic reviews across 27 countries. Germany, France, and the United Kingdom extend nationwide genomic medicine initiatives, funding centralized sequencing hubs that feed real-world evidence datasets. Southern and Eastern members ramp capacity through Horizon Europe grants, yet certification bottlenecks slow small lab offerings. ESG scrutiny nudges EU buyers toward instruments with documented lower carbon footprints, modestly inflating capital expense but aligning with Green Deal procurement criteria.
Asia-Pacific is the growth locomotive at 20.7% CAGR. China blends domestic NGS champions with strict data-localization mandates yet funds rural cancer screening pilots. Japan covers CGP under national insurance and features a rapidly aging demographic with high gastric-cancer prevalence, boosting panel demand. India’s large patient pool and government budget increases funnel volume to Bengaluru and Hyderabad reference labs equipped with NovaSeq X. Australia, Singapore, and South Korea act as technology testbeds, trialing AI-enabled same-day oncology reporting that feeds back into vendor R&D pipelines. Overall, expanding reimbursement, relaxed import duties, and high cancer incidence cement Asia-Pacific as the fastest mover in the clinical oncology NGS market.


Competitive Landscape
The clinical oncology NGS market exhibits moderate concentration. Guardant Health leverages its liquid-only franchise to span screening, CGP, and MRD under one brand umbrella, diversifying revenue beyond tissue reliance. Illumina remains the sequencer incumbent but partners with AI specialists such as Tempus for multimodal analytics bundles.
Strategic moves center on continuum coverage. In February 2025, Foundation Medicine launched two hereditary panels (50-gene and 154-gene) in partnership with Fulgent, adding germline revenue and feeding tumor–normal paired analyses. Tempus closed the Ambry Genetics acquisition and reported 35.8% revenue growth, integrating Ambry’s carrier-screening know-how into its oncology CGP book. SOPHiA GENETICS co-develops GPU-accelerated pipelines with NVIDIA, slashing exome processing time and entering cloud marketplaces alongside Microsoft Azure.
White-space competition intensifies around pharmacogenomics and pan-solid-tumor RNA fusion profiling as rare variant evidence builds. Vendors differentiate via sample logistics, with dried-blood-spot formats under feasibility that could bypass cold-chain limitations in rural Asia. ESG reporting emerges as a tender criterion, prompting sequencer OEMs to publish lifecycle carbon audits. Collectively, these dynamics reinforce a race to own the full precision oncology journey screening, therapy selection, residual monitoring, and survivorship within one interoperable ecosystem.
Clinical Oncology NGS Industry Leaders
Illumina, Inc.
F. Hoffmann-La Roche Ltd.
Thermo Fisher Scientific Inc.
Agilent Technologies, Inc.
Myriad Genetics, Inc.
- *Disclaimer: Major Players sorted in no particular order

Recent Industry Developments
- February 2025: Foundation Medicine launched FoundationOneGermline and FoundationOne Germline More hereditary cancer tests in partnership with Fulgent Genetics, analyzing 50 and 154 genes respectively to identify genetic variants associated with hereditary cancers and enhance comprehensive genomic profiling capabilities for healthcare providers.
- February 2025: Tempus reported 35.8% year-over-year revenue growth in Q4 2024 with genomics revenue increasing 30.6%, launched FDA-approved xT CDx NGS-based in vitro diagnostic device with ADLT status and established reimbursement rate, and completed Ambry Genetics acquisition to enhance precision medicine capabilities.
- January 2025: Tempus announced collaboration with Genialis to develop RNA-based biomarker algorithms using Tempus' multimodal dataset of approximately 1 million RNA-sequencing samples, aiming to validate Genialis' AI foundation model for enhanced clinical utility of RNA biomarkers in drug development.
- December 2024: Personalis and Tempus expanded their collaboration to enhance access to ultra-sensitive MRD testing solution NeXT Personal Dx for breast and lung cancers and immunotherapy monitoring across solid tumors, integrating MRD testing with Tempus' offerings for biopharma customers.


Global Clinical Oncology NGS Market Report Scope
As per the scope of the report, NGS has been adopted in clinical oncology to advance the personalized treatment of cancer. NGS is used to identify novel and rare cancer mutations, detect familial cancer mutation carriers, and provide a molecular rationale for appropriate targeted therapy. Technology segments the Clinical Oncology NGS Market (Whole Genome Sequencing, Whole Exome Sequencing, Targeted Sequencing & Resequencing Centrifuges), Workflow (Pre-Sequencing, Sequencing, Data Analysis), Application (Screening, Companion Diagnostics, Other Diagnostics End-use (Hospitals, Clinics, Laboratories, and Geography (North America, Europe, Asia-Pacific, Middle East & Africa, and South America). The market report also covers the estimated market sizes and trends for 17 countries across major global regions. The report offers the value (in USD million) for the above segments.
| Whole Genome Sequencing |
| Whole Exome Sequencing |
| Targeted Sequencing & Resequencing Centrifuges |
| Pre-analytical Sample Preparation |
| Sequencing |
| Data Analysis & Interpretation |
| Tissue-based |
| Liquid Biopsy |
| Other Biofluids |
| Screening | Sporadic Cancer |
| Inherited Cancer | |
| Companion Diagnostics | |
| Minimal Residual-Disease Monitoring | |
| Tumor Mutation-Burden Profiling | |
| Other Diagnostics |
| Hospitals & Cancer Centers |
| Clinical Reference Laboratories |
| Academic & Research Institutes |
| Contract Research Organizations |
| North America | United States | |
| Canada | ||
| Mexico | ||
| Europe | Germany | |
| United Kingdom | ||
| France | ||
| Italy | ||
| Spain | ||
| Rest of Europe | ||
| Asia-Pacific | China | |
| Japan | ||
| India | ||
| Australia | ||
| South Korea | ||
| Rest of Asia-Pacific | ||
| Middle East & Africa | GCC | |
| South Africa | GCC | |
| Rest of Middle East & Africa | ||
| South America | Brazil | |
| Argentina | ||
| Rest of South America | ||
| By Technology | Whole Genome Sequencing | ||
| Whole Exome Sequencing | |||
| Targeted Sequencing & Resequencing Centrifuges | |||
| By Workflow | Pre-analytical Sample Preparation | ||
| Sequencing | |||
| Data Analysis & Interpretation | |||
| By Sample Type | Tissue-based | ||
| Liquid Biopsy | |||
| Other Biofluids | |||
| By Application | Screening | Sporadic Cancer | |
| Inherited Cancer | |||
| Companion Diagnostics | |||
| Minimal Residual-Disease Monitoring | |||
| Tumor Mutation-Burden Profiling | |||
| Other Diagnostics | |||
| By End User | Hospitals & Cancer Centers | ||
| Clinical Reference Laboratories | |||
| Academic & Research Institutes | |||
| Contract Research Organizations | |||
| By Geography | North America | United States | |
| Canada | |||
| Mexico | |||
| Europe | Germany | ||
| United Kingdom | |||
| France | |||
| Italy | |||
| Spain | |||
| Rest of Europe | |||
| Asia-Pacific | China | ||
| Japan | |||
| India | |||
| Australia | |||
| South Korea | |||
| Rest of Asia-Pacific | |||
| Middle East & Africa | GCC | ||
| South Africa | GCC | ||
| Rest of Middle East & Africa | |||
| South America | Brazil | ||
| Argentina | |||
| Rest of South America | |||


Key Questions Answered in the Report
What is the current value of the clinical oncology NGS space and how fast is it expanding?
It reached USD 400.37 million in 2026 and is projected to grow at a 15.74% CAGR to USD 831.17 million by 2031.
Which sequencing approach holds the largest revenue share today?
Targeted sequencing accounts for 52.05% of 2025 revenue thanks to its balance of clinical actionability and manageable data loads.
What application is growing the quickest?
Minimal residual disease monitoring leads with a 21.5% CAGR as clinicians adopt serial ctDNA tests for post-treatment surveillance.
Why is liquid biopsy gaining traction over tissue testing?
Blood-based assays enable non-invasive, repeat sampling every few months, supporting earlier relapse detection and patient comfort.
Which region shows the highest future growth?
Asia-Pacific is advancing at 20.7% CAGR, driven by government funding, rising cancer incidence, and maturing reimbursement pathways.
How does artificial intelligence improve clinical oncology NGS workflows?
AI tools such as DeepVariant and Tempus One cut variant-calling time, boost accuracy, and generate same-day reports for faster therapy decisions.
Page last updated on:


