China MLCC Market Size and Share
Market Overview
| Study Period | 2020 - 2031 |
|---|---|
| Forecast Data Period | 2026 - 2031 |
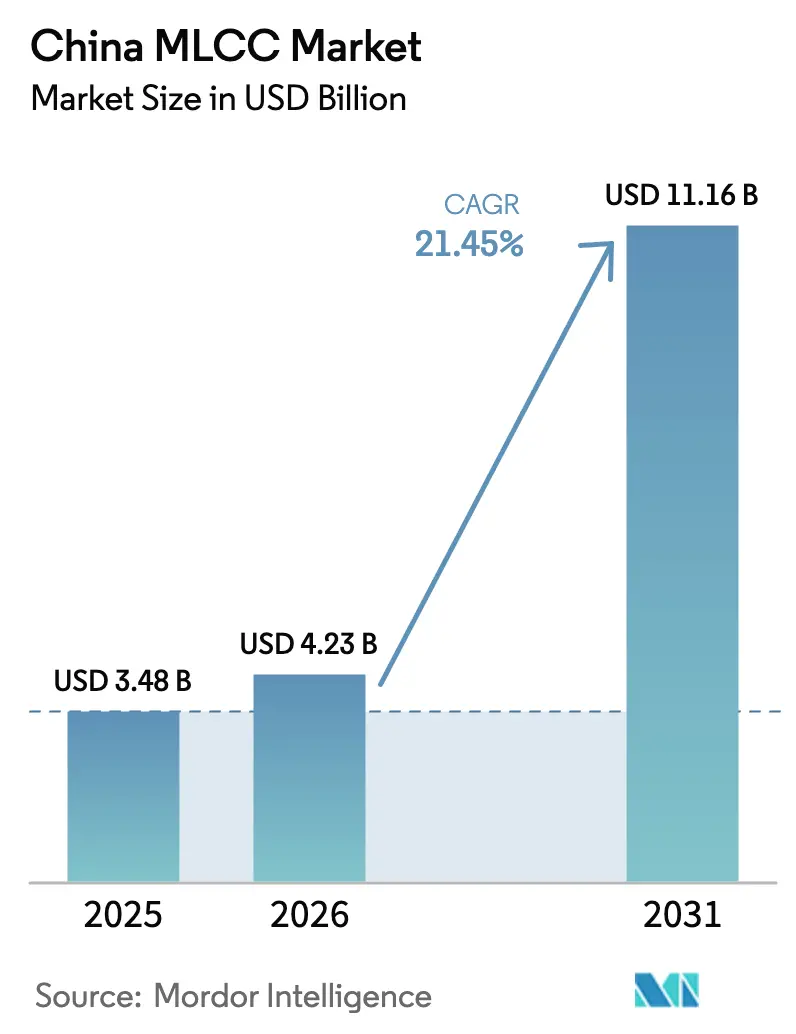
| Base Year Market Size (2025) | USD 3.48 Billion |
| Market Size (2026) | USD 4.23 Billion |
| Market Size (2031) | USD 11.16 Billion |
| Growth Rate (2026 - 2031) | 21.45% CAGR |
| Market Concentration | Medium |
Major Players *Disclaimer: Major Players sorted in no particular order Image © Mordor Intelligence. Reuse requires attribution under CC BY 4.0. | |
China MLCC Market Analysis by Mordor Intelligence
The China MLCC market size was valued at USD 3.48 billion in 2025 and estimated to grow from USD 4.23 billion in 2026 to reach USD 11.16 billion by 2031, at a CAGR of 21.45% during the forecast period (2026-2031). Accelerated 5G roll-outs, rapid electric-vehicle adoption, and AI server installations anchor this high-growth outlook and reinforce China’s policy goal of electronic-component self-sufficiency. Global leaders leverage technical scale to defend premium niches, while domestic suppliers target middle-volume segments to capitalize on local demand pull. Government incentives lower capital costs for new fabs and encourage equipment upgrades that close technology gaps. At the same time, raw-material price swings and oversupply cycles create near-term earnings volatility for smaller players.
Key Report Takeaways
- By dielectric type, Class I held 62.05% China MLCC market share in 2025; Class II is forecast to expand at a 23.20% CAGR to 2031.
- By case size, 201 accounted for 55.90% of the China MLCC market size in 2025, while 402 is projected to register a 22.95% CAGR through 2031.
- By voltage, low-voltage parts ≤100 V captured 58.80% of the 2025 China MLCC market size and are advancing at a 23.05% CAGR to 2031.
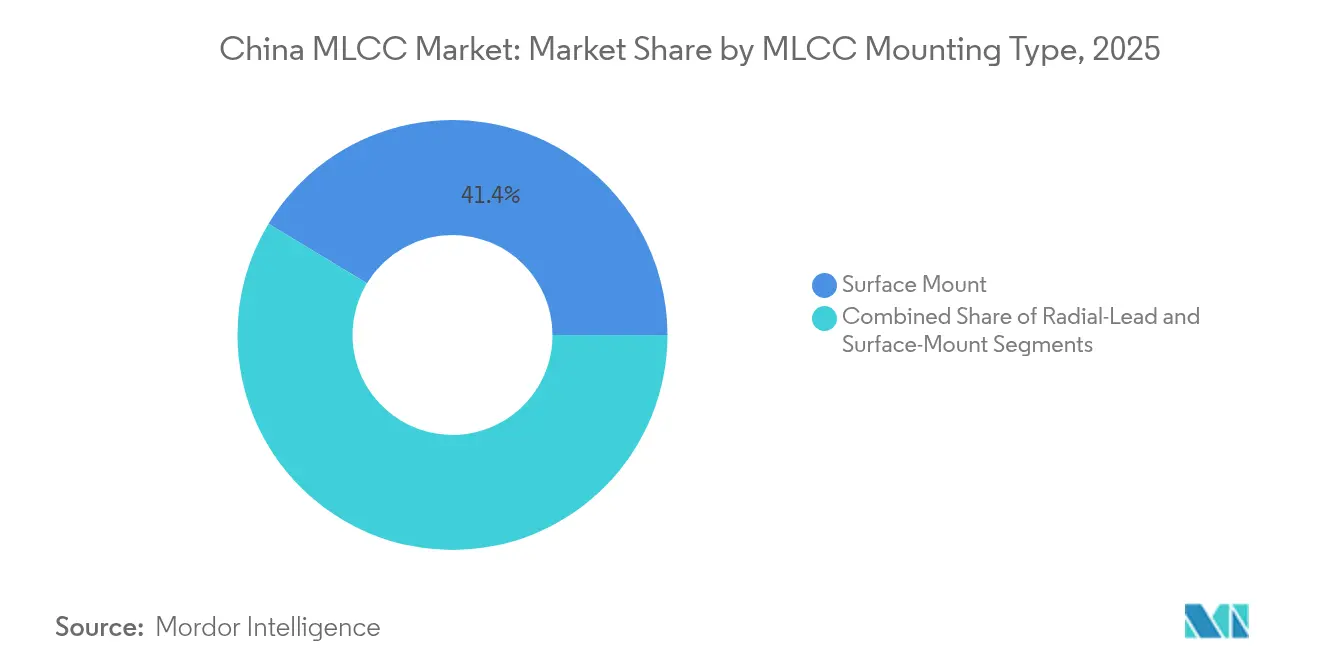
- By MLCC mounting type, surface-mount designs held 41.35% China MLCC market share in 2025; metal-cap formats post the fastest 22.50% CAGR to 2031.
- By end-user Application, consumer electronics led with 50.85% revenue share in 2025, while automotive MLCC demand is forecast to grow at 22.90% CAGR through 2031.
Note: Market size and forecast figures in this report are generated using Mordor Intelligence’s proprietary estimation framework, updated with the latest available data and insights as of 2026.
China MLCC Market Trends and Insights
Drivers Impact Analysis*
| Driver | (~) % Impact on CAGR Forecast | Geographic Relevance | Impact Timeline |
|---|---|---|---|
| Miniaturization and higher-capacitance demand in smartphones/IoT | +4.2% | Shenzhen–Guangzhou electronics hubs | Medium term (2-4 years) |
| Electrification and ADAS push MLCC content in vehicles | +5.8% | Shanghai, Shenzhen, Guangzhou automotive clusters | Long term (≥ 4 years) |
| 5G / AI-server infrastructure capacity build-out | +6.1% | Tier-1 cities and national industrial zones | Short term (≤ 2 years) |
| Government incentives for domestic MLCC capacity | +3.4% | Nationwide with regional funding variations | Long term (≥ 4 years) |
| Advanced thin-film MLCC fabs for implantables and wearables | +1.9% | Coastal export-oriented regions | Medium term (2-4 years) |
| Nickel-price hedging and value-added pricing adoption | +0.7% | China-based global supply chains | Short term (≤ 2 years) |
| Source: Mordor Intelligence | |||
5G / AI-Server Infrastructure Capacity Build-Out
China operates 4.25 million 5G base stations and plans to exceed 4.5 million by 2025, with each site requiring significantly more capacitors than its 4G equivalents. AI servers consume 3,000–4,000 MLCCs each, compared to fewer than 1,000 in traditional units, so hyperscale data center expansion multiplies the demand for mid-voltage Class I and II parts. [1]Machine Yearning, “Silicon Vanguard: Ranking China's Domestic Chip Leaders,” machineyearning.io Domestic vendors positioned near telecom OEM clusters capture quick-turn orders, while foreign incumbents supply high-capacitance grades with established automotive reliability benchmarks. Policy-backed edge-computing pilots further widen the deployment footprint. Short component life cycles in 5G radios shorten replacement intervals, adding a recurring revenue layer. This virtuous demand loop underscores the central role the China MLCC market plays in global passive-component supply chains.
Electrification and ADAS Push MLCC Content in Vehicles
Electric vehicles use 12,000–18,000 capacitors, compared to 3,000–10,000 in combustion models, which increases per-car MLCC bill-of-materials values. [2]Samsung Electro-Mechanics, “Samsung expands automotive MLCC supply to BYD,” kedglobal.com New-energy car sales passed 7.76 million units in 2023, equal to 35.7% of domestic passenger deliveries, and remain on an upward slope. High-voltage drive trains, silicon-carbide inverters, and ADAS modules require robust X7R and C0G grades that command a price premium triple that of commodity parts. Samsung Electro-Mechanics has recently secured multi-million-dollar supply awards from BYD for LiDAR-specific MLCCs, signaling a widening of design-win opportunities. Local authorities bundle tax credits with plant-relocation subsidies, encouraging capacitor makers to establish lines near automotive hubs. Continuous ADAS feature upgrades ensure steady long-term volume growth.
Miniaturization and Higher-Capacitance Demand in Smartphones/IoT
Flagship phones integrate nearly 1,000 MLCCs, and every generation calls for smaller footprints without compromising capacitance. Murata’s 006003-inch device is only 0.16 mm by 0.08 mm yet stores 47 µF, exemplifying the pace of form-factor compression. IoT sensors, wearables, and smart-home gateways follow a similar trajectory, expanding the application diversity for tiny Class II capacitors. Chinese handset ODMs in the Pearl River Delta adopt these parts rapidly, shortening qualification cycles for local suppliers. Integrated passive devices reduce board real estate requirements, enabling OEMs to fit larger batteries and new RF antennas. Consequently, the China MLCC market sees mounting pressure to deliver tighter dimensional tolerances and elevated volumetric efficiency.
Government Incentives for Domestic MLCC Capacity
Beijing’s future-industries blueprint lists passive components as priority targets, unlocking tax deductions, subsidized land, and low-interest loans for capacitor fabs. The 2025 equipment-renewal package broadens support to MLCC production tools, cutting capex payback periods for mid-sized enterprises. Funding pools also sponsor dielectric-powder research at leading universities, enhancing access to proprietary formulations. Provincial governments compete to host anchor projects, often bundling power-tariff discounts and talent grants. These incentives enable domestic players to scale pilot lines into mass-production volume and to qualify for higher reliability grades faster than in prior decades. Over time, policy momentum should reduce import dependence for critical telecom and automotive capacitors, reinforcing supply-chain resilience.
Restraints Impact Analysis*
| Restraint | (~) % Impact on CAGR Forecast | Geographic Relevance | Impact Timeline |
|---|---|---|---|
| Persistent oversupply and price-erosion cycles | -2.8% | Global market dynamics affecting China fabs | Short term (≤ 2 years) |
| Volatility in nickel and copper raw-material costs | -1.6% | Commodity markets shaping China production costs | Medium term (2-4 years) |
| Limited high-end manufacturing capabilities among domestic producers | -1.3% | Nationwide, most acute outside coastal tech corridors | Medium term (2-4 years) |
| Lengthy qualification cycles for automotive/high-reliability MLCCs | -1.1% | Global OEM standards impacting China suppliers | Long term (≥ 4 years) |
| Source: Mordor Intelligence | |||
Persistent Oversupply and Price-Erosion Cycles
The MLCC industry fluctuates between shortages and surpluses. Commodity X5R and X7R parts faced sharp spot-price corrections in 2019 and again after the 2022 pandemic demand spike. Global leaders now prioritize high-margin automotive grades, leaving entry-level segments crowded by price-focused suppliers. Chinese producers with thin capital buffers face a margin squeeze when lead times return to normal. End-users, aware of oversupply risks, negotiate quarterly price locks, dampening revenue visibility. This cyclical nature trims near-term growth for the China MLCC market even as secular demand remains intact.
Volatility in Nickel and Copper Raw-Material Costs
Nickel and copper account for a significant share of electrode paste expenses, and both metals experienced double-digit price changes last cycle. [3]TTI Inc., “MLCC raw-material cost trends,” ttiinc.com Limited vertical integration exposes many local MLCC firms to spot-market volatility, while Japanese competitors hedge with long-term contracts and captive powder lines. Cost swings compress gross margins, delaying capex decisions for next-gen production nodes. Smaller vendors struggle to adopt index-based pricing formulas that pass metal costs to customers. Until domestic powder supply chains mature, the risk of raw materials will continue to weigh on the profitability of the China MLCC market.
*Our forecasts treat driver/restraint impacts as directional, not additive. The impact forecasts reflect baseline growth, mix effects, and variable interactions.
Segment Analysis
By Dielectric Type: Class I Dominance Drives Precision Applications
Class I capacitors represented 62.05% of the China MLCC market share in 2025, driven by steady orders from 5G timing circuits and vehicle engine-control modules. The segment benefits from minimal capacitance drift across temperature swings, a trait prized by aerospace and industrial automation OEMs. Engineering teams specify C0G/NP0 parts for RF filters because high-Q factors maintain signal integrity. Domestic producer Dalian Dalicap focuses on these high-frequency grades, a move aligned with the densification of telecom base stations. Demand also surfaces in medical imaging scanners, where linearity is critical.
By contrast, Class II devices are expected to grow at a faster rate of 23.20% CAGR through 2031, as smartphones, wearables, and AI servers require higher capacitance in tight spaces. Manufacturers combine refined barium-titanate ceramics with nickel electrodes for volumetric gains. Global incumbents lead the technology curve, yet local firms invest in thin-layer stacking to bridge the gap. Government R&D grants offset tooling costs, enabling the development of pilot lines for X7R with over 100 layers. As capacity continues to ramp up, the China MLCC market is likely to retain its Class I leadership in value terms, while Class II drives unit growth.


By Case Size: Miniaturization Accelerates 402 Adoption
The ubiquitous 201 format captured 55.90% of the China MLCC market size in 2025, thanks to its broad adoption across handsets and notebooks. Its cost-to-performance ratio suits mass-market boards. Yet, 402 parts outpace all sizes with a 22.95% CAGR as OEMs squeeze ever more electronics into limited volumes. Murata’s 47 µF 0402 capacitor validates technical feasibility, spurring ODMs to redesign power rails. AI server motherboards follow suit: smaller decoupling capacitors, free routing layers, and improved airflow.
Chinese suppliers see opportunity but must master ultra-thin dielectric tape casting and defect-free lamination. Yield losses have a magnified cost impact in tiny sizes, so process controls become decisive. Foreign vendors leverage decades of ceramic-slurry know-how to safeguard reliability. As volumes scale, economies of learning should lower cost barriers, allowing local entrants to chip away at import reliance. Overall, miniaturization reinforces the strategic weight of the China MLCC market in global supply networks.
By Voltage: Low-Voltage Applications Sustain Market Leadership
Low-voltage devices, ≤100 V, held a 58.80% share of the China MLCC market size in 2025, mirroring the increasing demand from phones, laptops, and 5G radios. Designers favor these parts for logic-level rails, where ESR and ESL figures significantly impact signal quality. The ongoing transition to DDR5 memory raises decoupling-voltage thresholds to 25 V, but many consumer boards remain at sub-12 V, sustaining large run rates.
Medium-voltage (100–500 V) and high-voltage devices, such as on-board chargers, solar inverters, and industrial drives, target those that benefit from high ripple current tolerance. Automotive electrification thrusts ≥800 V battery packs into the mainstream, prompting suppliers to certify X8R dielectric variants. Domestic providers still rely on imported high-purity nickel powder for thick electrodes, yet joint-venture powder plants under construction may change the equation. As such, the China MLCC market balances volume-driven low-voltage sales with high-margin high-voltage extensions.
By MLCC Mounting Type: Surface Mount Technology Drives Integration
Surface-mount capacitors held a 41.35% market share in China's MLCC market in 2025, mirroring near-universal SMT line use at contract manufacturers. Tape-and-reel automation shortens cycle times and reduces labor expenses, benefits that are magnified within Shenzhen’s massive EMS ecosystem. Radial-lead and axial parts linger in maintenance, repair, and operations inventories where through-hole strength still matters.
Metal-cap styles are expected to record a 22.50% CAGR to 2031, driven by the demand for robust vibration resistance and superior heat dissipation in EV powertrains and industrial converters. Korean and Japanese firms leverage proprietary copper-base caps and reflow-solderable terminations. Chinese players are exploring electroless nickel-palladium-gold finishes to match their thermal fatigue limits. As power densities continue to rise, metal-cap volumes are likely to accelerate, adding depth to the China MLCC market's product mix.
By End-User Application: Consumer Electronics Leadership Faces Automotive Challenge
Consumer electronics accounted for 50.85% of the China MLCC market share in 2025, thanks to steady smartphone refresh cycles and a large base of white goods. ODM clusters in Dongguan and Huizhou favor localized procurement, giving domestic brands booking leverage during allocation phases. Wearable shipments bring incremental unit growth, albeit at lower average selling prices.
Automotive MLCC demand grows fastest at 22.90% CAGR as battery-electric vehicle volumes soar and ADAS penetration deepens. Each level-2 autonomy upgrade adds radar, LiDAR, and camera modules that together house thousands of capacitors. Telecom infrastructure, industrial automation, and medical equipment diversify revenue streams and dampen cyclical risk. This widening application funnel reinforces the relevance of the China MLCC market across various technology roadmaps.
Geography Analysis
Capacitor production clusters around the Pearl River Delta, where Guangdong Viiyong claims leadership status, leveraging Hong Kong logistics for export clearance. Neighboring Shenzhen hosts handset ODMs that consume vast volumes, ensuring short supply loops. Jiangsu province aligns with multinational giants; Murata operates multiple plants in Wuxi, and Samsung Electro-Mechanics maintains a line in Tianjin, facilitating technical cross-pollination. These coastal hubs enjoy mature supply chains for copper foil, ceramic powders, and high-precision screen printers.
The Yangtze River Delta is building momentum through Shanghai’s EV ecosystem, attracting premium automotive-grade MLCC orders. Local governments finance talent programs connecting capacitor companies with electric-drive researchers, accelerating material innovation. Northern China’s Dalian cluster specializes in RF-grade Class I products, supported by university labs that focus on microwave ceramics. Its port facilities also streamline nickel-powder imports, which are critical for base-metal electrodes.
Western provinces, historically underdeveloped in electronics, are starting to attract new fabs as officials offer electricity discounts tied to renewable-energy projects. Relocation de-risks coastal over-concentration and taps inland labor pools. Nationwide 5G base-station build-out distributes MLCC demand more evenly, lessening the freight penalty for inland sites. Environmental regulations influence site selection: provinces with stringent wastewater rules incentivize closed-loop slurry systems that boost yield. Thus, geography shapes cost structure and technology adoption patterns, reinforcing how closely regional initiatives intertwine with the China MLCC market trajectory.
Competitive Landscape
Top Companies in China MLCC Market
The China MLCC market remains moderately concentrated at the top, with Murata commanding a 34% global share, Samsung Electro-Mechanics at 24%, and Taiyo Yuden at 14%, collectively covering 72% of the revenue. Their moat rests on vertically integrated powder lines, proprietary electrode alloys, and multi-decade OEM alliances. Local firms collectively hold around a 7% share but expand more quickly in unit terms by focusing on commodity- and region-bundled procurement contracts.
The strategy pivots from a pure cost play to application specialization. Samsung Electro-Mechanics extends LiDAR-specific 1005-size parts that bypass standard qualification hurdles, securing BYD's design slots. Dalian Dalicap positions for high-Q microwave grades, courting 5G small-cell producers. Guangdong Viiyong scales mid-capacitance lines subsidized by provincial equipment grants, aiming at domestic industrial drives. Multinationals respond by localizing more layers of production, such as powder sintering, lamination, and packaging, which sidestep tariff risks. M&A heats up in adjacent passive fields; Yageo’s higher tender for Shibaura sensors confirms broader portfolio convergence.
Competitive intensity drives continuous miniaturization, higher volumetric efficiency, and stricter automotive reliability targets. Firms unwilling to reinvest in 0402 mass production risk margin compression as ASPs slide in larger case sizes. Meanwhile, customer qualification cycles stretch up to 18 months for AEC-Q200 grades, erecting entry barriers. The resulting landscape mixes entrenched behemoths, aggressive regional champions, and a tail of niche innovators, underpinning the dynamic growth profile of the China MLCC market.
China MLCC Industry Leaders
Kyocera AVX Components Corporation
Maruwa Co., Ltd.
Murata Manufacturing Co., Ltd.
Nippon Chemi-Con Corporation
Samsung Electro-Mechanics Co., Ltd.
- *Disclaimer: Major Players sorted in no particular order


Recent Industry Developments
- July 2025: Murata began the world’s first mass production of a 47 µF MLCC in 0402 size, reducing mounting area by 60% for AI servers
- May 2025: Yageo raised its tender bid for Shibaura Electronics to strengthen its sensor lineup, following TOKIN integration success
- April 2025: Samsung Electro-Mechanics secured multi-million-dollar automotive MLCC contracts with BYD, reinforcing its China EV focus
- February 2025: Samsung Electro-Mechanics debuted a 25 V MLCC family for DDR5 memory regulators, featuring the 0805 X6S 22 µF flagship


China MLCC Market Report Scope
Class 1, Class 2 are covered as segments by Dielectric Type. 0 201, 0 402, 0 603, 1 005, 1 210, Others are covered as segments by Case Size. 500V to 1000V, Less than 500V, More than 1000V are covered as segments by Voltage. 100µF to 1000µF, Less than 100µF, More than 1000µF are covered as segments by Capacitance. Metal Cap, Radial Lead, Surface Mount are covered as segments by Mlcc Mounting Type. Aerospace and Defence, Automotive, Consumer Electronics, Industrial, Medical Devices, Power and Utilities, Telecommunication, Others are covered as segments by End User.| Class 1 |
| Class 2 |
| 201 |
| 402 |
| 603 |
| 1005 |
| 1210 |
| Other Case Sizes |
| Low Voltage (less than or equal to 100 V) |
| Mid Voltage (100 – 500 V) |
| High Voltage (above 500 V) |
| Metal Cap |
| Radial Lead |
| Surface Mount |
| Aerospace and Defence |
| Automotive |
| Consumer Electronics |
| Industrial |
| Medical Devices |
| Power and Utilities |
| Telecommunication |
| Other End-User Applications |
| By Dielectric Type | Class 1 |
| Class 2 | |
| By Case Size | 201 |
| 402 | |
| 603 | |
| 1005 | |
| 1210 | |
| Other Case Sizes | |
| By Voltage | Low Voltage (less than or equal to 100 V) |
| Mid Voltage (100 – 500 V) | |
| High Voltage (above 500 V) | |
| By MLCC Mounting Type | Metal Cap |
| Radial Lead | |
| Surface Mount | |
| By End-User Application | Aerospace and Defence |
| Automotive | |
| Consumer Electronics | |
| Industrial | |
| Medical Devices | |
| Power and Utilities | |
| Telecommunication | |
| Other End-User Applications |


Market Definition
- MLCC (Multilayer Ceramic Capacitor) - A type of capacitor that consists of multiple layers of ceramic material, alternating with conductive layers, used for energy storage and filtering in electronic circuits.
- Voltage - The maximum voltage that a capacitor can safely withstand without experiencing breakdown or failure. It is typically expressed in volts (V)
- Capacitance - The measure of a capacitor's ability to store electrical charge, expressed in farads (F). It determines the amount of energy that can be stored in the capacitor
- Case Size - The physical dimensions of an MLCC, typically expressed in codes or millimeters, indicating its length, width, and height
| Keyword | Definition |
|---|---|
| MLCC (Multilayer Ceramic Capacitor) | A type of capacitor that consists of multiple layers of ceramic material, alternating with conductive layers, used for energy storage and filtering in electronic circuits. |
| Capacitance | The measure of a capacitor's ability to store electrical charge, expressed in farads (F). It determines the amount of energy that can be stored in the capacitor |
| Voltage Rating | The maximum voltage that a capacitor can safely withstand without experiencing breakdown or failure. It is typically expressed in volts (V) |
| ESR (Equivalent Series Resistance) | The total resistance of a capacitor, including its internal resistance and parasitic resistances. It affects the capacitor's ability to filter high-frequency noise and maintain stability in a circuit. |
| Dielectric Material | The insulating material used between the conductive layers of a capacitor. In MLCCs, commonly used dielectric materials include ceramic materials like barium titanate and ferroelectric materials |
| SMT (Surface Mount Technology) | A method of electronic component assembly that involves mounting components directly onto the surface of a printed circuit board (PCB) instead of through-hole mounting. |
| Solderability | The ability of a component, such as an MLCC, to form a reliable and durable solder joint when subjected to soldering processes. Good solderability is crucial for proper assembly and functionality of MLCCs on PCBs. |
| RoHS (Restriction of Hazardous Substances) | A directive that restricts the use of certain hazardous materials, such as lead, mercury, and cadmium, in electrical and electronic equipment. Compliance with RoHS is essential for automotive MLCCs due to environmental regulations |
| Case Size | The physical dimensions of an MLCC, typically expressed in codes or millimeters, indicating its length, width, and height |
| Flex Cracking | A phenomenon where MLCCs can develop cracks or fractures due to mechanical stress caused by bending or flexing of the PCB. Flex cracking can lead to electrical failures and should be avoided during PCB assembly and handling. |
| Aging | MLCCs can experience changes in their electrical properties over time due to factors like temperature, humidity, and applied voltage. Aging refers to the gradual alteration of MLCC characteristics, which can impact the performance of electronic circuits. |
| ASPs (Average Selling Prices) | The average price at which MLCCs are sold in the market, expressed in USD million. It reflects the average price per unit |
| Voltage | The electrical potential difference across an MLCC, often categorized into low-range voltage, mid-range voltage, and high-range voltage, indicating different voltage levels |
| MLCC RoHS Compliance | Compliance with the Restriction of Hazardous Substances (RoHS) directive, which restricts the use of certain hazardous substances, such as lead, mercury, cadmium, and others, in the manufacturing of MLCCs, promoting environmental protection and safety |
| Mounting Type | The method used to attach MLCCs to a circuit board, such as surface mount, metal cap, and radial lead, which indicates the different mounting configurations |
| Dielectric Type | The type of dielectric material used in MLCCs, often categorized into Class 1 and Class 2, representing different dielectric characteristics and performance |
| Low-Range Voltage | MLCCs designed for applications that require lower voltage levels, typically in the low voltage range |
| Mid-Range Voltage | MLCCs designed for applications that require moderate voltage levels, typically in the middle range of voltage requirements |
| High-Range Voltage | MLCCs designed for applications that require higher voltage levels, typically in the high voltage range |
| Low-Range Capacitance | MLCCs with lower capacitance values, suitable for applications that require smaller energy storage |
| Mid-Range Capacitance | MLCCs with moderate capacitance values, suitable for applications that require intermediate energy storage |
| High-Range Capacitance | MLCCs with higher capacitance values, suitable for applications that require larger energy storage |
| Surface Mount | MLCCs designed for direct surface mounting onto a printed circuit board (PCB), allowing for efficient space utilization and automated assembly |
| Class 1 Dielectric | MLCCs with Class 1 dielectric material, characterized by a high level of stability, low dissipation factor, and low capacitance change over temperature. They are suitable for applications requiring precise capacitance values and stability |
| Class 2 Dielectric | MLCCs with Class 2 dielectric material, characterized by a high capacitance value, high volumetric efficiency, and moderate stability. They are suitable for applications that require higher capacitance values and are less sensitive to capacitance changes over temperature |
| RF (Radio Frequency) | It refers to the range of electromagnetic frequencies used in wireless communication and other applications, typically from 3 kHz to 300 GHz, enabling the transmission and reception of radio signals for various wireless devices and systems. |
| Metal Cap | A protective metal cover used in certain MLCCs (Multilayer Ceramic Capacitors) to enhance durability and shield against external factors like moisture and mechanical stress |
| Radial Lead | A terminal configuration in specific MLCCs where electrical leads extend radially from the ceramic body, facilitating easy insertion and soldering in through-hole mounting applications. |
| Temperature Stability | The ability of MLCCs to maintain their capacitance values and performance characteristics across a range of temperatures, ensuring reliable operation in varying environmental conditions. |
| Low ESR (Equivalent Series Resistance) | MLCCs with low ESR values have minimal resistance to the flow of AC signals, allowing for efficient energy transfer and reduced power losses in high-frequency applications. |


Research Methodology
Mordor Intelligence has followed the following methodology in all our MLCC reports.
- Step 1: Identify Data Points: In this step, we identified key data points crucial for comprehending the MLCC market. This included historical and current production figures, as well as critical device metrics such as attachment rate, sales, production volume, and average selling price. Additionally, we estimated future production volumes and attachment rates for MLCCs in each device category. Lead times were also determined, aiding in forecasting market dynamics by understanding the time required for production and delivery, thereby enhancing the accuracy of our projections.
- Step 2: Identify Key Variables: In this step, we focused on identifying crucial variables essential for constructing a robust forecasting model for the MLCC market. These variables include lead times, trends in raw material prices used in MLCC manufacturing, automotive sales data, consumer electronics sales figures, and electric vehicle (EV) sales statistics. Through an iterative process, we determined the necessary variables for accurate market forecasting and proceeded to develop the forecasting model based on these identified variables.
- Step 3: Build a Market Model: In this step, we utilized production data and key industry trend variables, such as average pricing, attachment rate, and forecasted production data, to construct a comprehensive market estimation model. By integrating these critical variables, we developed a robust framework for accurately forecasting market trends and dynamics, thereby facilitating informed decision-making within the MLCC market landscape.
- Step 4: Validate and Finalize: In this crucial step, all market numbers and variables derived through an internal mathematical model were validated through an extensive network of primary research experts from all the markets studied. The respondents are selected across levels and functions to generate a holistic picture of the market studied.
- Step 5: Research Outputs: Syndicated Reports, Custom Consulting Assignments, Databases, and Subscription Platform


