Market Overview
| Study Period | 2021 - 2031 |
|---|---|
| Forecast Data Period | 2026 - 2031 |
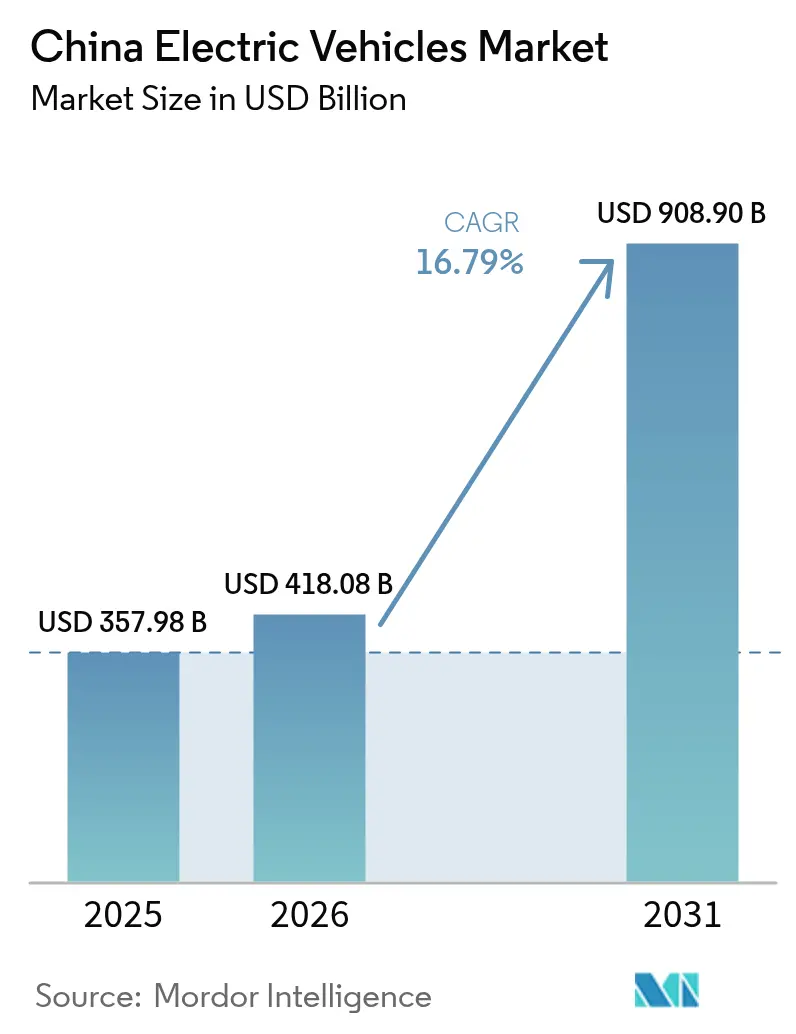
| Base Year Market Size (2025) | USD 357.98 Billion |
| Market Size (2026) | USD 418.08 Billion |
| Market Size (2031) | USD 908.9 Billion |
| Growth Rate (2026 - 2031) | 16.79% CAGR |
| Market Concentration | Low |
Major Players *Disclaimer: Major Players sorted in no particular order Image © Mordor Intelligence. Reuse requires attribution under CC BY 4.0. | |
China Electric Vehicles Market Analysis by Mordor Intelligence
The China Electric Vehicles Market size in 2026 is estimated at USD 418.08 billion, growing from 2025 value of USD 357.98 billion with 2031 projections showing USD 908.9 billion, growing at 16.79% CAGR over 2026-2031. Battery cost parity, a nationwide charging and battery-swap build-out, and tier-2/3 city PHEV momentum reinforce volume expansion. Automakers are also accelerating vertical integration and battery chemistry innovation to secure falling margins amid price wars. Infrastructure investment and cost-competitive LFP batteries position the Chinese electric vehicle market for further penetration into price-sensitive rural segments.
Key Report Takeaways
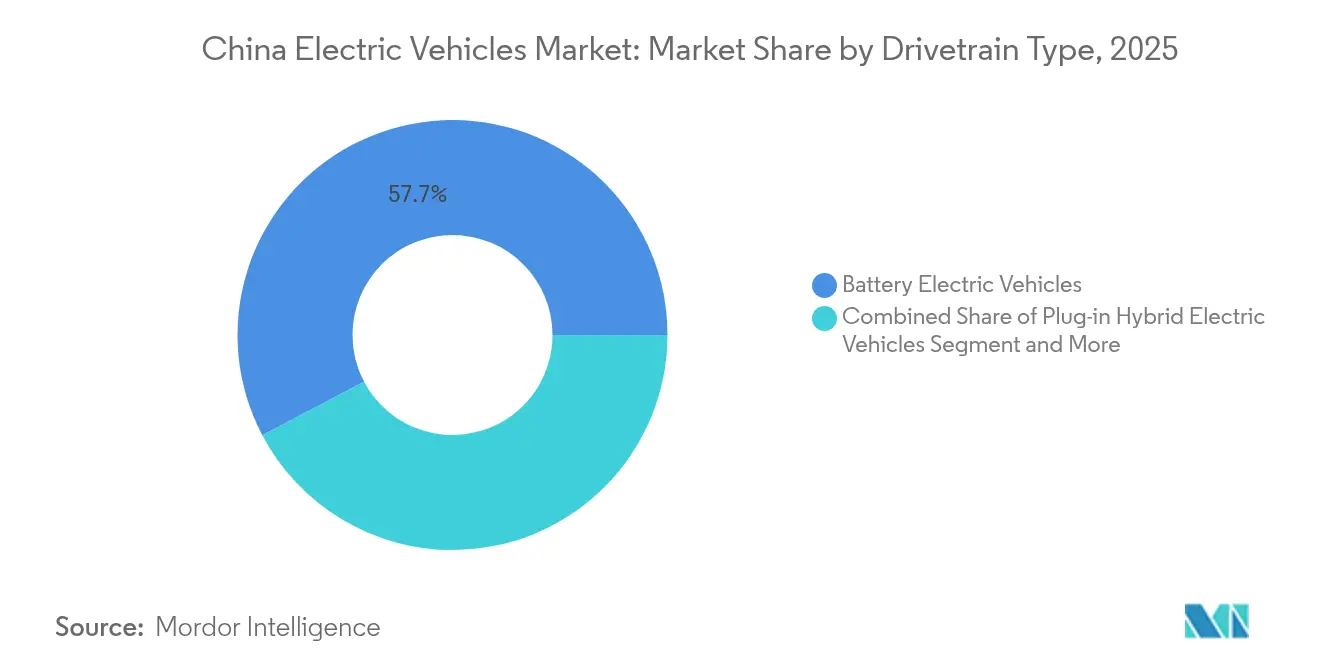
- By drivetrain type, battery electric vehicles held 57.72% of the China electric vehicle market share in 2025, while plug-in hybrids are forecast to advance at a 20.88% CAGR through 2031.
- By vehicle type, passenger cars captured 87.60% revenue share in 2025; light commercial vehicles are expanding at an 18.20% CAGR to 2031.
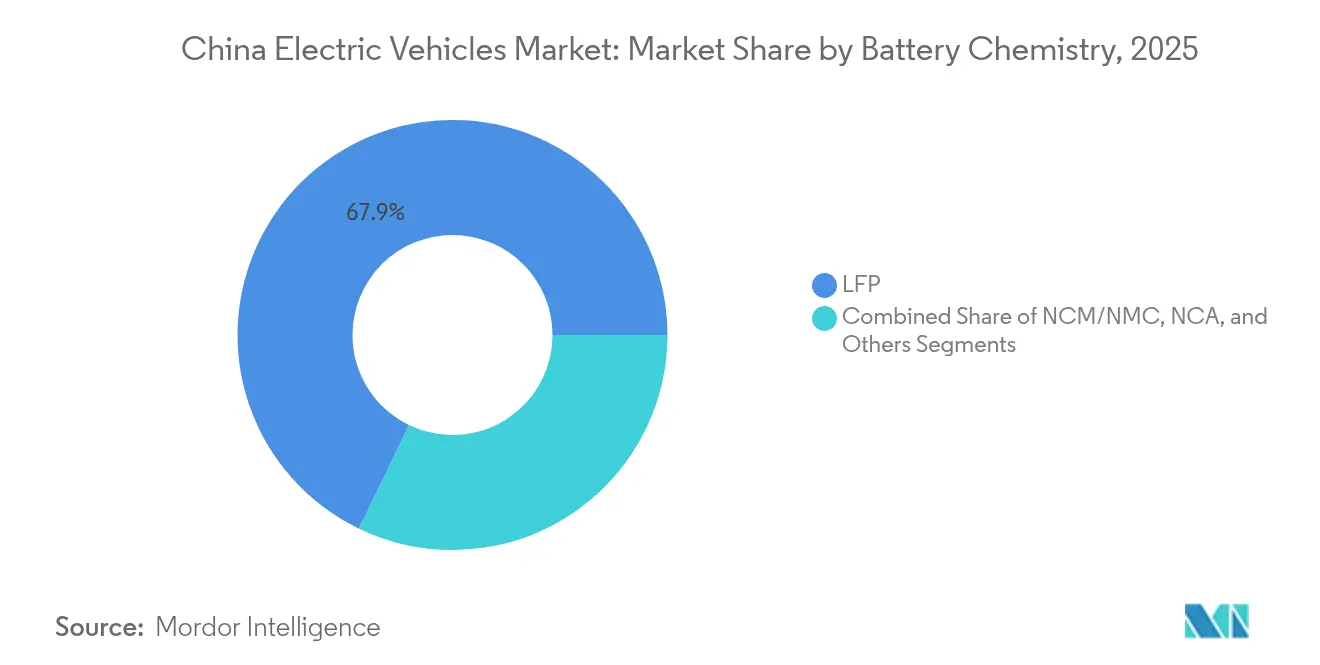
- By battery chemistry, LFP commanded a 67.85% share in 2025, whereas the other sub-segments are on track for a 33.20% CAGR through 2031.
- By price band, the USD 10,000 - 20,000 segment led with a 46.15% share in 2025; vehicles over USD 50,000 are projected to grow at a 21.50% CAGR to 2031.
Note: Market size and forecast figures in this report are generated using Mordor Intelligence’s proprietary estimation framework, updated with the latest available data and insights as of 2026.
China Electric Vehicles Market Trends and Insights
Drivers Impact Analysis*
| Driver | (~) % Impact on CAGR Forecast | Geographic Relevance | Impact Timeline |
|---|---|---|---|
| PHEV Growth in Tier-2/3 Cities | +4.1% | Tier-2/3 cities, rural areas | Short term (≤ 2 years) |
| LFP Cost Parity With Small ICE Cars | +3.8% | National, strongest in price-sensitive segments | Short term (≤ 2 years) |
| NEV Tax Exemptions Extended to 2027 | +3.2% | National, with stronger impact in tier-2/3 cities | Medium term (2-4 years) |
| Fast-Charge & Battery-Swap Corridor Expansion | +2.8% | National, concentrated in major transportation corridors | Long term (≥ 4 years) |
| E-Freight Quotas Driving LCV Demand | +1.9% | Major metropolitan areas, logistics hubs | Medium term (2-4 years) |
| V2G Tariffs Unlock Grid Revenue | +1.5% | Pilot cities, expanding to provincial level | Long term (≥ 4 years) |
| Source: Mordor Intelligence | |||
Extended NEV Purchase-Tax Exemptions to 2027
Tax-free status worth USD 1,390-4,175 per vehicle cushions the post-subsidy transition and keeps entry-level pricing competitive. Tier-2/3 customers react strongly to this saving, and one-third of 2024 NEV sales leveraged the exemption plus trade-in incentives. Predictable policy horizons let automakers schedule capacity ramps and mid-cycle refreshes, particularly for mid-market crossovers driving the volume of China's electric vehicles.
Nationwide Fast-Charging & Battery-Swap Corridor Build-Out
Public charging points rose drastically over the past few years, while CATL and Sinopec are placing 500 battery-swap stations capable of two-minute exchanges. Highway coverage now spans 60% of service areas, and 57% of chargers remain clustered within 15 cities, signalling headroom in western provinces. The twin-track infrastructure strategy addresses commuter top-up needs and fleet uptime demands, underpinning confidence in the Chinese electric vehicle market.
PHEV Surge in Tier-2/3 Cities on Fuel-Savings Appeal
PHEV deliveries jumped over 80% in 2024 as consumers embraced BYD Qin L-level pricing below USD 16,700. Dual-fuel flexibility mitigates limited charging access and lowers the total cost of ownership. Research shows buyers outside tier-1 metros rank operating savings above environmental factors, making PHEVs the pragmatic bridge toward full electrification.
Municipal E-Freight Quotas Boosting Electric LCV Demand
Cities restrict diesel van access during peak hours, propelling electric LCV registrations exceeding 38,000 units in 1H 2024. Battery-swap vans leverage CATL’s two-minute module change to maximise route density. Fleet operators benefit from battery-as-a-service contracts that transfer residual-value risk, solidifying the Chinese electric vehicle market’s commercial pillar.
Restraints Impact Analysis*
| Restraint | (~) % Impact on CAGR Forecast | Geographic Relevance | Impact Timeline |
|---|---|---|---|
| Subsidy Phase-Out Slows Upgrade Cycles | -2.7% | National, stronger impact in price-sensitive segments | Short term (≤ 2 years) |
| Lithium Price & Export Volatility | -1.8% | Global supply chain, domestic battery production | Medium term (2-4 years) |
| NEV Quality Concerns Impacting Loyalty | -1.6% | National, stronger impact on premium segments | Short term (≤ 2 years) |
| Provincial Caps on Underused Chargers | -1.2% | Provincial level, particularly in oversupplied regions | Medium term (2-4 years) |
| Source: Mordor Intelligence | |||
Phase-Out of Central Subsidies Slowing Upgrade Cycles
The December 2022 subsidy sunset trimmed purchase incentives by RMB 1,670-2,780, elevating price sensitivity in mid-market sedans. Automakers countered with rebates and regional trade-in schemes, yet replacement intervals lengthened. As battery input costs drop, reliance on direct subsidies is expected to fade, restoring natural replacement rhythms within the Chinese electric vehicle market.
Lithium-Carbonate Price & Export-Control Volatility
An 80% price plunge to roughly USD 13,000/ton relieved near-term cost pressure but highlighted sourcing risk, with China importing 83.65% of its lithium feedstock. Export-control threats from Australia and Chile complicate multi-year procurement contracts, pushing cell makers toward sodium-ion and iron-rich chemistries less exposed to lithium swings.[1]“Lithium-Carbonate Price & Export-Control Volatility,” Oxford Institute for Energy Studies, oxfordenergy.org
*Our forecasts treat driver/restraint impacts as directional, not additive. The impact forecasts reflect baseline growth, mix effects, and variable interactions.
Segment Analysis
By Drivetrain Type: PHEV Momentum Challenges BEV Leadership
Battery electric vehicles led 2025 deliveries with a 57.72% share, anchoring the China electric vehicle market size for that year. Plug-in hybrids, however, are forecast to post a 20.88% CAGR to 2031, narrowing the gap as infrastructure diffuses inland. Dual-fuel flexibility makes PHEVs the preferred bridge tech for drivers facing sparse chargers.
Continued BEV cost erosion keeps fully electric models appealing in subcompacts and taxi fleets, yet PHEV growth in family SUVs and rural sedans diversifies the powertrain mix. Manufacturers, therefore, hedge across architectures, while solid-state programs target the post-2030 premium BEV wave.


By Vehicle Type: Commercial Electrification Accelerates
Passenger cars captured 87.60% of China's electric vehicle market share in 2025, but light commercial vans are rising on an 18.20% CAGR trajectory. Municipal zero-emission quotas, hub-and-spoke logistics, and battery-swap economics make electric LCVs a reliable fleet asset.
SUVs show 14.85% CAGR as consumers trade up for cabin space, and bus operators refresh diesel fleets under local low-emission mandates. Commercial adoption reinforces battery demand curves and broadens China's electric vehicle market size beyond private mobility.
By Battery Chemistry: Sodium-Ion Disruption in Sight
LFP retained 67.85% dominance in 2025, cementing cost leadership for the Chinese electric vehicle market. Other sub-segments are scaling at 33.20% CAGR, with CATL sodium-ion battery prototypes hitting 160 Wh/kg. Abundant raw sodium and simplified supply chains hedge lithium exposure, suiting entry-level hatchbacks and delivery vans.
NCM chemistry maintains its foothold in performance sedans, yet faces cost headwinds. Solid-state roadmaps aiming for 500 Wh/kg by 2027 could recalibrate density benchmarks in luxury crossovers and intercity coaches.
By Price Band: Mid-Market Strength Amid Premium Uptake
The USD 10,000-20,000 price bracket captured 46.15% of total EV sales volume in 2025, highlighting it as the most concentrated segment of China's electric vehicle market. Meanwhile, the above-USD 50,000 category is expanding at a 21.50% CAGR, driven by demand from urban commuters and ride-share programs. EVs priced between USD 30,000-50,000 are growing at a 14.20% CAGR, supported by rising interest in advanced driver-assistance features and premium branding.
Price compression, average retail tags fell 19% in two years, reflects capacity expansion and battery cost declines. Makers now align trim ladders carefully to defend branding while satisfying price-sensitive contexts.
Geography Analysis
Eastern and southern provinces remain powerhouses, yet penetration drifted marginally as hinterland sales accelerated. Tier-1 cities reached NEV penetration above 70%, sustained by dense infrastructure, restrictive license-plate quotas for ICE cars, and affluent buyers. The Chinese electric vehicle market now gains incremental volume in tier-2/3 locales, where PHEVs bridge charging gaps and rural promotion campaigns seed adoption.
Infrastructure is still uneven; 57% of chargers cluster in 15 megacities. Government programs fund corridor coverage, and county-level battery-swap rollouts by NIO promise availability across 2,844 counties. High-speed rail access unexpectedly boosts EV confidence by shortening intercity journey times that otherwise magnify range anxiety.
Export manufacturing concentrates in coastal hubs, shipping 1.284 million NEVs to 160 markets in 2024. Interior provinces court supply-chain investments, integrating battery, motor, and electronics plants into local industrial revitalisation. Varied provincial incentives, from parking rebates to electricity discounts, shape localised adoption curves but collectively extend the China electric vehicle market reach nationwide.
Competitive Landscape
Roughly 90 brands contest the arena, but the top 10 capture the majority of sales, indicating moderate consolidation pressure. BYD leads from the forefront, leveraging end-to-end battery-to-car integration and 30% promotional discounts to defend its share. SAIC-GM-Wuling retains micro-EV leadership, Tesla sustains premium mindshare, and Huawei’s platform strategy lets multiple partners deploy Harmony cockpit software rapidly.
Three playbooks dominate. First, vertically integrated players such as BYD internally manage cells, packs, and semiconductors. Second, technology alliances—Huawei-Seres and Xiaomi-BAIC—share electronics stacks, shortening the time to launch. Third, modular vehicle platforms allow legacy makers like Geely to amortise R&D across sub-brands.
Margins have tightened to 5%, the lowest in a decade, magnifying the survival stakes. Differentiation leverages fast-charge breakthroughs, 2-minute battery swaps, and Level-2+ driver assistance standardisation. Rising defect rates flagged by J.D. Power propel quality-control investments, advantaging firms with mature supply-chain monitoring. Choco-Swap, CATL’s open battery-swap standard, allied with 100 partners, illustrates how ecosystems play can create fresh revenue pools beyond unit sales and influence the future structure of the Chinese electric vehicle market.[3]“Choco-Swap Ecosystem Launch,” Contemporary Amperex Technology Co. Limited, catl.com
China Electric Vehicles Industry Leaders
BYD Company Ltd
SAIC Motor Corporation Limited
Geely Auto Group
Tesla Inc.
Changan Automobile
- *Disclaimer: Major Players sorted in no particular order

Recent Industry Developments
- April 2025: CATL and Sinopec have initiated the construction of 500 battery-swap stations, enabling swift two-minute exchanges. These stations aim to enhance the efficiency of electric vehicle operations by reducing charging time significantly.
- March 2025: NIO and CATL agreed on full county-level swap-station coverage, with CATL investing up to RMB 2.5 billion in NIO Energy.
- January 2025: China has prolonged its vehicle trade-in program until 2025 to soften the blow of phasing out subsidies. This initiative encourages vehicle upgrades and sustains market demand during the transition period.
- December 2024: CATL unveiled the Choco-Swap ecosystem with nearly 100 partners, targeting 30,000 swap sites by 2030.


China Electric Vehicles Market Report Scope
An electric vehicle (EV) operates on an electric motor instead of an internal combustion engine that generates power by burning a mix of fuel and gases. Rising pollution, global warming, and depleting natural resources are likely to see such a vehicle as a possible replacement for current-generation automobiles across the country.
The Chinese electric vehicle market is segmented by vehicle type and drivetrain type. Based on vehicle type, the market is segmented into passenger cars and commercial vehicles. Based on the drivetrain type, the market is segmented into battery-electric and plug-in hybrid electric vehicles. For each segment, market sizing and forecasting have been done based on value (USD billion).
By Drivetrain Type
| Battery Electric Vehicles |
| Plug-in Hybrid Electric Vehicles |
| Fuel-cell Electric Vehicles |
By Vehicle Type
| Passenger Cars | Hatchback |
| Sedan | |
| SUV | |
| MPV | |
| Commercial Vehicles | Light Commercial Vehicles |
| Buses & Coaches | |
| Medium & Heavy Trucks |
By Battery Chemistry
| LFP |
| NCM/NMC |
| NCA |
| Others |
By Price Band
| Less than USD 10,000 |
| USD 10,000 - 20,000 |
| USD 20,000 - 30,000 |
| USD 30,000 - 50,000 |
| Over USD 50,000 |
| By Drivetrain Type | Battery Electric Vehicles | |
| Plug-in Hybrid Electric Vehicles | ||
| Fuel-cell Electric Vehicles | ||
| By Vehicle Type | Passenger Cars | Hatchback |
| Sedan | ||
| SUV | ||
| MPV | ||
| Commercial Vehicles | Light Commercial Vehicles | |
| Buses & Coaches | ||
| Medium & Heavy Trucks | ||
| By Battery Chemistry | LFP | |
| NCM/NMC | ||
| NCA | ||
| Others | ||
| By Price Band | Less than USD 10,000 | |
| USD 10,000 - 20,000 | ||
| USD 20,000 - 30,000 | ||
| USD 30,000 - 50,000 | ||
| Over USD 50,000 | ||


Key Questions Answered in the Report
What is the current size of the Chinese electric vehicle market?
The Chinese electric vehicle market was USD 418.08 billion in 2026 and is projected to reach USD 908.9 billion by 2031.
Which drivetrain segment is growing fastest?
Plug-in hybrid electric vehicles are expected to record a 20.88% CAGR through 2031, the highest among powertrains.
How dominant is BYD in China’s electric vehicle landscape?
BYD held majority of national EV sales in 2024, leading a top-five cohort that collectively controls about majority of the market.
What role do battery-swap stations play?
Battery-swap networks from CATL, NIO, and partners promise two-minute exchanges that minimise downtime, which is especially valuable for logistics fleets.
Why are PHEVs popular in tier-2 and tier-3 cities?
They offer fuel savings and long-range flexibility where public charging remains sparse, aligning with cost-conscious buyers outside major metros.
Page last updated on:


