
China Data Center Storage Market Size and Share
Market Overview
| Study Period | 2020 - 2031 |
|---|---|
| Forecast Data Period | 2026 - 2031 |
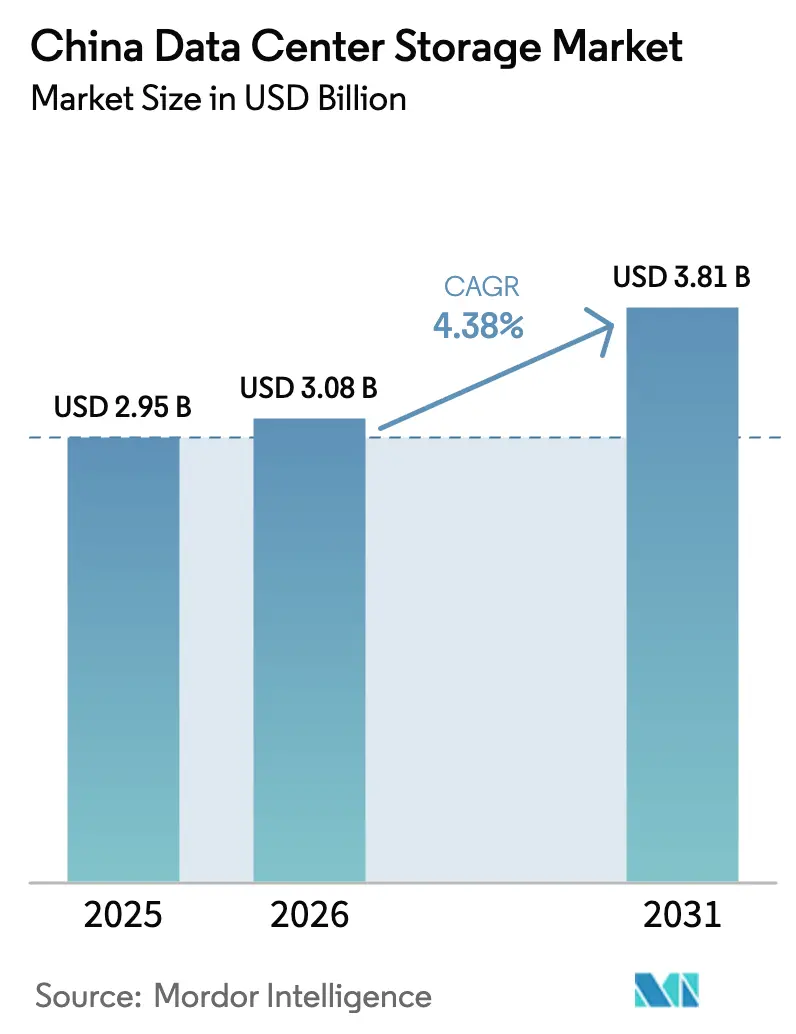
| Base Year Market Size (2025) | USD 2.95 Billion |
| Market Size (2026) | USD 3.08 Billion |
| Market Size (2031) | USD 3.81 Billion |
| Growth Rate (2026 - 2031) | 4.38 % |
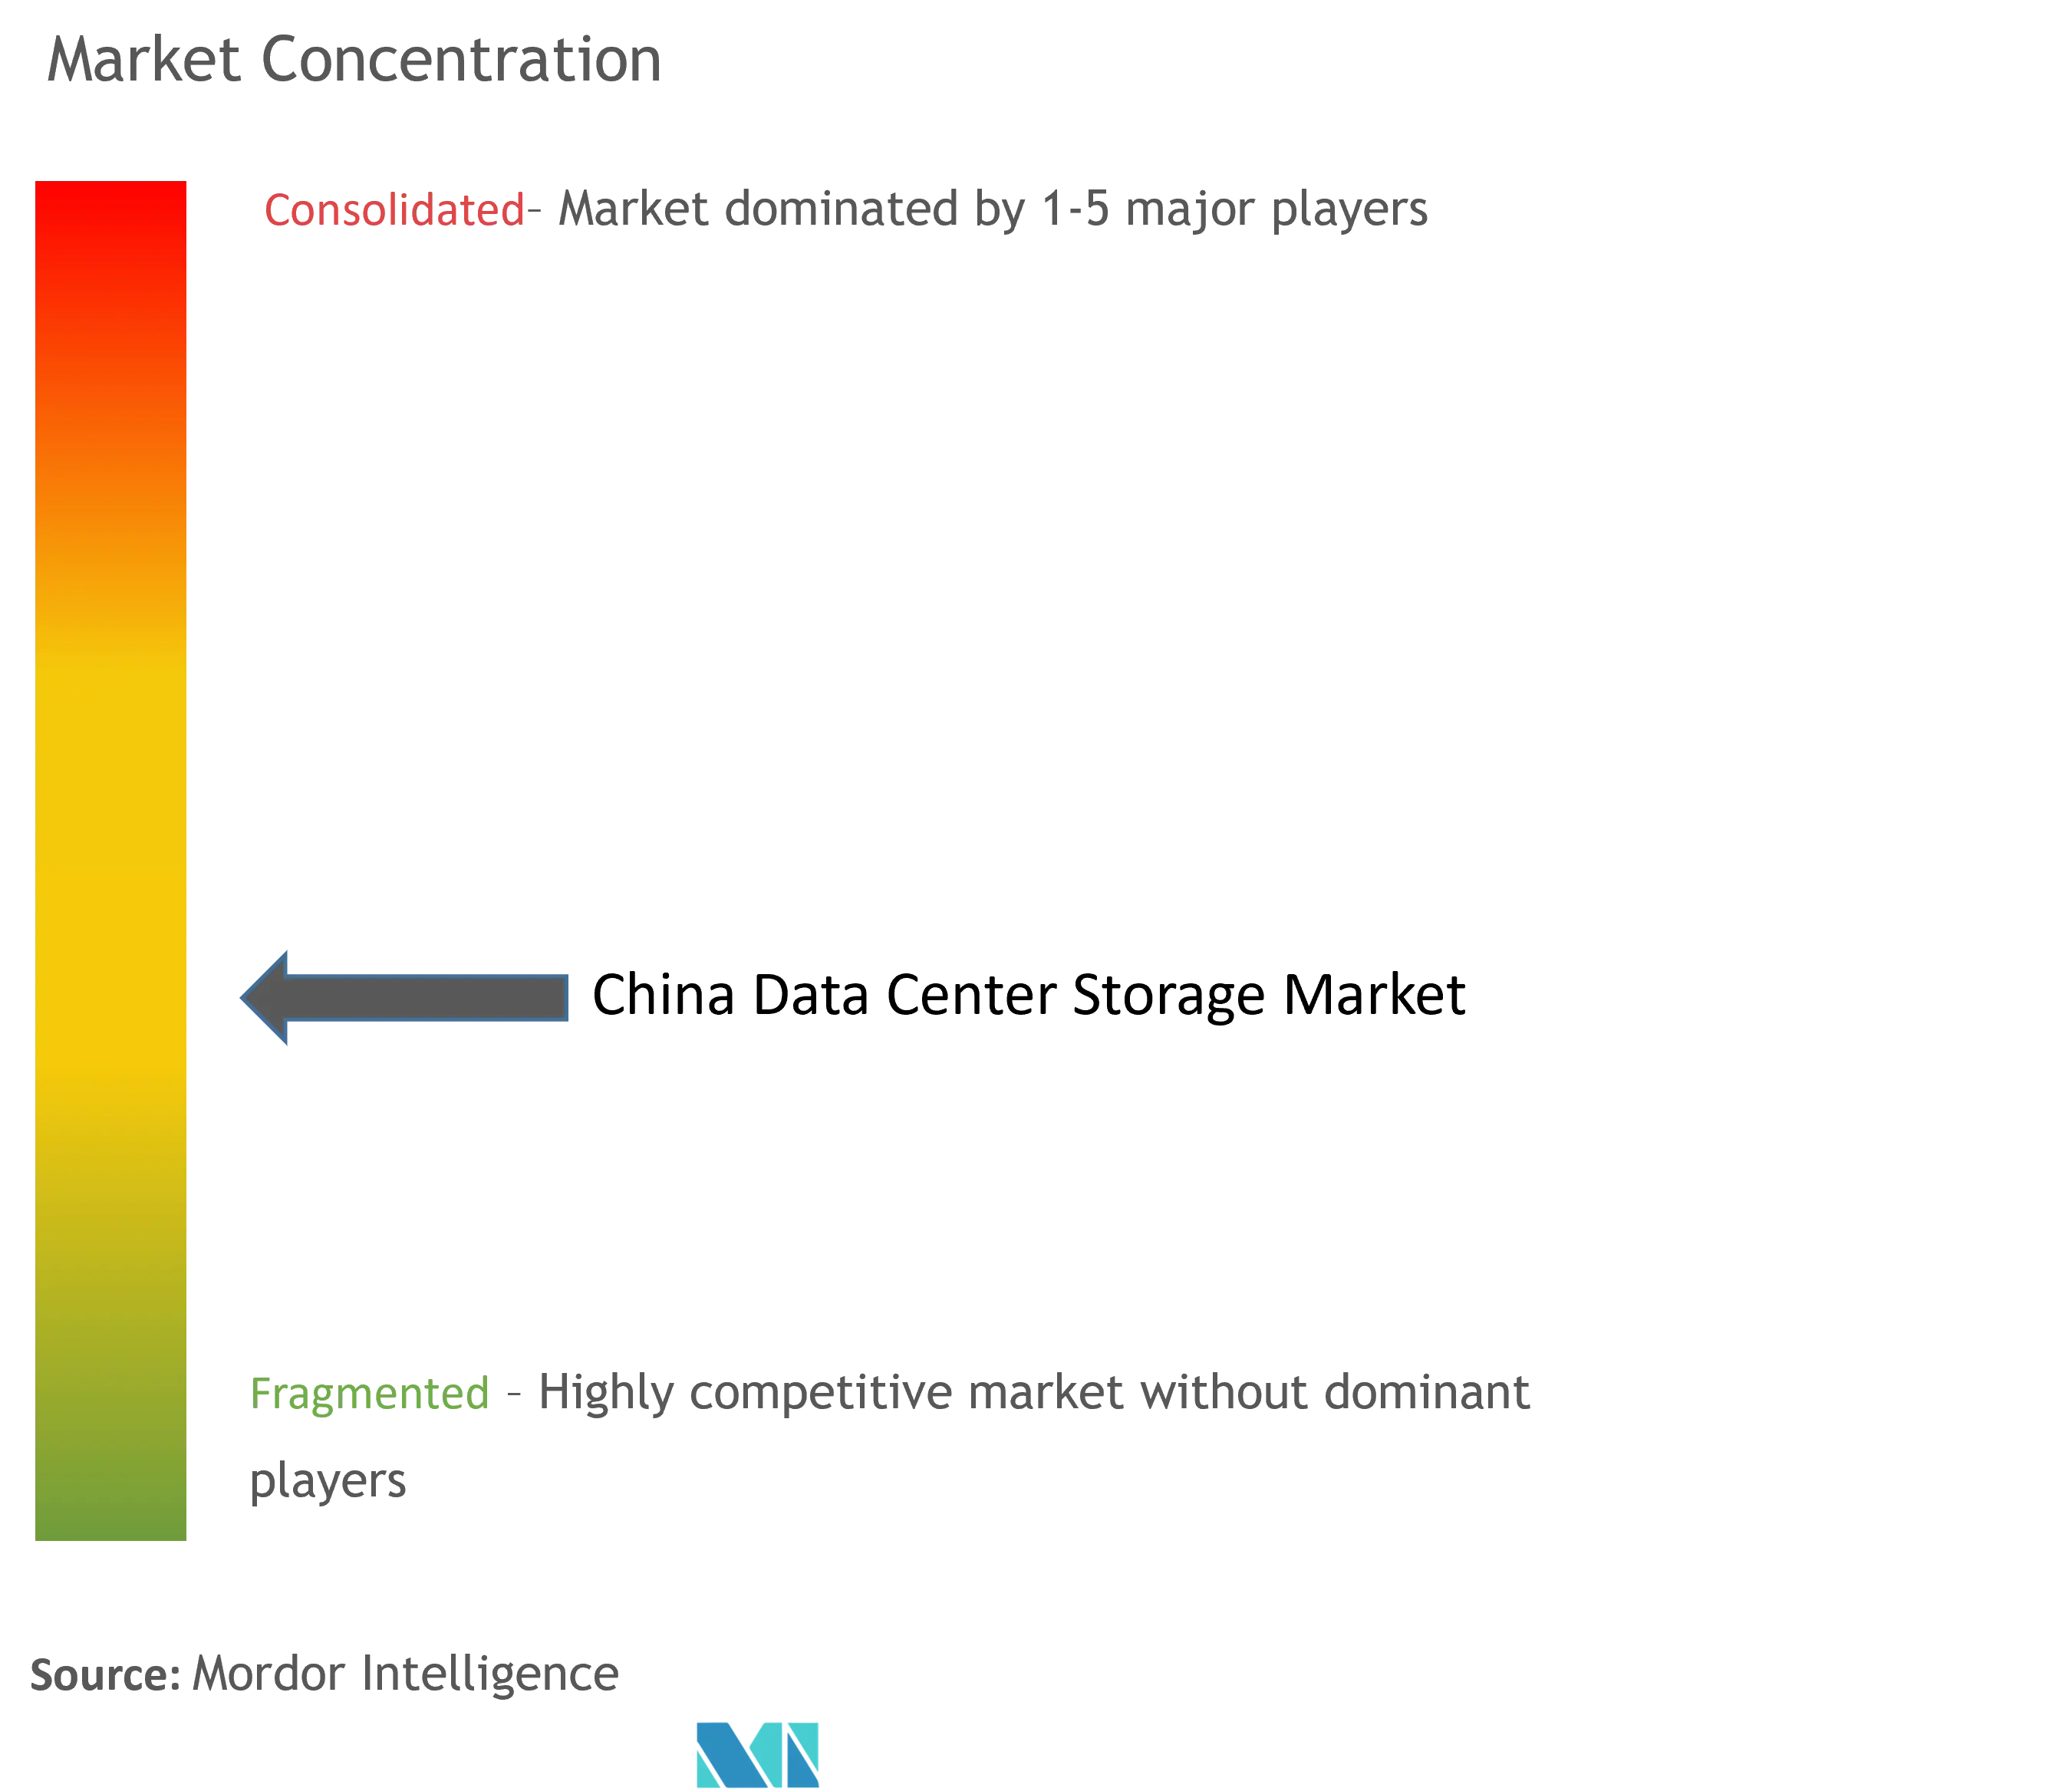
| Market Concentration | Medium |
Major Players *Disclaimer: Major Players sorted in no particular order Image © Mordor Intelligence. Reuse requires attribution under CC BY 4.0. | |
China Data Center Storage Market Analysis by Mordor Intelligence
The China data center storage market size is expected to grow from USD 2.95 billion in 2025 to USD 3.08 billion in 2026 and is forecast to reach USD 3.81 billion by 2031 at 4.38% CAGR over 2026-2031. Robust national programs—including the East-Data-West-Compute project—shift storage build-outs toward western provinces where renewable power costs sit 30% below coastal averages. Enterprises continue to favor colocation sites and high-performance arrays, yet adoption of object, tape, and software-defined platforms is accelerating alongside artificial-intelligence workloads. The China data center storage market is also shaped by power-efficiency rules in Tier-1 cities, tighter semiconductor export controls, and a growing preference for domestically designed NAND components. Vendors that can deliver high-IOPS flash, automated tiering, and intelligent data-management software are best placed to capture incremental growth as utilization gaps close and AI inference traffic rises.
Key Report Takeaways
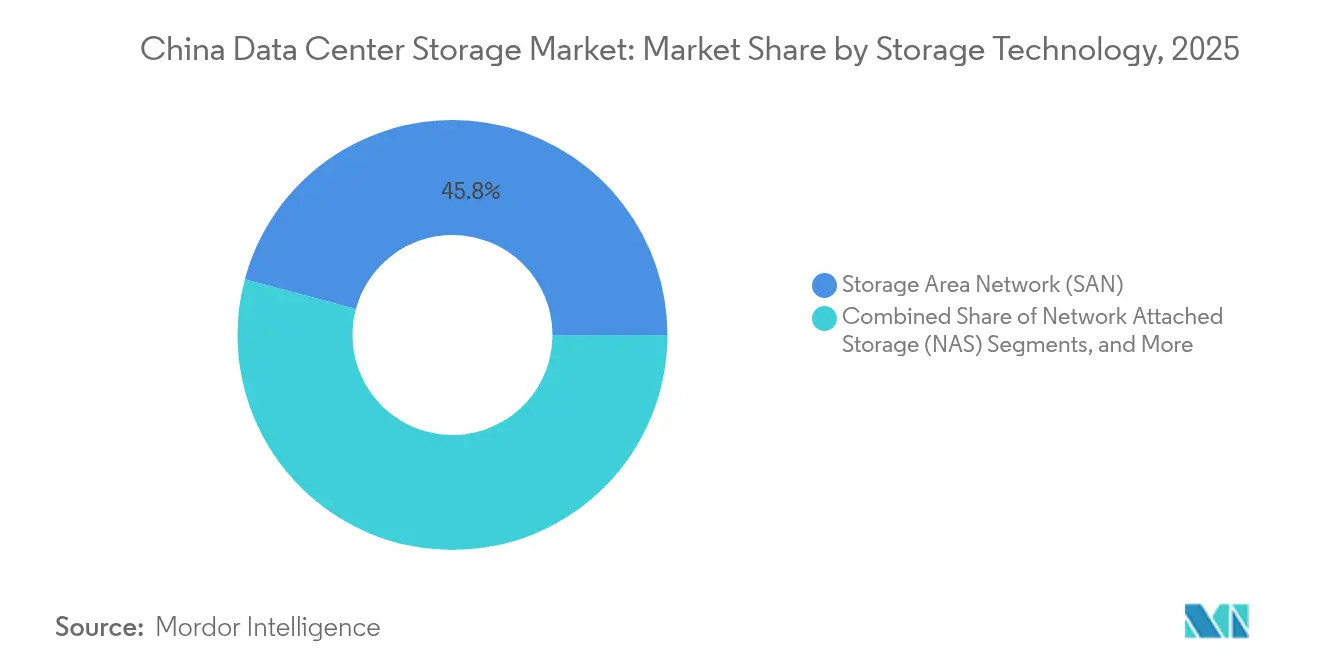
- By storage technology, Storage Area Networks led with 45.83% revenue share in 2025; object and tape solutions are projected to grow at a 6.05% CAGR through 2031 Yicai.
- By storage type, traditional HDD arrays accounted for 47.10% of the China data center storage market size in 2025, while all-flash arrays are advancing at a 7.55% CAGR.
- By data center type, colocation facilities held 66.60% of the China data center storage market share in 2025; hyperscaler deployments show the fastest CAGR at 8.22%.
- By end user, IT and telecommunications commanded 38.70% share of the China data center storage market size in 2025; healthcare and life sciences register the highest 9.05% CAGR.
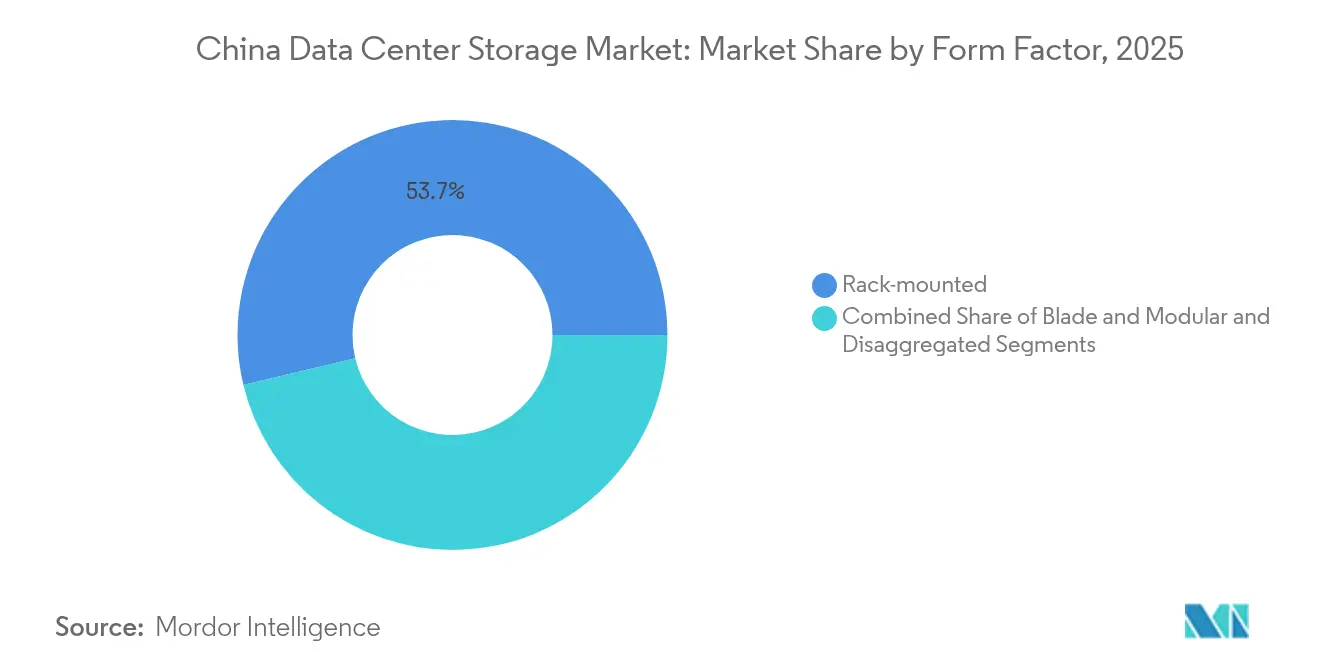
- By form factor, rack-mounted systems retained 53.74% share in 2025; composable storage is set to expand at 5.52% CAGR.
Note: Market size and forecast figures in this report are generated using Mordor Intelligence’s proprietary estimation framework, updated with the latest available data and insights as of 2026.
China Data Center Storage Market Trends and Insights
Drivers Impact Analysis*
| Driver | (~) % Impact on CAGR Forecast | Geographic Relevance | Impact Timeline |
|---|---|---|---|
| Cloud-first strategies of SOEs and internet giants | +1.2% | National, concentrated in Beijing, Shanghai, Shenzhen | Medium term (2-4 years) |
| National "East-Data-West-Compute" hub rollout | +0.8% | Western regions: Guizhou, Inner Mongolia, Gansu, Ningxia | Long term (≥ 4 years) |
| AI/LLM workload surge demanding high-IOPS flash arrays | +1.5% | Tier-1 cities with spillover to designated AI zones | Short term (≤ 2 years) |
| Growing adoption of SDS & HCI in Tier-2 city colos | +0.7% | Secondary cities: Chengdu, Wuhan, Xi'an, Nanjing | Medium term (2-4 years) |
| 5G edge-cloud integration for low-latency services | +0.6% | Urban centers with manufacturing clusters | Medium term (2-4 years) |
| Semiconductor self-reliance push boosting domestic NAND supply | +0.4% | National, with production hubs in Yangtze River Delta | Long term (≥ 4 years) |
| Source: Mordor Intelligence | |||
Cloud-First Strategies of SOEs and Internet Giants
State-owned enterprises and leading platforms such as Alibaba are raising capital-expenditure ceilings to meet digital-transformation mandates. Alibaba alone pledged USD 53 billion over three years for AI and cloud hardware, lifting near-term demand for multi-tier storage that supports analytics, training, and backup in a single stack. China Telecom’s healthcare subsidiary is rolling out provincial data pools that require scalable block and object capacity for imaging and genomic workloads. Unified public-and-private strategies increase orders for systems that combine NVMe performance with petabyte-scale object repositories, a sweet spot where the China data center storage market rewards vendors able to balance latency and cost. Procurement guidelines from SOEs also give preference to domestic controllers, offering local firms a route to higher bill-of-materials share.
National East-Data-West-Compute Hub Rollout
The East-Data-West-Compute program has committed almost USD 33 billion to build eight national hub nodes and 10 cluster zones, routing compute traffic away from grid-strained coastlines to renewable-rich inland sites.[1]State Council Information Office, “East-Data-West-Compute Project Overview,” scio.gov.cn Operators design western clusters for batch processing and archival workloads, spurring purchases of dense HDD cages and high-capacity object systems. Digital twins of grid assets feed real-time telemetry into these hubs, underscoring the need for intelligent tiering engines that migrate cold data to energy-efficient pools. Hardware selection now factors altitude, cooling requirements, and remote-management automation, which in turn elevates the China data center storage market’s appetite for AI-enabled orchestration software.
AI/LLM Workload Surge Demanding High-IOPS Flash Arrays
Large-language-model training drove national computing capacity 30% higher in 2023 and continues to lift IOPS budgets in Tier-1 cities. Huawei’s April 2025 launch of the OceanStor A-series AI lake underlines how vendors tailor parallel-file architectures, NVMe-over-Fabrics, and smart-NIC acceleration to sustain sub-100 µs read latencies.[2]Huawei Technologies, “OceanStor A-Series and AI Data Lake Launch,” huawei.com Model-inference traffic now exceeds training traffic at several hyperscale sites, pushing operators to deploy dual-personality arrays that juggle small-file random access with deep-archive throughput. The China data center storage market, therefore, skews toward all-flash systems enhanced by computational storage drives and data-reduction ASICs to optimize cost per inference query.
Semiconductor Self-Reliance Push Boosting Domestic NAND Supply
Beijing’s Made-in-China 2025 roadmap prizes indigenous flash processes; YMTC’s 294-layer 3D TLC and QLC breakthroughs reduce the import bill for SSDs.[3]YMTC, “294-Layer 3D NAND Mass Production Announcement,” ymtc.com Local fabs benefit from tax rebates and preferential power tariffs, easing cost barriers for all-flash deployments. Greater in-country wafer capacity stabilizes supply during geopolitical friction, letting integrators secure consistent drive allocations for long-term contracts. As controller and firmware capability rises, the China data center storage market rewards suppliers that co-optimize silicon and enclosure design for local regulatory and security mandates.
Restraints Impact Analysis*
| Restraint | (~) % Impact on CAGR Forecast | Geographic Relevance | Impact Timeline |
|---|---|---|---|
| Power-use efficiency caps in Tier-1 metros | -0.9% | Beijing, Shanghai, Guangzhou, Shenzhen | Short term (≤ 2 years) |
| Import restrictions on advanced controllers › supply risk | -0.6% | National, affecting high-end enterprise deployments | Medium term (2-4 years) |
| Under-utilization of newly built AI data centers | -0.4% | AI-designated zones and industrial parks | Short term (≤ 2 years) |
| Shortage of skilled data-storage architects outside coastal regions | -0.3% | Western and central provinces | Long term (≥ 4 years) |
| Source: Mordor Intelligence | |||
Power-Use-Efficiency Caps in Tier-1 Metros
Beijing, Shanghai, and Guangzhou mandate PUE below 1.3 for new halls and impose retrofit timelines on legacy sites, restricting rack-level watt budgets and cooling density. Operators replace HDD JBODs with flash shelves, drawing 80% less power, yet initial capex remains a hurdle for smaller enterprises. Liquid-immersion pods and underwater modules off Hainan absorb up to 100 kW per rack while meeting urban planning codes. These constraints moderate near-term shipment volumes but shift the China data center storage market toward energy-efficient architectures with granular power-capping firmware.
Import Restrictions on Advanced Controllers › Supply Risk
The October 2024 expansion of U.S. export rules widens the entity list to cover advanced NAND controllers essential for 200-layer NVMe drives. Domestic OEMs scramble to dual-source silicon and redesign boards around locally licensed IP. Lead times for top-end PCIe 5.0 cards stretch beyond 30 weeks, forcing hyperscalers to over-provision older PCIe 4.0 fleets. While China funds joint ventures to accelerate controller tape-outs, short- and mid-term supply uncertainty drags on the China data center storage market’s high-performance segment.
*Our forecasts treat driver/restraint impacts as directional, not additive. The impact forecasts reflect baseline growth, mix effects, and variable interactions.
Segment Analysis
By Storage Technology: Enterprise SAN Holds Ground as Object Platforms Accelerate
SAN deployments accounted for 45.83% of 2025 revenue within the China data center storage market, reflecting entrenched demand for centralized block storage from state banks, telecom core networks, and ERP workloads. Established Fibre-Channel fabrics, high availability, and certified interoperability keep procurement cycles locked into SAN replacements even as software-defined options mature. Over the forecast window, most SAN refreshes include NVMe-FC upgrades and intelligent tiering to object repositories, helping CIOs manage surging AI training datasets without abandoning existing workflows.
At the same time, object and tape solutions post a 6.05% CAGR, the fastest among all technologies. AI model training consumes petabyte-scale image and text corpora, well suited to S3-compatible platforms backed by cost-optimized HDDs or next-generation optical media capable of 1.6 Pb per platter. Tape libraries also regain relevance because cold-archive regulations require offline copies for critical data. Vendors that offer seamless namespace sharing between SAN and object clusters gain an advantage as enterprises modernize at their own pace across the China data center storage market.



By Storage Type: Flash Displaces Spinning Media at the Performance Tier
HDD arrays still delivered 47.10% of 2025 revenue in the China data center storage market size, yet year-on-year trendlines favor solid-state drives. All-flash arrays expand at 7.55% CAGR to 2031 as AI inference, realtime analytics, and high-frequency trading reject mechanical latency. YMTC’s QLC endurance improvements narrow the price gap, encouraging banks and cloud providers to migrate relational databases to flash tiers during refresh cycles. Power-efficiency mandates further tilt procurement toward SSDs that draw one-fifth the watts per terabyte compared to 15 K RPM SAS drives.
Hybrid systems remain essential for mid-tier workloads needing cost-effective bulk capacity with a flash cache front end. Vendors mix QLC SSDs, PMR HDDs, and compression ASICs in a single chassis, providing a glide path for customers to transition gradually. As a result, shipments of pure HDD enclosures decline, yet cold-archive vaults continue purchasing multi-TB helium drives for write-once storage. The China data center storage market therefore evolves into a two-tier model—flash for active datasets and high-density HDD or tape for deep archives.
By Data Center Type: Colocation Retains Leadership While Hyperscalers Surge
Colocation operators held a 66.60% share in 2025, thanks to enterprises outsourcing power-intensive and compliance-driven workloads to professional facilities. Commit rates at the leading provider, GDS, stand near 93%, underscoring persistent demand for secure, carrier-neutral space. Retail colos differentiate through service catalogs that bundle backup-as-a-service and archiving, driving incremental purchases of mass-capacity storage arrays.
Hyperscale and cloud-service providers, however, post the fastest 8.22% CAGR as Alibaba, Tencent, Huawei Cloud, and ByteDance accelerate AI cluster deployments. Their three-year capex plans lock in forward buy-tiers for SSDs, pushing flash suppliers toward long-term supply commitments. Enterprise-owned on-premises halls shrink as firms face PUE ceilings and skill shortages. Edge micro data centers are located in factories and telecom central offices, but they represent a small sliver of the China data center storage market size, albeit one expected to scale rapidly once 5G private networks mature.
By End User: Healthcare Outpaces an IT-Telecom Core
IT and telecom customers delivered 38.70% of 2025 revenues in the China data center storage market; their steady refresh cycles and new-protocol adoption will continue, but growth rates flatten. Conversely, hospitals, genomics labs, and pharmaceutical research institutes are forecast to log 9.05% CAGR as 8K imaging, pathology digitization, and population-scale sequencing projects intensify storage density requirements. China Telecom’s Zhongdian Telecom Yikang subsidiary illustrates telco entry into healthcare clouds, rolling out PACS-friendly block storage racks and S3 tiers across provinces.
Manufacturing absorbs storage for smart-factory video analytics and digital twins, while BFSI focuses on encrypted flash arrays that meet strict data-sovereignty codes. Government clouds require domestic encryption algorithms and zero-trust access controls, thereby steering contracts toward local vendors. Each vertical thus drives distinct technical features, yet common across segments is heightened interest in integrated ransomware protection and immutable snapshots within the China data center storage market.
By Form Factor: Rack Systems Dominate as Composable Architectures Gain Mindshare
Rack-mounted chassis constituted 53.74% of shipments in 2025, reflecting standardized 19-inch cabinet layouts that simplify cable management and airflow modeling. Upgrades now embed E1.S and E3.S ruler drives, lifting per-rack capacity beyond the 1 PB mark. Composable storage grows 5.52% CAGR as cloud-native developers embrace NVMe-oF and PCIe switch fabrics that disaggregate compute and storage resources. Such systems increase utilization by pooling flash at pod level and assigning lanes dynamically.
Blade and modular designs carve out specialized niches—particularly in high-density AI training nodes that require front-loading of GPUs and rear-loading of NVMe bricks. Edge gateways deploy miniature enclosures with fanless cooling for harsh plant-floor environments but remain small in absolute numbers. For the China data center storage market, suppliers that package software-defined orchestration in familiar rack form factors help customers evolve incrementally without forklift upgrades.
By Interface: NVMe Rises as Legacy Protocols Persist in Mixed Fleets
SAS and SATA still represented 57.10% of the 2025 interfaces in the China data center storage market share, a testament to the installed base's inertia and the acceptable throughput for archival and nearline workloads. Nevertheless, NVMe demonstrates a 6.01% CAGR, propelled by PCIe 5.0-driven latency benefits. UNIS and other domestic manufacturers now ship SSDs reading up to 14.9 GB/s, broadening local ecosystem options. Fibre Channel remains entrenched in financial data centers that prioritize lossless transport, while iSCSI endures within mid-market appliance lines.
Operators deploy NVMe shelves for AI inference clusters, yet continue to order SAS disks for content vaults. NVMe-oF gateways let both zones coexist, allowing customers to delay full network upgrades. Over time, protocol abstraction within software-defined controllers will make interface differences invisible; however, for now, the China data center storage market must balance breakthrough speed with predictable costs.
Geography Analysis
Eastern seaboard provinces, Beijing, Shanghai, and Guangzhou, contributed roughly 44.60% of 2025 shipments in the China data center storage market as banks, regulators, and cloud titans demand ultra-low-latency access to core systems. However, PUE caps, land scarcity, and premium utility tariffs prompt an outward pivot toward secondary hubs such as Chengdu, Wuhan, and Xi’an. These cities offer dark-fiber routes to coastlines, while providing 20% lower real estate costs and supportive municipal incentives.
Western clusters in Guizhou, Inner Mongolia, Gansu, and Ningxia are accelerating the fastest under the East-Data-West-Compute blueprint, leveraging cool climates and abundant hydroelectric or wind power. Guizhou’s big-data corridor welcomes both state-backed and private operators, bundling tax breaks with renewable-energy quotas that cut operating expenses by a third. The China data center storage market size for western provinces, therefore, is expected to post double-digit growth, favoring bulk capacity arrays optimized for batch analytics and archival repositories.
Southern regions tie growth to export manufacturing and Hong Kong finance. Guangdong’s Pearl River Delta couples 5G private networks with edge compute nodes near industrial parks, generating sustained NVMe appliance demand. Northern provinces remain policy centers yet exhibit more measured expansion, focusing on system upgrades rather than greenfield sites. Cross-regional workload orchestration, supported by telecom dispatch centers, increases the value of distributed snapshots, WAN-optimized replication, and automated compliance tagging across the China data center storage market.
Regulatory Landscape
China data center storage deployments are shaped by a tightening data-governance stack led by the Cybersecurity Law (CSL), Data Security Law (DSL), and Personal Information Protection Law (PIPL), which together govern localization, security controls, and cross-border transfer workflows for enterprise and cloud operators. A key inflection was the Regulations on Network Data Security Management taking effect on January 1, 2025, which moved compliance requirements from guidance toward administrative enforcement for network data processing activities that involve storage, backup, and disaster recovery designs.
Energy and efficiency policy is also feeding into storage architecture choices. MIIT and related authorities advanced the Special Action Plan for Green and Low-carbon Development of Data Centers (July 2024), reinforcing green data center standards used in government and state procurement and aligning build approvals with metrics such as PUE performance and coordinated cloud-network scheduling. As a result, operators in Tier-1 metros and national hub regions are pushed to adopt higher-efficiency flash, intelligent tiering, and automation that can demonstrate measurable reductions in energy per workload while maintaining security and auditability.
Value Chain Analysis
The China data center storage value chain covers upstream component and system suppliers (NAND, controllers, HDDs, servers, enclosures, networking, power and cooling), midstream infrastructure owners and operators (hyperscalers and cloud providers, telecom carriers, and colocation/IDC operators), and downstream enterprise and public-sector users that consume block, file, object, and archival services. Export-control frictions around advanced controllers and the domestic substitution push described in the report elevate the role of Chinese flash and system ecosystems, including YMTC NAND adoption alongside local OEM integration, while Tier-1 PUE constraints increase demand for all-flash and software-defined control planes that improve utilization and reduce watt-per-TB.
Partnership-led integration is changing how storage is specified, financed, and operated across facilities and platforms. In April 2026, GLP and Huawei announced a strategic partnership to combine digital infrastructure asset capabilities with ICT solutions, pointing to closer coupling between real-estate-led data center buildouts and vendor-led storage and management stacks. At the same time, MIIT initiatives to improve cloud-network coordination and direct-connect networks between national data center clusters increase the importance of interconnect and replication software, and policy-based data management across regions, particularly for East-Data-West-Compute deployments where storage tiers are split between coastal and inland nodes.
Competitive Landscape
Competition in the China data center storage market intensifies as domestic suppliers close technology gaps with multinational companies. Inspur captured 11.4% share in Q1 2024, posting 13.6% sales growth on the back of hyper-converged clusters for finance and healthcare customers. YMTC surpassed Samsung in domestic SSD unit sales during 2024’s Singles’ Day, indicating rising confidence in local flash brands. Huawei continues to pioneer magneto-electric drives promising 90% lower power draw and tape-class cost, aligning perfectly with energy-efficiency mandates.
International vendors retain corporate accounts through long-standing service and compatibility contracts; however, export-control risks prompt them to localize production and firmware. ZTE expands its portfolio into distributed object systems, targeting telecom and rail operators, while GDS and VNET invest in self-developed cloud storage software to deepen vertical integration. Start-ups focus on Kubernetes-native storage, erasure-coding parity engines, and zero-trust snapshot validation, vying for white-space segments such as edge federated learning.
Vendor strategies converge on tight coupling between hardware, data-protection software, and orchestration APIs. Partnerships with domestic silicon houses, AI accelerator firms, and renewable-energy providers create joint value propositions. Compliance with China-specific cryptographic regulations and support for confidential computing frameworks further distinguish bids. Against this backdrop, the China data center storage market rewards firms delivering turnkey AI pipelines, multi-protocol tiering, and proactive cybersecurity analytics.
China Data Center Storage Industry Leaders
Huawei Technologies Co., Ltd.
Alibaba Cloud Computing Co., Ltd.
Inspur Electronic Information Industry Co., Ltd.
Dell Technologies Inc.
Hewlett Packard Enterprise Company
- *Disclaimer: Major Players sorted in no particular order

Market Opportunities and Future Outlook
Policy-driven rebalancing toward national hub regions under East-Data-West-Compute creates whitespace for storage solutions designed for cross-region operations, including WAN-efficient replication, distributed snapshots, and lifecycle management that can shift datasets between Tier-1 demand centers and western capacity zones. The program-level targets referenced in recent policy, including newly added computing power in hub regions exceeding 60% of the national total by end-2025, alongside efficiency and utilization metrics such as average PUE below 1.5 and availability at or above 60%, strengthen the business case for automated tiering across SAN, object, and tape, as well as observability tooling that quantifies energy and utilization gains for procurement.
AI data center architectures are also creating room for differentiated, full-stack storage platforms that combine high-IOPS tiers with scalable object and backup layers while remaining within domestic supply and security constraints. Huawei’s May 2026 release of a full-stack data infrastructure offering for AI data centers, including OceanStor Pacific scale-out storage, indicates competition is shifting from point products to integrated data infrastructure for training and inference pipelines. Large domestic compute procurement programs, such as China Telecom’s June 2026 server purchase tied to the Kunpeng ecosystem, further reinforce demand for storage stacks that align with domestically oriented architectures and can be deployed consistently across telecom-grade facilities, colocation sites, and cloud zones.
Recent Industry Developments
- July 2026: Huawei Technologies Co., Ltd. launched the OceanStor Dorado 18000 (Dorado V7) all-flash storage solution at Huawei Connect Shanghai. The launch expands the high-end all-flash storage segment in China and shows momentum in premium storage deployments. It reinforces Huawei’s push in AI-ready storage for data centers and AI inference workloads.
- July 2026: Alibaba Cloud (Alibaba Group) reportedly considering an increase in its three-year AI infrastructure capex to $69.05 billion. The plan points to higher AI data center investment in China. It signals aggressive capacity expansion and competitive pressure in the domestic cloud and storage market to support AI workloads.
- June 2026: Alibaba Cloud (Alibaba Group) announced new availability zones in France, Japan, Malaysia, and Mexico. The expansion broadens the global data center footprint and affects storage demand and regional data residency considerations. It enhances cloud storage demand and global redundancy capabilities, reinforcing market reach and resilience.


Research Methodology Framework and Report Scope
Market Definition and Coverage
This market covers revenue earned from storage systems and related storage software that are deployed inside data centers in China to store, protect, and move enterprise and cloud data, including arrays and platforms used for primary and secondary storage.
Scope exclusions: This sizing does not count general-purpose servers, networking gear, or pure data center construction and operations services.
Segmentation Overview
- By Storage Technology
- Network Attached Storage (NAS)
- Storage Area Network (SAN)
- Direct Attached Storage (DAS)
- Object and Tape Storage
- By Storage Type
- Traditional HDD Arrays
- All-Flash Arrays (AFA)
- Hybrid Storage
- By Data Center Type
- Colocation Facilities
- Hyperscalers/Cloud Service Providers
- Enterprise and Edge
- By End User
- IT and Telecommunication
- BFSI
- Government and Public Sector
- Media and Entertainment
- Healthcare and Life Sciences
- Manufacturing
- By Form Factor
- Rack-mounted
- Blade and Modular
- Disaggregated / Composable
- By Interface
- SAS / SATA
- NVMe
- Fibre Channel and iSCSI
Data Sources, Market Sizing, and Validation
Desk Research
Desk research was used to set the market boundary, build the first demand map, and stress test early assumptions on storage adoption in Chinese data centers. Public sources such as the MIIT of China releases, CAICT publications, and National Bureau of Statistics (NBS) data were used to anchor the broader digital infrastructure context and investment cycles.
We also reviewed materials from standards and policy bodies such as the National Information Security Standardization Technical Committee (TC260). Where relevant, customs and trade releases were reviewed to understand hardware availability and the direction of pricing. On the industry side, we used company filings, investor presentations, reputable press, and technical journals to track product transitions such as NVMe interfaces and software-defined storage. Select paid subscriptions covering company financials and intelligence, news and financials, patent databases, and shipment-level import and export data were used to fill gaps where public data was not detailed enough. The sources listed here are illustrative, and many other public documents and datasets were also used for data collection, validation, and clarification.
Primary Interviews and Surveys
Primary work focused on validating how storage is purchased and deployed across colocation operators, cloud-focused data centers, and large enterprise facilities, since procurement behavior can vary by workload type. We spoke with a mix of storage buyers, channel and integration participants, and technical leaders to confirm replacement cycles, preferred architectures (NAS, SAN, and object), and practical price bands by capacity and performance. We then rechecked edge cases where the evidence differed across sources.
Distribution of primary research fieldwork respondents
| Company type | Respondent position |
|---|---|
| Top tier: 26% | CXOs: 12% |
| Mid tier: 58% | Functional/Unit leaders: 33% |
| Smaller Players: 16% | Managers: 55% |
Market-Sizing & Forecasting
Sizing started with a top-down build where China data center storage demand was reconstructed using the installed base and expansion of data center capacity, followed by storage intensity assumptions by workload type. To keep the model grounded, the totals were compared against selective bottom-up approximations such as sampled vendor and channel revenue splits, and then checked again using ASP times estimated shipment volumes for key form factors.
Practical inputs that moved the model included estimated data center IT load additions and utilization, the mix shift between traditional storage and all-flash or hybrid arrays, the adoption pace of software-defined storage, interface transitions such as NVMe versus SAS or SATA, and refresh cycles tied to reliability and performance needs. Where direct numbers were not available, gaps were handled through ranges that were narrowed using interview feedback, and by borrowing ratios from closely related infrastructure indicators that could be observed consistently over time.
Forecasting used scenario analysis with trend smoothing. A base case was built from expected capacity rollouts and replacement demand, then adjusted for supply-side constraints and price movements that were repeatedly cited by interviewees. Final outputs were produced in USD with consistent currency timing assumptions so year-to-year comparisons stayed clean.
Data Validation & Update Cycle
Validation was done by triangulating the model against independent signals, including reported data center build activity, observable changes in storage technology mix, and supplier commentary on demand direction. Any sharp jumps in growth, price, or mix were flagged, and then the assumptions behind them were reworked or reconfirmed through follow-up outreach.
Before sign-off, the logic and calculations go through multiple analyst reviews, including cross-checks of unit economics and year-over-year variance bands. The report is refreshed annually, with interim updates completed when a material policy, supply, or demand event is likely to change the outlook. Right before delivery, a final pass is run so the published numbers reflect the latest available information.
Mordor Intelligence's China Data Center Storage Market Size Measured Against Other Published Estimates
Published market values for China data center storage do not always match across sources, even when they use similar words. Differences often come from how storage is defined, the cut of end users, and how frequently pricing updates are refreshed.
The table below shows this spread clearly, and it is usually driven by what gets counted as storage, how cloud and colocation purchases are treated, and whether the estimate follows hardware only or hardware plus software.
The biggest gap drivers in this market tend to be scope mixing between data center storage and broader external storage, aggressive versus base case expectations for flash adoption, and different ways of converting shipments into revenue when prices are moving. Some estimates also blend enterprise IT storage that is not inside data centers, which can lift the number quickly, while others apply long forecasting windows that compound assumptions without enough revalidation.
Benchmark comparison
| Source | Market Size | Gaps in Research Methodology |
|---|---|---|
| Mordor Intelligence | USD 2.95 B (2025) | |
| Regional Consultancy A | USD 6.44 B (2025) | The estimate appears to include a wider component mix and deployment scope (hardware plus software across on-premises, cloud-based, and hybrid), which can pull in spending that is not strictly tied to data center storage deployments. |
| Trade Journal B | USD 6.92 B (2024) | This figure is reported for China enterprise external storage revenue and can include categories like HCI and SDS that are not limited to data center environments, and year timing differs which can shift USD totals when pricing changes. |
The table points to scope as the main reason for the gap, and in Mordor Intelligence's model, only storage revenue tied to data center deployment use cases is counted, rather than the full enterprise external storage spend across all environments. Once the market is kept inside that boundary, the remaining differences are mostly explained by how fast flash mix is assumed to rise and how often ASP assumptions are refreshed through interviews and basic channel checks.


Key Questions Answered in the Report
What is the current size of the China data center storage market?
The market is valued at USD 3.08 billion in 2026 and is projected to reach USD 3.81 billion by 2031, growing at a 4.38% CAGR.
Which storage technology leads in China today?
Storage Area Networks hold the top position with 45.83% market share in 2025, thanks to strong uptake in finance and telecom sectors.
How fast are all-flash arrays growing?
All-flash arrays are expanding at a 7.55% CAGR, the fastest among primary storage types, driven by AI inference and power-efficiency mandates.
Why are western provinces gaining storage investment?
The East-Data-West-Compute initiative channels workloads to inland regions offering cheaper renewable power and ample land, boosting storage demand there.
Which end-user vertical shows the highest growth?
Healthcare and life sciences lead with a 9.05% CAGR as hospitals adopt AI imaging and genomic sequencing platforms requiring substantial storage capacity.
How do power-use-efficiency regulations affect new builds?
Tier-1 cities cap PUE at 1.3, motivating operators to deploy flash arrays and advanced cooling to meet efficiency targets without compromising density.
Page last updated on:
- Data Center Server Market Global servers demand, split by tier, facility size and facility type.
- Artificial Intelligence (AI) Data Center Market AI facilities across the global market, covering facility type, component and tier.
- Data Center Construction Market Construction worldwide, split by tier, facility size and facility type.
- South Korea Data Center Server Market South Korea servers, split by data-center tier, form factor and application / workload.
- South Korea Hyperscale Data Center Market South Korea's hyperscale sites, split by facility type, component and tier.
- Spain Hyperscale Data Center Market Hyperscale sites demand across Spain, covering facility type, component and tier.
- China Data Center Processor Market Processors demand across China, covering facility size and tier.
- Spain Artificial Intelligence (AI) Data Center Market Spain's AI facilities, split by facility type, component and tier.





